American Journal of Engineering Research (AJER)
e-ISSN: 2320-0847 p-ISSN : 2320-0936
Volume-5, Issue-7, pp-169-175
www.ajer.org
Research Paper Open Access
w w w . a j e r . o r g
Page 169
Environmental Assessment on the Operative Mode of Tanneries
And Brickfields In India Using Water Footprint Tool
Zareena Begum Irfan
a,*and Mohana Mondal
b a,Associate Professor, Centre of Excellence in Environmental Economics, Madras School of Economics, Gandhi Mandapam Road, Chennai – 600025, Tamil Nadu, India
b
Research Associate, Centre of Excellence in Environmental Economics, Madras School of Economics, Gandhi Mandapam Road, Chennai – 600025, Tamil Nadu, India
ABSTRACT:
Humanity relies on ecosystem products and services .These products and services include resources, waste absorptive capacity, and space to host urban infrastructure. Careful management of human interaction with the biosphere is essential to ensure future prosperity and sustainable development. Regenerative capacity and waste absorbing capacity of the environment has to be taken into account in order to pave way for progress in a sustainable manner. The National Footprint Accounts includes the supply and demand sides of the ecology along with prevailing historical trends and aim to provide ways that may be applied across countries over time. “Water footprint” means the amount of water used by a household or a country, or the amount used for a given task or for the production of a given quantity of some product or crop. The term “water footprint” is often used to refer to the amount of water used by an individual, community, business, or nation. The water footprint of a product is the volume of freshwater used to produce the product, measured over the full supply chain. It includes the water used directly (e.g., from a tap) and also indirectly. It also includes the water it took to produce the food we eat, the products we buy, the energy we consume and even the water we save when we recycle. We may not drink, feel or see this virtual water, but it makes up the majority of our water footprint. The concept of „„virtual water‟‟ deserves special mention in this regard. Virtual water trade refers to the hidden flow of water if food or other commodities are traded from one place to another. The concept of virtual water enables us to realize how much water is needed to produce different goods and services. Water footprint is a multidimensional indicator, showing water consumption volumes by source and by type of pollution; all components of a total water footprint are specified geographically and temporally. The issue of water scarcity in India is getting serious day-by-day. Water scarcity is fast becoming urban India's number one woe, with government's own data revealing that residents in 22 out of 32 major cities have to deal with daily shortages. In this paper the authors calculate the water footprint in Indian brick manufacturing industry and leather industry to assess their water intensity.Keyword:
tanneries, brick field, virtual water, water footprint, water intensity, direct indirect impacts. JEL CODES: P-28, Q-25, Q-29, Q-50, Q-53, Q-56, Q-57, Q-59I.
INTRODUCTION
Humanity relies on ecosystem products and services .These products and services include resources, waste absorptive capacity, and space to host urban infrastructure. Human demand has well exceeded the levels of regenerative and absorptive capacity of the biosphere which is evident from the present scenario of environmental degradations like deforestation, collapsing fisheries, accumulation of carbon dioxide in the environment in excess amount leading to global warming. Careful management of human interaction with the biosphere is essential to ensure future prosperity and sustainable development. Regenerative capacity and waste absorbing capacity of the environment has to be taken into account in order to pave way for progress in a sustainable manner. The National Footprint Accounts includes the supply and demand sides of the ecology along with prevailing historical trends and aim to provide ways that may be applied across countries over time.
―Water footprint‖ means the amount of water used by a household or a country, or the amount used for a given
task or for the production of a given quantity of some product or crop. The term ―water footprint‖ is often used
w w w . a j e r . o r g
Page 170
product is the volume of freshwater used to produce the product, measured over the full supply chain. Water footprint is the amount of water used in and around our home, school or office throughout the day. It includes the water used directly (e.g., from a tap) and also indirectly. It also includes the water it took to produce the food we eat, the products we buy, the energy we consume and even the water we save when we recycle. We may not drink, feel or see this virtual water, but it makes up the majority of our water footprint. The concept of
‗‗virtual water‘‘ deserves special mention in this regard. Virtual water trade refers to the hidden flow of water if
food or other commodities are traded from one place to another. The concept of virtual water enables us to realize how much water is needed to produce different goods and services.
The issue of water scarcity in India is getting serious day-by-day. Water scarcity is fast becoming urban India's number one woe, with government's own data revealing that residents in 22 out of 32 major cities have to deal with daily shortages. The worst-hit city is Jamshedpur, where the gap between demand and supply is a yawning 70%. The crisis is acute in Kanpur, Asansol, Dhanbad, Meerut, Faridabad, Visakhapatnam, Madurai and Hyderabad — where supply fails to meet almost 30% of the demand — according to data provided by states which was placed in the LokSabha during the recently-concluded Parliament session by the urban development ministry. The figures reveal that in Greater Mumbai and Delhi — which have the highest water demand among all cities — the gap between demand and supply is comparatively less. The shortfall is 24% for Delhi and 17% for Mumbai. However, the situation is worse than that. For example, in Delhi, 3,156 million litres of water (MLD) is supplied against the requirement of 4,158. But around 40% of the supply is lost in distribution resulting in a much wider gap between demand and supply than what's recorded.
Previously no work has been done to analyse the water footprint in Indian industries though the same has been extensively done for Indian agriculture. The present research study focuses on the present day scenario of water footprint in Indian Leather Tanning Industry and Brick Manufacturing Industries. Water footprint is calculated and at the end water footprint sustainability assessment has also been done. The target is to assess the water footprints related to the consumption of industrial commodities in India and to assess the water scarcity in India.
II.
REVIEW OF LITERATURE
The water footprint of a nation should clearly not be seen as the ultimate indicator of sustainability, but rather as a new indicator that can add to the sustainability debate. It adds to the ecological footprint and the embodied energy concept by taking water as a central viewpoint as alternative to land or energy. It adds to earlier indicators of water use by taking the consumer's perspective on water use instead of the producer's perspective. In order to reduce the pressure on renewable water resources, the Indian government is considering the concept of river interlinking as the solution for water scarcity in the drier regions. This concept means that water abundant regions will provide water to water scarce regions through the connection of rivers. The water scarcity from the perspective of consumption is the highest in the states of Rajasthan, Punjab, Uttar Pradesh, Tamil Nadu and Haryana. This means that the water resources of these states are closest to be exhausted in case of food self-sufficiency. Because most of the states are also net exporters of virtual water, the water scarcity from production perspective is even higher in these states. Looking at the river interlinking project from the perspective of the virtual water flows as calculated in this study, it can be seen that the proposed water transfer from East to North India has a direction exactly opposite to the direction of the virtual water flow as a result of interstate trade. The river interlinking project mainly reduces local water scarcity, while water scarcity needs to be reduced significantly at a national level in order to remain food self-sufficient as a nation. The only long term option for reducing the national water scarcity and remaining food self-sufficient is to increase the water productivity in India. The largest opportunity for this increase lies in East India, where there is an abundance of water and a large increase in water productivity seems possible.
w w w . a j e r . o r g
Page 171
• The average consumption volume per capita, generally related to gross income per state,
• The consumption pattern of the inhabitants of the state, • Climate, in particular evaporative demand
• Agricultural practice
The virtual water flow between two nations is the volume of water that is being transferred in virtual form from one place to another as a result of product trade. The virtual water flows between nations related to trade in rice products are calculated by multiplying commodity trade flows (ton/year) by their associated water footprint (m3/t) in the exporting country. Indian Leather Industry is 6th in the world(CLE).Tanneries consume a huge amount of water. The processes involved in tanneries which consume water are soaking, liming, deliming, pickling, chrome tanning, vegetable tanning, mycrobing, stripping, bleaching, neutralisation, dyeing, liquoring, steam generation and washing.
Evidence of rawhide use as human vestments comes from100,000 B.C., allowing the human to spread to cold regions, in which processes to obtain good quality hides moved from a simple smog process to the currently most commonly used chromium-based tanning. According to FAO (2003), the world bovine hides production was 6.5 million tons in 2011, denoting the socio economic importance of hide production and the increasing environmental related concerns. The potential environmental impacts of tanning processes are significant, because this industry produces toxic gases (for instance, hydrogen sulfide and solvent vapors), putrefied solid waste, and copious volumes of wastewater containing high concentrations of inorganic salts, heavy metals, and organic substances in solution or suspension (UNEP-IE, 1996).End-of-pipe actions, as frequently used during the last century, are no longer enough to guarantee decreased load on the environment. In this sense, the International Union of Leather Technologies and Chemists Societies (IULTCS, 2008) recommends the following cleaner strategies for tannery operations: reduce salt use in pickling floats; degreasing operations; wet-white pre-tanning; direct recycling of chromium tanning floats; recovery after precipitation; high exhaustion tanning process; and chromium-free tanning. A wide range of technological routes exists for waste minimization and treatment of tannery final liquid effluents. Due to their significant socio-environmental impacts, cleaner production strategies in tannery industries are mainly focusing on liming and pickling/tanning processes; some studies propose new tanning methods, while others suggest technological processes of recycling chromium after the tanning stage. New process for unhairing/liming, which demands less water and chemicals compared to conventional processes also have been proposed, as well as general recommendations related to specific cases . All of them aim at producing high quality products while reducing the demand for resources, reducing costs, and generating lower environmental impacts.
However, most of these studies focus mainly on the local or direct impacts, such as the reduction of chemicals and water usage, and the toxic content of effluents, disregarding supply-chain aspects that can be revealed only from a global scale perspective. Direct indicators at the local scale are recognized as important aspects for decision making focusing on economic benefits and cleaner production strategies, because they drive direct reduction of materials and energy inputs. However, these indicators are not able to address sustainability issues of production systems. Using supercritical fluids for tanning processes saves large amounts of water and chromium; however, new equipment (i.e., steel and other materials) is demanded as well as increased use of electric energy. Obviously, electricity and steel do not have the same socio-environmental toxicological impact as high chromium wastewater, but their use stresses the environment in such a way by demanding environmental investments in providing material and energy resources at larger scales than the tannery process scale.
In India, the history of making bricks is almost 5000 years old. The Indus valley civilization was discovered by the archaeologists with the help of old bricks found during the construction of railway track from Karachi to Punjab in mid-19th century. Fired clay bricks being one of the most important building materials, India is the second largest producer of bricks, accounting for over 10% of the global production. It is estimated that India has more than 100,000 brick kilns producing about 250 billion bricks annually, employing about 15 million workers and consuming about 35 million tonnes of coal annually .The brick industry is growing as the demand for bricks is increasing in the towns and villages due to the fast economic growth, urbanization and prosperity. It is alarming to note that 300 mm depth of fertile top soil in India will be consumed for burnt clay brick production in about 60 years. Usually, brick kilns are situated in rural and/or periphery of urban areas in
w w w . a j e r . o r g
Page 172
used as fuel for internal combustion of green brick in kiln. For brick making, various naturally occurring material are used as raw materials including soil, coal and coal powder and waste from industries such as bagasse, rice husk and foundry sand are used. While clays vary considerably in physical properties, colour, hardness, and mineralogical content; they do, have a property in common, namely the ability to be crushed and mixed with water to form a plastic material which can be molded into various shapes, and fired to a high temperature, during which process it attains a hard, weather resistant characteristic. The raw materials are mixed in the ratio, soil: Bagasse: Coal Powder (3680 kg: 140 kg: 120 kg) using water about 600 to 800 litre into a thick paste, mostly manually.
The present demand is estimated as 120 billion bricks per year. There are two categories of issues in brick making industry: environmental and social. The choice of technology for firing of bricks depends generally on factors such as scale of production, soil and fuel availability, availability of skilled manpower and business considerations such as profitability and availability of finance. The popular brick making technologies are clamps, movable chimney and more recently fixed chimney kilns. The small scale brick entrepreneurs are confronted with environmental regulation and face numerous challenges for survival, considering the situation that there are very limited options for them to adopt for their brick business. The workers in the brick industry are subject to extreme working conditions and poor remuneration. The brick moulder families are contracted through middlemen and usually belong to poor districts of Uttar Pradesh, Bihar, Chattisgarh and Orissa. Both male and female member of the families are engaged in brick making. Children are not employed as such, but usually they accompany their parents to the work place. There is seldom any arrangement for toilets or drinking water facilities. The work force is paid on basis of quantum of work and against completion of certain tasks. Operations are mostly manual and under present conditions 100 to 150 days of employment is available.
III.
METHODOLOGY
The water intensity has been used as a measure of water footprint analysis. Water intensity is calculated for leather industry and brick manufacturing industry in India. Indian Leather Industry is 6th in the world (CLE). The organized tanning sector has gained significance in the industrial process and grown in Tamil Nadu, West Bengal and Uttar Pradesh. Data on water consumption in different sections of a tannery has been collected from CLRI. Data on animal water footprint has been collected from the report prepared by Mekonnen &Hoekstra (2010) for UNESCO-IHE. Primary survey was done in case of brick field in West Bengal, India.
IV.
RESULTS AND DISCUSSIONS
Leather Tanning Industry
Water intensity calculation is done to calculate water footprint of leather industry. According to CLRI data 46575, pieces of raw hide are used each day (table 2), each producing around 8sq.feet of finished leather. Thus,
VIRTUAL WATER USED
Productivity of water for cattles (σ):- OUTPUT/INPUT=0.00088 (sq. feet/lt/day) Thus, Intensity of water for cattles:
1/σ =1136.36 ( lt/sq.feet/day)……(1)
WATER CONSUMPTION IN LEATHER FACTORIES
Total water consumption in each tannery =770000 lts/day (table 3)
Thus, Water productivity (σ) =OUTPUT/INPUT (units) =0.74 sq. feet/day/lt. Therefore, Water intensity=1/σ =1.35 lts/sq. feet/day... (2)
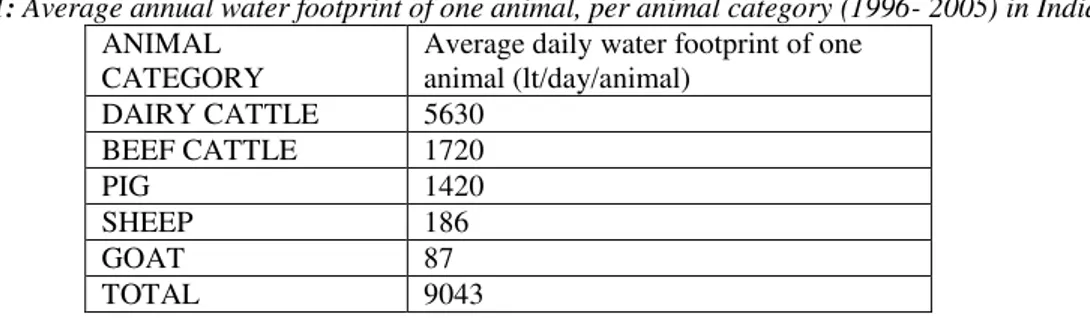
Table 1: Average annual water footprint of one animal, per animal category (1996- 2005) in India ANIMAL
CATEGORY
Average daily water footprint of one animal (lt/day/animal)
DAIRY CATTLE 5630 BEEF CATTLE 1720
PIG 1420
SHEEP 186
GOAT 87
TOTAL 9043
w w w . a j e r . o r g
Page 173
Table 2: Number of animals slaughtered annually in IndiaYEAR TOTAL SLAUGHTER 1996 8800000
1997 10999000 1998 13500000 1999 14500000 2000 15250000 2001 16500000 2002 17750000 2003 20000000 2004 21500000 2005 21700000 AVERAGE 16049900
SOURCE: United States Department of Agriculture
Table 3: Water consumption in different sections of the tannery SECTION AVG. WATER
USED(lts/DAY)
SECTION AVG. WATER USED(lts/DAY)
SOAKING I 35000 MYCROBING 8000
SOAKING II & III 15000 STRIPPING 30000 LIMING I & II 25000 BLEACHING 25000 DELIMING 25000 NEUTRALISATION 25000
PICKLING 20000 DYEING 30000
CHROME TANNING 20000 LIQUORING 30000 VEGETABLE TANNING 12000 STEAM GENERATION 85000 WASHING 385000 Source: Central Leather Research Institute
Table 4 : All India Manufacturing Capacity of Finished Leather during (1996-2008) Product Quantity/year ( in sq. Feet) Quantity/day ( in sq. Feet) Buff Leather 140,084,671 383793.62
Cow Leather 68,523,218 188734.84 TOTAL 208607889 572528.46
Source: CLE
TOTAL WATER INTENSITY IN LEATHER INDUSTRY:- We get by adding equation (1) and (2):-
=1137.71 lts./sq. feet/day
More the water intensity more is the depletion of fresh water.
Brick Manufacturing Industries
Over the past 30 years India has been 3rd ranking in brick production after China and Brazil. (World Bank.2001).Bricks are small units of building material, often made from fired clay and secured with mortar, a bonding agent comprising of cement, sand, and water. The processes included in brick manufacturing are- 1) Grinding, sizing, and combining raw materials.
2) Extrusion
3) Chamfering the brick 4) Drying
5) Firing
6) Setting and packaging
w w w . a j e r . o r g
Page 174
Extensive energy usageIndian brick industry is unorganized with small scale production units, the numbers in the range of more than 100,000 clusters spread across rural and peri-urban areas in the country. With an average consumption of 18 tonnes of coal per lakh bricks, it consumes about 24 million tones of coal per year which is about 8% of the total coal consumption of the country. In addition it also consumes several million tons of biomass fuels. The share of energy in total cost of brick production is 35%-50%.
Inefficient resource utilisation
The environmental problems in the brick industry have been exacerbated by cheap access to resources such as soil, water, coal, biomass and labour. This results in irreversible environmental damage in terms of depletion of top soil, water and coal.
Soil
Soil being the raw material for brick making, is being consumed in huge amount by the brick industry. The kiln itself occupies considerable land which is subjected to high temperature making it unfit for agriculture in future (after the site is abandoned). The fast depletion of arable land thus caused due to brick making is a matter of grave concern to India. Addressing this issue, utilization of fly ash by all kilns within 100 km radius from thermal power plants has been made mandatory.
Water
Brick industry also consumes considerable amount of water. Most of the brick kilns are therefore sited along the Gangetic belt. However water utilization is generally regulated by local Govt. authorities. In advent of water scarcity, water intensive industries are temporarily closed down by the authorities to preserve water for drinking and other necessary usages.
Coal
The wasteful utilisation of coal by the brick sector accelerates the depletion of this valuable national resource. High Air Pollution With unabated increase in the price of coal and higher costs of transportation, the brick industry is not left with much choice but to opt for poor grade coal. The poor quality of coal (low calorific value) increases the consumption rate. This factor added with the inefficient combustion technologies cause high level of air pollution. While the emission standard for Suspended Particulate Matter (SPM) is 750 mg/Nm3 to 1000 mg/Nm3, the actual emissions from existing technologies range from 600 mg/Nm3 to 1770 mg/Nm3. The high level of suspended particulate matter thrown out by the kilns causes damage to property and crops. High usage of coal as a fuel also leads to considerable amount of Greenhouse Gas (GHG ) emissions. Considering the average specific energy consumption is 4.5x10⁻⁶Tj/ brick, multiplying by 18, 44,000 bricks per unit, the CO2 emissions contributed by 100,000 brick kilns are 78 tonne/annum.
Water Consumption In Brickfield
Primary survey was done in a brick field in West Bengal. The brick field manufacturing season is usually from December to March in the selected region. The production capacity of the brick field is 12,000-15,000 bricks per day. Water used is fresh water from nearby ponds or ground water is extracted by pumps. Daily average use of water used is around 5000 lts/day.Total water used=5000 lts/day. Average number of bricks made per day=13500
Water Productivity (σ) =2.7(units/lts/day) Water Intensity=1/σ =0.37(lts./unit/day)
V.
CONCLUSION
Understanding the water footprint (WF) of a nation is highly relevant for developing well informed national policy. Conventional national water use accounts are restricted to statistics on water withdrawals within their own .National WF accounts extend these statistics by including data on rainwater use and volumes of water use for waste assimilation and by adding data on water use in other countries for producing imported products, as well as data on water use within the country for making export products .The WF is a measure of
w w w . a j e r . o r g
Page 175
main challenge ahead is to develop tools that enable the management of pressure indicators with the complexity of water, providing relevant information in real time and directing the corporate strategy towards a more sustainable business. Indian industrial water footprint lags far behind in sustainable use of water. Initiatives both by the government and individuals have to be taken to decrease the WF in industries in India.
ACKNOWLEDGMENT
The authors are grateful to the host institute, Madras School of Economics.
REFERENCES
[1]. Y. Hoekstra and A. K. Chapagain, (2008),Globalization of Water: Sharing the Planet‘s Freshwater Resources; UK: Blackwell Publishing, Oxford, ch. 1-2.
[2]. Kanagaraj, J., Chandra Babu, N.K., Mandal, A.B., (2008), Recovery and reuse of chromium from tanning waste water aiming towards zero discharge of pollution. J. Clean. Prod. 16, 1807–1813.
[3]. Li, S., Li, J., Yi, J., Shan, Z., (2010), Cleaner beam house processes trial on cattle sofa leather.J. Clean. Prod. 18, 471–477. [4]. Manfred, R., Eckhard, W., Björn, J., Helmut, G., (2012), Free of water tanning using CO2 asprocess additive — an overview on
the process development. J. Supercrit. Fluids 66,291–296.
[5]. Mekonnen, M.M. and Hoekstra, A.Y. (2010), The green, blue and grey water footprint of farm animals and animal products, Value of Water Research Report Series No.48, UNESCO-IHE.Volume 2: Appendices .
[6]. RaghavaRao, J., Chandrababu, N.K., Muralidharan, C., Nair, B.U., Rao, P.G., Ramasami, T.,(2003),Recouping the wastewater: a way forward for cleaner leather processing.J. Clean. Prod. 11, 591–599.
[7]. Rivela, B., Moreira, M.T., Bornhardt, C., Méndez, R., Feijoo, G., (2004), Life cycle assessmentas a tool for the environmental improvement of the tannery industry in developingcountries. Environ. Sci. Technol. 38, 1901–1909.
[8]. Sundar, V.J., Rao, J.R.,Muralidharan, C., (2002), Cleaner chrome tanning — emerging options.J. Clean. Prod. 10, 69–74. [9]. Schnitzer, H., Ulgiati, S., (2007), Less bad is not good enough: approaching zero emissions techniques and systems. J. Clean.