HESSD
10, 9889–9914, 2013European public water withdrawals
and consumption
I. Vandecasteele et al.
Title Page
Abstract Introduction
Conclusions References
Tables Figures
◭ ◮
◭ ◮
Back Close
Full Screen / Esc
Printer-friendly Version Interactive Discussion
Discussion
P
a
per
|
D
iscussion
P
a
per
|
Discussion
P
a
per
|
Discuss
ion
P
a
per
|
Hydrol. Earth Syst. Sci. Discuss., 10, 9889–9914, 2013 www.hydrol-earth-syst-sci-discuss.net/10/9889/2013/ doi:10.5194/hessd-10-9889-2013
© Author(s) 2013. CC Attribution 3.0 License.
Geoscientiic Geoscientiic
Geoscientiic Geoscientiic
Hydrology and Earth System
Sciences
Open Access
Discussions
This discussion paper is/has been under review for the journal Hydrology and Earth System Sciences (HESS). Please refer to the corresponding final paper in HESS if available.
Mapping current and future European
public water withdrawals and
consumption
I. Vandecasteele1,2, A. Bianchi1, F. Batista e Silva1, C. Lavalle1, and O. Batelaan2,3
1
Institute for Environment and Sustainability, Joint Research Center of the European Commission, Via Enrico Fermi 2749, 21027 Ispra (VA), Italy
2
Dept. of Hydrology and Hydraulic Engineering, Vrije Universiteit Brussel, Pleinlaan 2, 1050 Brussels, Belgium
3
School of the Environment, Flinders University, GP.O. Box 2100, Adelaide, SA 5001, Australia
Received: 28 February 2013 – Accepted: 7 July 2013 – Published: 29 July 2013
Correspondence to: I. Vandecasteele ([email protected])
HESSD
10, 9889–9914, 2013European public water withdrawals
and consumption
I. Vandecasteele et al.
Title Page
Abstract Introduction
Conclusions References
Tables Figures
◭ ◮
◭ ◮
Back Close
Full Screen / Esc
Printer-friendly Version Interactive Discussion
Discussion
P
a
per
|
D
iscussion
P
a
per
|
Discussion
P
a
per
|
Discuss
ion
P
a
per
|
Abstract
In Europe, public water withdrawals make up on average 30 %, and in some cases up to 60 % of total water withdrawals. These withdrawals are becoming increasingly impor-tant with growing population density; hence there is a need to understand the spatial and temporal trends involved. Pan-European public/municipal water withdrawals and
5
consumption were mapped for 2006 and forecasted for 2030. Population and tourism density were assumed to be the main driving factors for withdrawals. Country-level statistics on public water withdrawals were disaggregated to a combined population and tourism density map (the “user” density map) computed for 2006. In order to fore-cast the map to 2030 we assumed the water withdrawals per user to remain constant
10
in time, so that the future withdrawals reflected the projected population and tourism trends. The methodology was validated using actual regional withdrawal statistics from France for 2006. The Total Absolute Error (TAE) calculated was proven to be reduced by taking into account the tourism density in addition to the population density. Our results show that although there are large variations from region to region, in general
15
public water withdrawals will increase significantly over the period 2006 to 2030. The European average increase is 16 %, with a maximal increase of 53 % in Ireland.
1 Introduction
With increasing demographic pressure on available physical resources, there is a grow-ing need to evaluate and monitor their usage. Public water withdrawals are those made
20
by the municipal water distribution system, and are used mainly for household pur-poses, although usually they are also used in the commercial and even industrial sec-tors. In Europe, they account for, on average, 30 % of total water withdrawals (EU-ROSTAT, 2012). In northern Europe they can account for up to 60 % of withdrawals. Understanding the spatial and temporal patterns in water withdrawals for public use is
HESSD
10, 9889–9914, 2013European public water withdrawals
and consumption
I. Vandecasteele et al.
Title Page
Abstract Introduction
Conclusions References
Tables Figures
◭ ◮
◭ ◮
Back Close
Full Screen / Esc
Printer-friendly Version Interactive Discussion
Discussion
P
a
per
|
D
iscussion
P
a
per
|
Discussion
P
a
per
|
Discuss
ion
P
a
per
|
therefore an important step towards improving the efficiency of use of water resources and reducing water scarcity.
Globally, domestic demand for water has been extensively studied and there have been numerous attempts to describe and model them (Arbues et al., 2003; Kostas and Chrysostomos, 2006; Wong et al., 2010; Worthington et al., 2006), although mostly
5
at a local or regional level, at which scale it is possible to take into account even fac-tors such as household income and size. There are also several existing models which describe water withdrawals for the public sector at a larger scale. The Global Water Scarcity Information Service (GLOWASIS), (Wada et al., 2011a, b), and the Water – Global Analysis and Prognosis (WaterGAP) (Alcamo et al., 2003) model describe the
10
global monthly water demand for the year 2000 at 0.5◦ spatial resolution for the do-mestic sector. The Pan-European Atlas of Water Abstractions, Losses and Returns (Wriedt et al., 2008) disaggregated EUROSTAT public water withdrawal statistics to regional level (NUTS31) using the total population. We aim to improve on previous models by providing higher resolution and more up-to date public withdrawal and
con-15
sumption maps for Europe. Moreover, the objective is to take into account the impact of additional water withdrawals for the tourism industry, and provide a robust method-ology to estimate future public water withdrawals. We propose a methodmethod-ology based on a strong linkage with land use modeling, which allows us to map future water use trends up to 2030, which is the time horizon up to which the land use model can reliably
20
forecast land use. We use 2006 as the reference year for our mapping and land use model as refined land use maps are available for this year. Additionally, available water withdrawal statistics for 2006 are more complete and consistent than for more recent years.
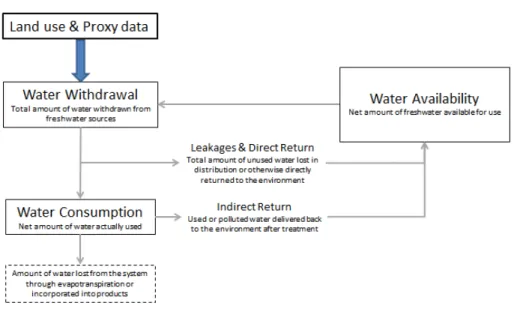
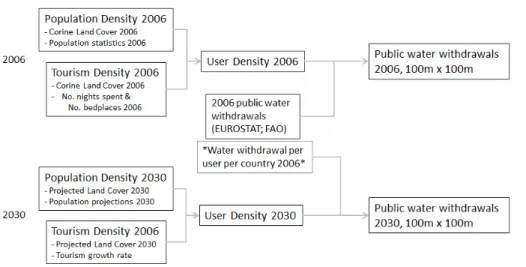
Figure 1 presents an overview of the terminology and approach used to assess
25
sectorial water flows (definitions are adapted from the3rd UN World Water
Develop-1
“NUTS (Nomenclature of Territorial Units for Statistics) is the European Union’s official
HESSD
10, 9889–9914, 2013European public water withdrawals
and consumption
I. Vandecasteele et al.
Title Page
Abstract Introduction
Conclusions References
Tables Figures
◭ ◮
◭ ◮
Back Close
Full Screen / Esc
Printer-friendly Version Interactive Discussion
Discussion
P
a
per
|
D
iscussion
P
a
per
|
Discussion
P
a
per
|
Discuss
ion
P
a
per
|
ment Report(2009). Water withdrawal is the gross amount of water extracted from any source in the natural environment for human purposes. Water use is the amount of wa-ter that is actually processed in a given sector. Wawa-ter consumption refers to the part of the processed water that is evaporated, transpired, incorporated into products or crops, consumed by humans or livestock, so heavily polluted that it is no longer suitable for
5
use, or otherwise removed from the immediate water environment. From the total water withdrawal, a part is lost due to leakages during transportation/distribution processes, and thus returned to the natural environment. In addition, a part of the total used water can potentially be returned to the stock of available water. This share depends on the sector and on the installed capacity to treat water.
10
In this paper we discuss the methodology used in detail, and present the resulting public water withdrawal and consumption maps for 2006, and compare them to 2030. The methodology is also validated against actual regional statistics, and the added value of the inclusion of tourism as a driving factor is assessed.
Data availability
15
The OECD/EUROSTAT Joint Questionnaire on Inland Water provides country-level statistics on annual freshwater abstraction by source and sector and water use by sup-ply category and user (Nagy et al., 2007). The questionnaire covers the EU27 countries plus Iceland, Norway, Switzerland, Croatia, the Former Yugoslav Republic of Macedo-nia, Turkey, Bosnia and Herzegovina, and Serbia (although for these countries the
20
datasets are not always complete). For the reference year 2006, we used the average sectorial water withdrawals for the period 2005–2007 from EUROSTAT, which was sup-plemented by the 2003–2007 average from FAO – AQUASTAT (2012) in case data was missing or inconsistent. Where there were still missing values the respective sectorial European average per capita was used. Figure 2 gives an overview of the public water
25
HESSD
10, 9889–9914, 2013European public water withdrawals
and consumption
I. Vandecasteele et al.
Title Page
Abstract Introduction
Conclusions References
Tables Figures
◭ ◮
◭ ◮
Back Close
Full Screen / Esc
Printer-friendly Version Interactive Discussion
Discussion
P
a
per
|
D
iscussion
P
a
per
|
Discussion
P
a
per
|
Discuss
ion
P
a
per
|
The data on “public water supply” as provided by the questionnaire is defined as: “. . . (the) water supplied by economic units engaged in collection, purification and dis-tribution of water. . . Experience from France: This service includes water for domestic use and water used at offices. It also includes small factories, municipal use . . . , and private garden watering.”(Nagy et al., 2007). Statistics given on the public supply of
wa-5
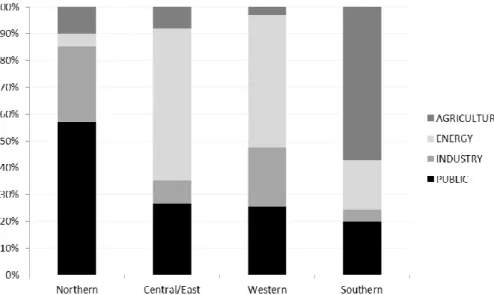
ter to the different sectors (EUROSTAT) shows that although, on average, some 79 % of public water is used for domestic purposes, there is also 17 % used for industrial purposes, and 4 % for agriculture.
Figure 3 shows the relative proportions of the public water withdrawals compared to withdrawals for the other major water-using sectors. Notable is that public water
10
withdrawals make up more than 60 % of the total in northern countries such as the UK, Luxemburg, and Denmark, while agricultural withdrawals make up the majority of the total withdrawal in the Mediterranean countries Portugal, Greece, and Spain. Industrial, and even more so, energy, withdrawals (used as cooling water in thermal power plants) are especially important in the eastern European countries.
15
In order to supplement the country-level data provided by Eurostat, we collected regional sectorial water withdrawal statistics (at NUTS2, NUTS3 or basin-level) from various sources, including each country’s National Statistical Institute and environmen-tal agencies. As the sectorial regional dataset for all EU27 countries is incomplete, further analysis has been carried out on the country-level data. Where available, the
20
country-level statistics were verified with the regional totals. Since detailed and verified NUTS3 level data was available for France for 2006 (SOeS, 2012), we confirm our pub-lic water withdrawal map for France, produced by disaggregation from the country-level statistics, with actual regional statistics.
2 Methodology
25
HESSD
10, 9889–9914, 2013European public water withdrawals
and consumption
I. Vandecasteele et al.
Title Page
Abstract Introduction
Conclusions References
Tables Figures
◭ ◮
◭ ◮
Back Close
Full Screen / Esc
Printer-friendly Version Interactive Discussion
Discussion
P
a
per
|
D
iscussion
P
a
per
|
Discussion
P
a
per
|
Discuss
ion
P
a
per
|
the use is assumed to be mostly domestic, so covering the water needs of the resident population within a given area at any time. Since tourism has a large impact in some of the most water scarce areas, we have taken the influence of additional tourist presence into account.
2.1 Land use proxy approach
5
Our approach links land use data to the public water withdrawals. In order to do this for the base year maps we used the 2006 refined version of the CORINE Land Cover (CLC_r) (Batista e Silva et al., 2012). The land use needed to map the following years, up to 2030, was modeled using the Land Use Modelling Platform (LUMP). The land use/cover model EUClueScanner (EUCS100), developed at the JRC Ispra is the
10
core component of this platform which incorporates several data sources and models (Lavalle et al., 2011). Future land use claims are driven mainly by the CAPRI model (Common Agricultural Policy Regionalized Impact modelling System), Eurostat data (EUROPOP2008) and Corine Land Cover trends. As yet, the model is only calibrated for the EU27 member states. The close linkage with the relevant land use classes
al-15
lows us to both spatially disaggregate the withdrawals at high resolution (100 m), and to forecast withdrawals based on changing urban land use patterns as simulated by EUClueScanner. As resident and touristic water use was assumed to be present in ur-ban areas, both were assigned to the relevant urur-ban land use classes. We additionally assign touristic water use to the land use class “sport and leisure facilities”, so taking
20
into account extra water used to maintain these infrastructures. Proxy data is used to disaggregate to pixel level and to refine the approach.
An initial analysis of possible proxy data influencing public withdrawals at both coun-try and regional level gives highR2correlations for total population (0.92) and number of nights spent by tourists (0.82). Hence, these variables are selected as being most
25
popula-HESSD
10, 9889–9914, 2013European public water withdrawals
and consumption
I. Vandecasteele et al.
Title Page
Abstract Introduction
Conclusions References
Tables Figures
◭ ◮
◭ ◮
Back Close
Full Screen / Esc
Printer-friendly Version Interactive Discussion
Discussion
P
a
per
|
D
iscussion
P
a
per
|
Discussion
P
a
per
|
Discuss
ion
P
a
per
|
tion and tourist density. Our first step is to compute both the population and tourism densities at the highest resolution possible.
We used a detailed European population density map for 2006 (Batista e Silva et al., 2013), which was produced by disaggregating resident population counts at commune level originating from EUROSTAT to a grid of 100 m×100 m cells. The disaggregation
5
approach consisted of redistributing the population totals of each commune among the urban fabric cells as reported in a refined version of the CORINE Land Cover (CLC_r) (Batista e Silva et al., 2012). In addition, the redistribution was weighted proportionally to the average imperviousness of each urban fabric class, which was used as a proxy for housing density and, therefore, for population density. The source for these data
10
was the European Environment Agency’s Soil Sealing Layer 20062.
Tourist density maps are created using the number of nights spent by non-residents at NUTS2 level (EUROSTAT, corrected with ESPON data). This data is further disag-gregated to NUTS3 level using the number of bedplaces (EUROSTAT). The monthly distribution of tourism is calculated using the country-level percentage of nights spent
15
per month (EUROSTAT). For both cases, where data is missing national statistics or regional averages are used, always taking the closest available year to 2006. The to-tal number of tourists per month (calculated as the toto-tal number of nights spent/365 days) at NUTS3 level for each country is disaggregated to the CLC_r refined CORINE classes 111 and 112 (urban fabric), and 142 (sport and leisure facilities) to create
20
a map of tourism density at pixel level (100 m). To correct for outbound tourism, the number of nights spent abroad by residents per quarter year is also calculated and subtracted from the population density maps. Tourists have a higher water use than residents, which can be explained by the additional water needed to maintain the ad-ditional recreational facilities required by tourists, and the higher consumption of water
25
by holiday-makers. The tourist density maps are given a greater weight, by multiplying by a factor of 300/160 (derived from Gössling et al., 2012) when actually assigning
2
HESSD
10, 9889–9914, 2013European public water withdrawals
and consumption
I. Vandecasteele et al.
Title Page
Abstract Introduction
Conclusions References
Tables Figures
◭ ◮
◭ ◮
Back Close
Full Screen / Esc
Printer-friendly Version Interactive Discussion
Discussion
P
a
per
|
D
iscussion
P
a
per
|
Discussion
P
a
per
|
Discuss
ion
P
a
per
|
the water withdrawals to the users (residents+tourists), so assuming that tourists use almost twice the amount of water as residents do.
The monthly maps of weighted number of users of public water per pixel, or “user density”, are calculated as:
User density=(P−To)+300/160·(Ti) (1)
5
Where P is the population density (annual map); To is the number of nights spent
abroad by residents (quarterly maps); andTi is the number of nights spent by tourists
(monthly maps). Finally, the country-level total public water use is disaggregated ac-cording to the user density maps.
PWWi=PWWc· User densityi
X
I
User densityi (2)
10
Where PWW is public water withdrawal;i is the pixel indicator per country; “c” is the country.
2.2 Forecasting to 2030
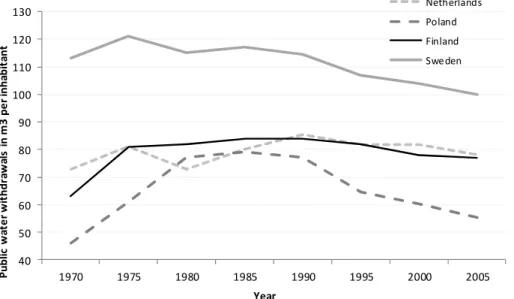
The public water withdrawals are forecasted up to 2030. We combine the land use map, modeled up to 2030, with projected population statistics, and take country-specific
15
tourism growth rates into account. The actual water withdrawal per capita per country is kept constant. Figure 4 shows the trends in public water withdrawals for the period 1970 to 2005 for several countries where consistent datasets were available for all years (EUROSTAT). The evolution of public water withdrawals differs greatly depending on the country, and no clear general trend could be identified. We retain therefore the per
20
capita estimate from 2006, and let the future withdrawal trends be directly determined by the population and tourism projections. Most countries actually show a reduction of per capita public withdrawals over the period from 1990 to 2005, which can be attributed to an improved efficiency of water use, probably due to a combination of information dissemination, water pricing, and technological improvements.
HESSD
10, 9889–9914, 2013European public water withdrawals
and consumption
I. Vandecasteele et al.
Title Page
Abstract Introduction
Conclusions References
Tables Figures
◭ ◮
◭ ◮
Back Close
Full Screen / Esc
Printer-friendly Version Interactive Discussion
Discussion
P
a
per
|
D
iscussion
P
a
per
|
Discussion
P
a
per
|
Discuss
ion
P
a
per
|
Figure 5 summarizes the methodology applied to map the withdrawals for both 2006 and 2030. The projected land use for 2030 is modeled using EUClueScanner. Fore-casted population density maps are created using population projections from EURO-STAT (EUROPOP), and the tourism density maps are re-calculated according to the tourism growth forecasts (at country level) from the Europe vision 2020 report (WTO,
5
2000). We assume the tourism growth rate for the period 2006–2030 to be equivalent to that predicted for 2010–2020 in the report. Since insufficient data is available on both the regional and monthly distribution of tourism, the 2006 patterns are used. The public water withdrawal per capita is also kept constant, using the 2006 statistics. Therefore the total public water withdrawals for 2030 directly reflect the projected population and
10
tourism densities.
3 Results
3.1 Confirmation of methodology
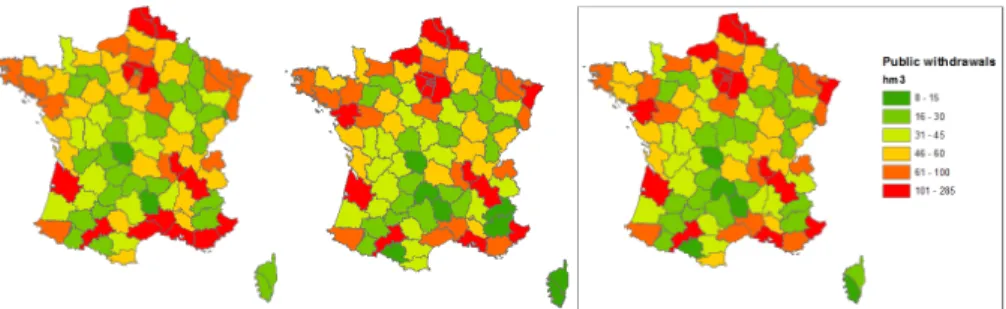
In order to confirm our methodology we use detailed and verified NUTS3 level data for France, which is available from the Service de l’observation et des statistiques (SOeS,
15
2007). We compared the actual 2006 total public water withdrawals to those given by summing the estimated withdrawals per NUTS3 region. In order to assess the in-fluence of taking tourism into account in our model, we re-calculate the public water withdrawal map based on a disaggregation of the country total water withdrawals di-rectly to the population density, and also compare the NUTS3 totals derived from this
20
map to the actual statistics. Figure 6 compares the regional estimates derived by these two methodologies to the actual statistics.
The Total Absolute Error (TAE) is calculated for both cases as:
TAE=X
I
HESSD
10, 9889–9914, 2013European public water withdrawals
and consumption
I. Vandecasteele et al.
Title Page
Abstract Introduction
Conclusions References
Tables Figures
◭ ◮
◭ ◮
Back Close
Full Screen / Esc
Printer-friendly Version Interactive Discussion
Discussion
P
a
per
|
D
iscussion
P
a
per
|
Discussion
P
a
per
|
Discuss
ion
P
a
per
|
The resulting error is 26.56, or 13.3 % including the tourism density, and a TAE of 27.42, or 13.7 % using only the population density maps. This shows that, although population density is the main factor contributing to the spatial disaggregation of the statistics, taking the tourism density into account does, in fact, improve the end result.
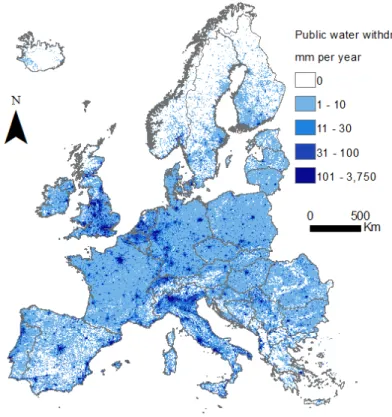
3.2 Public water withdrawals in 2006
5
Public water withdrawals are mapped at 100 m resolution at a Pan-European scale for the period 2006 to 2030. Figure 7 shows the withdrawal map for 2006, which has been aggregated to 5 km resolution for improved visualization. Within each country, the most densely populated areas have the highest water withdrawals, with the great-est withdrawals therefore being in major cities like London, Paris, Madrid, and Berlin.
10
The Benelux area and northern Italy also stand out. The influence of tourism water withdrawals is seen especially in the high withdrawals along the coastal Mediterranean towns in Spain, Italy, and Croatia.
Tourism density can vary significantly depending on the region and the season. Fig-ure 8 shows the tourism density maps for January and August of 2006 calculated for
15
Italy. These months were selected to represent the peak winter and summer tourism. The Alps and the major towns retain high tourism densities for both seasons. In gen-eral, tourism is much greater in summer, with more tourists present in most regions, and an especially high concentration along the coastal towns. Summer tourism is es-pecially high in the Veneto region of Italy, and the Croatian coast.
20
3.3 Forecasted public water withdrawals for 2030
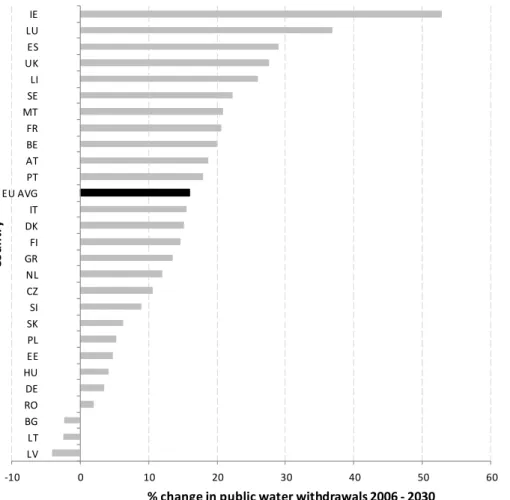
Figure 9 shows the percentage changes in public water withdrawals for the EU27 coun-tries as compared to the EU27 average change. As yet, non-EU27 councoun-tries are not modeled by EUClueScanner. Since we did not have forecasted land use for those coun-tries, we could not compute the 2030 water withdrawals. The predicted trend in water
HESSD
10, 9889–9914, 2013European public water withdrawals
and consumption
I. Vandecasteele et al.
Title Page
Abstract Introduction
Conclusions References
Tables Figures
◭ ◮
◭ ◮
Back Close
Full Screen / Esc
Printer-friendly Version Interactive Discussion
Discussion
P
a
per
|
D
iscussion
P
a
per
|
Discussion
P
a
per
|
Discuss
ion
P
a
per
|
use is dictated first and foremost by the projected trends in population growth, with some slight influence by the tourism growth rate.
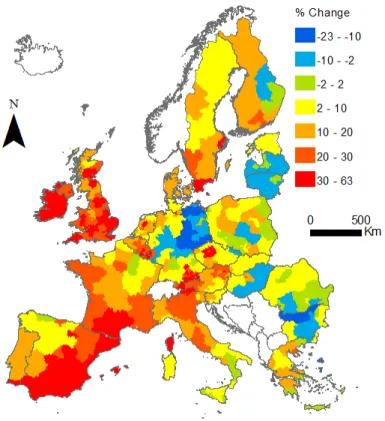
Figure 10 shows the evolution in public water withdrawals for each NUTS2 region of the EU27 countries, calculated over the period 2006 to 2030. The difference in water withdrawals for 2030 to those made in 2006 varies from a decrease of up to 23 % in
5
central Germany and several regions in Poland, Hungary, Romania, Bulgaria, Latvia, Lithuania and Sweden, to an increase of up to 63 % in southern Spain and France, northern and central Italy, the UK, and some regions of central and northern Europe.
Figure 11 compares the water withdrawal maps for 2006 and 2030 for Warsaw, Poland at the original resolution of 100 m pixel size. Total public water withdrawals
10
for the administrative region of Warsaw increase from 79.73 hm3 in 2006 to 81.65 hm3 in 2030, an increase of about 2.4 %. This increase is directly related to the growth in population and tourism. The related, significant increase in urban area is clearly visible when comparing the maps.
The statistics used so far concern only total water withdrawals. For each land use and
15
region, there will be a fixed water demand, a portion of water permanently consumed, and a portion returned to the environment. For most sectors, there is a large return of water to the environment, and very little consumed. For the public sector, consumption is estimated at between 10 and 20 % of abstractions (UN WWDR, 2009).
4 Discussion and conclusion
20
European public water withdrawals are mapped for the years 2006 (Fig. 7) and 2030 based on available land use, population and tourism data for 2006 and projections thereof to 2030. The monthly variation in public water withdrawals is also taken into account – this variation is especially noticeable in terms of tourism densities, which are significantly higher in the summer, especially in the coastal regions (Fig. 8).
Pub-25
HESSD
10, 9889–9914, 2013European public water withdrawals
and consumption
I. Vandecasteele et al.
Title Page
Abstract Introduction
Conclusions References
Tables Figures
◭ ◮
◭ ◮
Back Close
Full Screen / Esc
Printer-friendly Version Interactive Discussion
Discussion
P
a
per
|
D
iscussion
P
a
per
|
Discussion
P
a
per
|
Discuss
ion
P
a
per
|
most countries there will be considerable increases. The European average increase in withdrawals for the period 2006 to 2030 is 16 % (Fig. 9). Although most of central and Eastern Europe show reasonably stable withdrawals, with even some projected decreases, water withdrawals in southern Spain and France, northern Italy, and the UK are predicted to increase considerably (Fig. 10). These are the regions with the
5
highest combined relative population and tourism growth, where increasing pressure is predicted on the available resources. In these regions measures should be taken to reduce the impact of increasing water demand, especially considering the already limited supply of freshwater in the Mediterranean areas. Moreover, decreasing rainfall due to climate change might have additional negative impact on the resources.
10
The main limitation faced was the availability of detailed and up-to-date water with-drawal statistics. For the time being we used country-level data for public withwith-drawals since available regional data consistency and comparability is limited. We did, however, confirm the estimated withdrawals using actual regional statistics for France (Fig. 6). The Total Absolute Error is 26.56, or 13.3 %. Taking into account tourism reduces this
15
error and improves the estimated withdrawals spatially. It also means that additional, high water withdrawals are assigned to leisure facilities (which are often highly water use intensive), which would otherwise not be included if disaggregation was only done based on the population density.
Leakages in the distribution network may also play an important role, and should be
20
taken into account in the future. Total losses vary greatly between countries, but are mainly due to leakages in the distribution system, and to a lesser extent to evaporation. Bulgaria, Greece, Malta, and the UK all show losses much higher than the average of 7.7 % (EUROSTAT). Also, a limitation is that we assume the whole population to be connected to the public water supply, while the average EU-27 connectivity is only
25
HESSD
10, 9889–9914, 2013European public water withdrawals
and consumption
I. Vandecasteele et al.
Title Page
Abstract Introduction
Conclusions References
Tables Figures
◭ ◮
◭ ◮
Back Close
Full Screen / Esc
Printer-friendly Version Interactive Discussion
Discussion
P
a
per
|
D
iscussion
P
a
per
|
Discussion
P
a
per
|
Discuss
ion
P
a
per
|
improvements and increased awareness, especially in areas already prone to water scarcity. In the presented methodology improved water use efficiency is not accounted for, meaning that the presented water withdrawals for 2030 may be overestimations.
Finally, it should be noted that although we present a robust methodology to fore-cast future public water withdrawals, there are many uncertainties involved, especially
5
considering that the methodology is dependent on land use, tourism, and population projections, which in turn have their own model uncertainties.
References
Alcamo, J., Döll, P., Kaspar, F., and Siebert, S.: Global Change and Global Scenarios of Water Use and Availability: An Application of WaterGAP 1., Report A9701, Center for Environmental 10
Systems Research, University of Kassel, Germany, 1997.
Alcamo, J., Döll, P., Henrichs, T., Kaspar, F., Lehner, B., Rösch, T., and Siebert, S.: Development and testing of the WaterGAP 2 global model of water use and availability, Hydrolog. Sci. J., 48, 317–337, 2003.
Arbues, F., Garcia-Valinas, M. A., and Martinez-Espineira, R.: Estimation of residential water 15
demand: a state-of-the-art review, The Journal of Socio-Economics, 32, 81–102, 2003. Batista e Silva, F., Gallego, J., and Lavalle, C.: A high resolution population grid map for Europe,
Journal of Maps, 9, 16–28, doi:10.1080/17445647.2013.764830, 2013.
FAO: Gridded Livestock of the World 2007, edited by: Wint, G. R. W. and Robinson, T. P., FAO, Rome, 2007.
20
FAO – AQUASTAT: available at: http://www.fao.org/nr/water/aquastat/main/index.stm (last ac-cess: 7 February 2013), 2012.
GLOWASIS: The Global Water Scarcity Information Service FP 7 project co-ordinated by Deltares at Wageningen University, the Netherlands, available at: www.glowasis.eu (last ac-cess: 29 November 2013), 2012.
25
HESSD
10, 9889–9914, 2013European public water withdrawals
and consumption
I. Vandecasteele et al.
Title Page
Abstract Introduction
Conclusions References
Tables Figures
◭ ◮
◭ ◮
Back Close
Full Screen / Esc
Printer-friendly Version Interactive Discussion
Discussion
P
a
per
|
D
iscussion
P
a
per
|
Discussion
P
a
per
|
Discuss
ion
P
a
per
|
Kostas, B. and Chrysostomos, S.: Estimating urban residential water demand determinants and forecasting water demand for Athens metropolitan area, 2000–2010, south-eastern Europe, J. Econ., 1, 47–59, 2006.
Lavalle, C., Baranzelli, C., Batista e Silva, F., Mubareka, S., Rocha Gomes, C., Koomen, E., and Hilferink, M.: A high resolution land use/cover modelling framework for Europe: introducing 5
the EU-ClueScanner100 Model Computational Science and its Applications – ICCSA 2011, edited by: Murgante, B., Gervasi, O., Iglesias, A., Taniar, D., and Apduhan, B., Springer, Berlin, Heidelberg, 6782, 60–75, 2011.
Mekonnen, M. M. and Hoekstra, A. Y.: National Water Footprint Accounts: The Green, Blue and Grey Water Footprint of Production and Consumption, Value of Water Resources Report 10
Series No. 50, UNESCO-IHE, Delft, the Netherlands, 2011.
Nagy, M., Lenz, K., Windhofer, G., Fürst J., and Fribourg-Blanc, B.: Data Collection Manual for the OECD/Eurostat Joint Questionnaire on Inland Waters Tables 1–7, Concepts, Definitions, Current Practices, Evaluations and Recommendations, Version 2.21, EUROSTAT, European Commission, Luxembourg, 2007.
15
Shiklomanov, I. A. (Ed.): Assessment of Water Resources and Water Availability in the World, Comprehensive Assessment of the Freshwater Resources of the World, World Meteorologi-cal Organisation, Geneva, 1997.
SOeS, Service de l’observation et des statistiques: Statistique agricole annuelle pour la SAU, Ministere de L’ecologie, du developpement durable, des transports et du logement, avail-20
able at: http://www.statistiques.developpement-durable.gouv.fr/ (last access: 5 March 2013), 2007.
Wada, Y., van Beek, L. P. H., and Bierkens, M. F. P.: Modelling global water stress of the recent past: on the relative importance of trends in water demand and climate variability, Hydrol. Earth Syst. Sci., 15, 3785–3808, doi:10.5194/hess-15-3785-2011, 2011a.
25
Wada, Y., van Beek, L. P. H., Viviroli, D., Dürr, H. H., Weingartner, R., and Bierkens, M. F. P.: Global monthly water stress: II. Water demand and severity of water, Water Resour. Res., 47, W07518, doi:10.1029/2010WR009792, 2011b.
Wong, J. S., Zhang, Q., and Chen, Y. D.: Statistical modeling of daily urban water consumption in Hong Kong: trend, changing patterns, and forecast, Water Resour. Res., 46, W03506, 30
doi:10.1029/2009WR008147, 2010.
HESSD
10, 9889–9914, 2013European public water withdrawals
and consumption
I. Vandecasteele et al.
Title Page
Abstract Introduction
Conclusions References
Tables Figures
◭ ◮
◭ ◮
Back Close
Full Screen / Esc
Printer-friendly Version Interactive Discussion
Discussion
P
a
per
|
D
iscussion
P
a
per
|
Discussion
P
a
per
|
Discuss
ion
P
a
per
|
Worthington, A. C., Higgs, H., and Hoffmann, M.: Modelling Residential Water Demand in
Queensland, Australia: a Comparative Analysis of Pricing Structures and Estimation Tech-niques, School of Accounting and Finance Working Paper Series No. 06/26, University of Wollongong, 2006.
Wriedt, G., Van Der Velde, M., Aloe, A., and Bouraoui, F.: Water Requirements for Irrigation in 5
the European Union, EUR 23453 EN, OPOCE, Luxembourg (Luxembourg), 2008.
UN WWDR: 3rd UN World Water Development Report: available at: http://unesdoc.unesco.org/
images/0018/001819/181993e.pdf#page=121 (last access: 12 March 2012), 2009.
Van Beek, L. P. H., Wada, Y., and Bierkens, M. F. P.: Global monthly water stress: 1. Water bal-ance and water availability, Water Resour. Res., 47, W07517, doi:10.1029/2010WR009791, 10
2011.
Van Der Knijff, J. M., Younis, J., and De Roo, A. P. J.: LISFLOOD: a GIS-based distributed
HESSD
10, 9889–9914, 2013European public water withdrawals
and consumption
I. Vandecasteele et al.
Title Page
Abstract Introduction
Conclusions References
Tables Figures
◭ ◮
◭ ◮
Back Close
Full Screen / Esc
Printer-friendly Version Interactive Discussion
Discussion
P
a
per
|
D
iscussion
P
a
per
|
Discussion
P
a
per
|
Discuss
ion
P
a
per
|
Fig. 1.Conceptual model for the analysis of the water flows. Original definitions are based on
HESSD
10, 9889–9914, 2013European public water withdrawals
and consumption
I. Vandecasteele et al.
Title Page
Abstract Introduction
Conclusions References
Tables Figures
◭ ◮
◭ ◮
Back Close
Full Screen / Esc
Printer-friendly Version Interactive Discussion
Discussion
P
a
per
|
D
iscussion
P
a
per
|
Discussion
P
a
per
|
Discuss
ion
P
a
per
|
Fig. 2.Map of the public water withdrawals per country for the reference year 2006. Values were
HESSD
10, 9889–9914, 2013European public water withdrawals
and consumption
I. Vandecasteele et al.
Title Page
Abstract Introduction
Conclusions References
Tables Figures
◭ ◮
◭ ◮
Back Close
Full Screen / Esc
Printer-friendly Version Interactive Discussion
Discussion
P
a
per
|
D
iscussion
P
a
per
|
Discussion
P
a
per
|
Discuss
ion
P
a
per
|
40 50 60 70 80 90 100 110 120 130
1970 1975 1980 1985 1990 1995 2000 2005
P
u
b
li
c
w
a
te
r
w
it
h
d
ra
w
a
ls
i
n
m
3
p
e
r
in
h
a
b
it
a
n
t
Year
Netherlands
Poland
Finland
Swe den
HESSD
10, 9889–9914, 2013European public water withdrawals
and consumption
I. Vandecasteele et al.
Title Page
Abstract Introduction
Conclusions References
Tables Figures
◭ ◮
◭ ◮
Back Close
Full Screen / Esc
Printer-friendly Version Interactive Discussion
Discussion
P
a
per
|
D
iscussion
P
a
per
|
Discussion
P
a
per
|
Discuss
ion
P
a
per
|
Fig. 6.Public water withdrawals given in hm3 for France at NUTS3 level for 2006. Left: NUTS3
HESSD
10, 9889–9914, 2013European public water withdrawals
and consumption
I. Vandecasteele et al.
Title Page
Abstract Introduction
Conclusions References
Tables Figures
◭ ◮
◭ ◮
Back Close
Full Screen / Esc
Printer-friendly Version Interactive Discussion
Discussion
P
a
per
|
D
iscussion
P
a
per
|
Discussion
P
a
per
|
Discuss
ion
P
a
per
|
Fig. 8. Tourism density (number of tourists per 5 km pixel) for August 2006 (left), and
HESSD
10, 9889–9914, 2013European public water withdrawals
and consumption
I. Vandecasteele et al.
Title Page
Abstract Introduction
Conclusions References
Tables Figures
◭ ◮
◭ ◮
Back Close
Full Screen / Esc
Printer-friendly Version Interactive Discussion
Discussion
P
a
per
|
D
iscussion
P
a
per
|
Discussion
P
a
per
|
Discuss
ion
P
a
per
|
-10 0 10 20 30 40 50 60
LV LT BG RO DE HU EE PL SK SI CZ NL GR FI DK IT EU AVG PT AT BE FR MT SE LI UK ES LU IE
% change in public water withdrawals 2006 - 2030
C
o
u
n
tr
y
Fig. 9.The percentage change in annual public water withdrawals for 2030 as compared to
HESSD
10, 9889–9914, 2013European public water withdrawals
and consumption
I. Vandecasteele et al.
Title Page
Abstract Introduction
Conclusions References
Tables Figures
◭ ◮
◭ ◮
Back Close
Full Screen / Esc
Printer-friendly Version Interactive Discussion
Discussion
P
a
per
|
D
iscussion
P
a
per
|
Discussion
P
a
per
|
Discuss
ion
P
a
per
|
Fig. 10.The change in total public water withdrawals per NUTS2 region over the period 2006
HESSD
10, 9889–9914, 2013European public water withdrawals
and consumption
I. Vandecasteele et al.
Title Page
Abstract Introduction
Conclusions References
Tables Figures
◭ ◮
◭ ◮
Back Close
Full Screen / Esc
Printer-friendly Version Interactive Discussion
Discussion
P
a
per
|
D
iscussion
P
a
per
|
Discussion
P
a
per
|
Discuss
ion
P
a
per
|
Fig. 11.Public water withdrawals modeled at 100 m resolution for Warsaw, Poland. The figure
compares the withdrawals for 2006 (left) to those for 2030 (right).