New Insights into the Developing Rabbit
Brain Using Diffusion Tensor Tractography
and Generalized q-Sampling MRI
Seong Yong Lim1, Yeu-Sheng Tyan1,2,3, Yi-Ping Chao4, Fang-Yu Nien1, Jun-Cheng Weng1,2*
1School of Medical Imaging and Radiological Sciences, Chung Shan Medical University, Taichung, Taiwan,
2Department of Medical Imaging, Chung Shan Medical University Hospital, Taichung, Taiwan,3School of Medicine, Chung Shan Medical University, Taichung, Taiwan,4Department of Computer Science and Information Engineering, Graduate Institute of Medical Mechatronics, Chang-Gung University, Taoyuan, Taiwan
Abstract
The use of modern neuroimaging methods to characterize the complex anatomy of brain development at different stages reveals an enormous wealth of information in understand-ing this highly ordered process and provides clues to detect neurological and neurobeha-vioral disorders that have their origin in early structural and functional cerebral maturation. Non-invasive diffusion tensor magnetic resonance imaging (DTI) is able to distinguish cere-bral microscopic structures, especially in the white matter regions. However, DTI is unable to resolve the complicated neural structure, i.e., the fiber crossing that is frequently ob-served during the maturation process. To overcome this limitation, several methods have been proposed. One such method, generalized q-sampling imaging (GQI), can be applied to a variety of datasets, including the single shell, multi-shell or grid sampling schemes that are believed to be able to resolve the complicated crossing fibers. Rabbits have been widely used for neurodevelopment research because they exhibit human-like timing of perinatal brain white matter maturation. Here, we present a longitudinal study using both DTI and GQI to demonstrate the changes in cerebral maturation of in vivo developing rabbit brains over a period of 40 weeks. Fractional anisotropy (FA) of DTI and generalized fractional an-isotropy (GFA) of GQI indices demonstrated that the white matter anan-isotropy increased with age, with GFA exhibiting an increase in the hippocampus as well. Normalized quantitative anisotropy (NQA) of GQI also revealed an increase in the hippocampus, allowing us to ob-serve the changes in gray matter as well. Regional and whole brain DTI tractography also demonstrated refinement in fiber pathway architecture with maturation. We concluded that DTI and GQI results were able to characterize the white matter anisotropy changes, where-as GQI provided further information about the gray matter hippocampus area. This develop-ing rabbit brain DTI and GQI database could also be used for educational purposes and neuroscience investigations.
a11111
OPEN ACCESS
Citation:Lim SY, Tyan Y-S, Chao Y-P, Nien F-Y, Weng J-C (2015) New Insights into the Developing Rabbit Brain Using Diffusion Tensor Tractography and Generalized q-Sampling MRI. PLoS ONE 10(3): e0119932. doi:10.1371/journal.pone.0119932
Academic Editor:Ching-Po Lin, National Yang-Ming University, TAIWAN
Received:June 24, 2014
Accepted:January 25, 2015
Published:March 23, 2015
Copyright:© 2015 Lim et al. This is an open access article distributed under the terms of theCreative Commons Attribution License, which permits unrestricted use, distribution, and reproduction in any medium, provided the original author and source are credited.
Data Availability Statement:All relevant data are within the paper.
Introduction
Understanding the development and senescence of the brain systems that are associated with profound alterations in connective anatomy is of great clinical importance because most neu-rological and neurobehavioral disorders have their origin in early structural and functional ce-rebral maturation. Animal models have been essential for the understanding of the brain and neurodevelopment. Several species have been used in neuroscience research, from primates to small animals such as rat, mouse and rabbit. Rabbits have many advantages over other animal species; principally, rabbits exhibit human-like timing of perinatal brain white matter matura-tion and have been widely employed to model brain damage after perinatal injury in humans [1]. Rabbit models of cerebral palsy [1,2], intrauterine inflammation [3], and intrauterine growth restriction [4] have been developed, demonstrating changes in neonatal neurobeha-vioral and in brain structure [5].
By using conventional MRI, we have been able to macroscopically delineate early develop-ment events such as myelination and gyral developdevelop-ment. Studies by Barkovich et al. demon-strated changes in signal intensity on T1- and T2-weighted images during brain maturation of children and these have been attributed to decreases in brain water content and the presence of myelination process [6]. Diffusion tensor magnetic resonance imaging (DTI) is another MR modality that can microscopically reveal water diffusion in the biological tissue [7], allowing the alterations in brain water diffusion caused by the cerebral maturational processes in neona-tal brain to be analyzed quantitatively. The values of the water diffusion parameters differ markedly between neonate/pediatric brain and adult brain, and these parameters vary with age. DTI studies by Huppi et al. [8], Neil et al. [9], Mukherjee et al. [10] have shown that water molecule mean diffusivity decreases with age in both gray and white matter, diffusion anisotro-py increases with age especially in white matter region. Brain water content; the formation of new barriers to water mobility, such as cell membranes associated with the outgrowth of axons and dendrites; and white matter myelination, are regarded as factors that would affect the water molecule mean diffusivity.
Water diffusion maps derived from DTI may provide the means for the early detection of ir-reversible brain injury, which is particularly critical in the context of the administration of ther-apies to neonates [11]. With the development of 3D diffusion tensor fiber tractography, cerebral maturation, especially of the white matter pathway, and its consequent connectivity can be followed throughout neonate development into adulthood, with the potential to study the correlations between the abnormalities found on DTI and the ultimate neurological or neu-robehavioral outcomes [12]. It is worth noting that the precise DTI water diffusion parameters that are to be employed are still open to debate. The principal orientations, which are the eigen-vectors that were obtained from the diffusion tensors, have allowed the tracking of the axonal fiber tracts and have revealed the white matter connections between cortical areas. However, due to the inherent limitation of the Gaussian tensor model, DTI cannot resolve complicated structures, such as the crossing or branching neural fibers [13,14]. Furthermore, the white matter maturational myelination process would significantly affect the diffusion anisotropy as well.
To overcome these problems and to better characterize the complicated fiber structures, sev-eral reconstruction methods combined with proper acquisition and diffusion encoding have been proposed. These reconstruction methods typically have their own applicable diffusion sampling schemes, which may include a single-shell scheme used by high angular resolution diffusion imaging (HARDI) [15]; a multiple-shell scheme [16,17]; or a grid scheme used by diffusion spectrum imaging (DSI) [18]. The model-free approaches or the q-space imaging methods are based on the Fourier relationship between the diffusion MR signals and the Competing Interests:The authors have declared
underlying diffusion propagator [19]. Based on the data acquired through the HARDI scheme, Tuch proposed q-ball imaging (QBI) to estimate the diffusion ODF of the diffusion propaga-tors using the Funk-Radon transformation [20]. By using a grid sampling scheme, Wedeen proposed diffusion spectrum imaging (DSI), which calculates ODF by applying the Fourier transform to the diffusion MR signals. To further extend the applicability of q-space imaging, Yeh et al. proposed generalized q-sampling imaging (GQI), which can be applied to a variety of datasets under a balanced sampling scheme such as the single-shell, multi-shell or grid sam-pling schemes, with accuracy comparable to QBI and DSI. Furthermore, GQI is believed to be able to resolve complicated crossing fibers [21].
Studies by D'Arceuil et al. using fixed rabbit brains to observe the developmental changes in regional diffusion anisotropy and white matter fiber tract development have demonstrated that white matter anisotropy increases with age [22]. To provide a unique insight into the structural basis of cerebral maturation as well as to characterize developmental changes more accurately for future injury or disease investigations, we proposed the usage of both DTI and GQI to dem-onstrate the longitudinal changes of the in vivo developing rabbit brain.
Materials and Methods
Animal preparation
All the procedures of the animal experiment adhered to the Guidelines for Care and Use of Ex-perimental Animals by the Laboratory Animal Center at the Chung Shan Medical University, Taichung, Taiwan. The protocol was approved by the Committee on the Ethics of Animal Ex-periments of the Chung Shan Medical University, Taichung, Taiwan (Permit Number: 1219). Five adult male New Zealand white rabbits (aged from 4 weeks to 40 weeks) were used in this longitudinal experiment. The rabbits were singly housed in a climate-controlled environment on a 12-hour light-dark cycle with food and water available ad libitum.
For the MRI scan, each experimental animal was placed in the prone position and was anes-thetized using an inhalation anesthesia mix of isoflurane (5% induction and 2.5% maintenance) and oxygen (300 mL/min) via a homemade plastic nasal/oral mask, and all efforts were made to minimize suffering. A real-time visual monitoring system was used to confirm the immobili-zation of the animals during the MRI scan. The heart rate and respiratory rate were monitored throughout the scan, and the temperature (37°C) was maintained via circulating heat pads.
Data acquisition
In our study, a brain MRI was performed on all five rabbits every four weeks, starting from the 4thweek until the 24thweek as well as on the 32ndand 40thweek (8 time points in total) using a 1.5 Tesla MR scanner (Magnetom Sonata, Siemens Medical Solutions, Erlangen, Germany) with double loop array coils.
The diffusion data were acquired using a multi-slice, single-shot spin echo- echo planar im-aging (EPI) sequence with TR/TE = 2900 ms/133 ms, resolution = 0.78 x 0.78 mm2, slice thick-ness = 2 mm, NEX = 9, and number of slices = 12. Coronal scanning was carried out
contiguously from the olfactory bulb to the end of the cerebrum (done in two parts). We used 12 directions of the diffusion gradient, and each encoding direction was composed of 8 incre-ments corresponding to b values ranging incrementally from 0 to 2000 s/mm2(with a 250 s/ mm2interval). The total scan time for the diffusion acquisition was approximately 42 min for each part.
Image analysis
For T2WI and R2 mapping, the changes of the regional brain size and myelination were evalu-ated. We calculated the signal intensity in both sides of the brain regions in the T2WI, includ-ing the corpus callosum, hippocampus, olfactory tract and cerebral cortex. The size of each brain region was divided by the size of whole brain. All of the results are expressed as the mean ± standard error (SE), and statistical analysis was performed and compared across the develop-ment of rabbit brain. In the R2 mapping, we calculated the changes of the R2 value in the hip-pocampus and corpus callosum, which could imply the myelination status.
Image reconstruction of DTI and GQI was performed using DSI Studio (National Taiwan University, Taiwan). The GQI reconstruction was implemented with a diffusion sampling ratio of 1.3; for the majority of the application, we are observing restricted diffusion, and a ratio 1.3 should covers most of the diffusion, as suggested in the GQI study [21]. For tractography, four structures (cortex, hippocampus, corpus callosum, and olfactory tract) were selected for the tracking of their fiber pathway, and the whole brain tractography was also demonstrated.
For the diffusion tensor imaging (DTI) analysis, the fractional anisotropy (FA), mean diffu-sivity (MD), axial diffudiffu-sivity (AD) and radial diffudiffu-sivity (RD) mapping were calculated. For the generalized q-sampling imaging (GQI) analysis, the normalized quantitative anisotropy (NQA), generalized fractional anisotropy (GFA), and isotropic value of the ODF (ISO) were calculated. The precise definition of these new diffusion indices from GQI can be found on the website of DSI studio (http://dsi-studio.labsolver.org/Manual/Reconstruction) or on GQI paper [21]. The ROIs of the corpus callosum, bilateral olfactory bulbs, hippocampi and cerebral cortex were manually drawn by an expert operator on four consecutive slices on GFA maps. Same ROIs were then used to calculate changes of FA, MD, AD, RD, NQA and ISO across our longitudinal study. All results are expressed as the mean ± SE, and the normalized ratios (the value of ROI divided by the value of cortex) were calculated for statistical analysis and com-pared across the development and maturation of rabbit.
For the statistical analysis, a paired t-test was used to detect any significant differences be-tween the maturation time points in each of the 8 examined compartments of the diffusion (DTI and GQI) indices and the anatomical images (T2WI, R2 mapping). A p-value of<0.05
was considered statistically significant.
Results
Regional brain size and R2 mapping
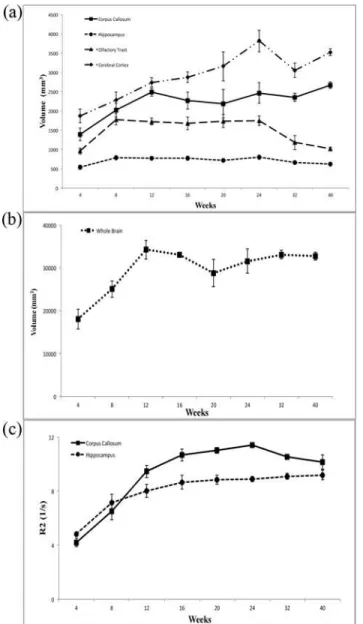
of the volume of whole brain, there was a very prominent increase from week 4 to week 12 be-fore reaching to a plateau on subsequent weeks.
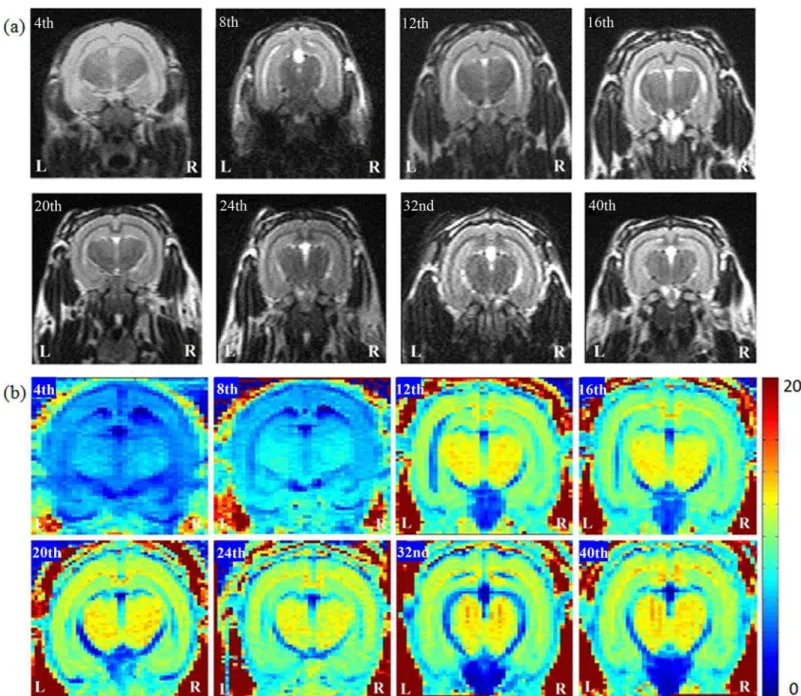
Using R2 mapping, we observed that the intensity in the regions of corpus callosum and hippocampus increased prominently through week 12, with values of R2 increasing from 4.19±0.32 /sec to 9.45±0.44 /sec for corpus callosum; and from 4.83±0.08 /sec to 8.02±0.49 /sec for hippocampus. InFig. 2c, the prominent continuous increase in the values of R2 for both the corpus callosum and hippocampus in the developing rabbit brains from 4 to 24 weeks can be observed.
Fig 1. The anatomical MR images, (a) T2W images and (b) R2 mapping, in 4- to 40-week-old developing rabbit brains.Using R2 mapping, we observed that the intensity in the regions of corpus callosum and hippocampus increased through week 12 prominently.
Tractography
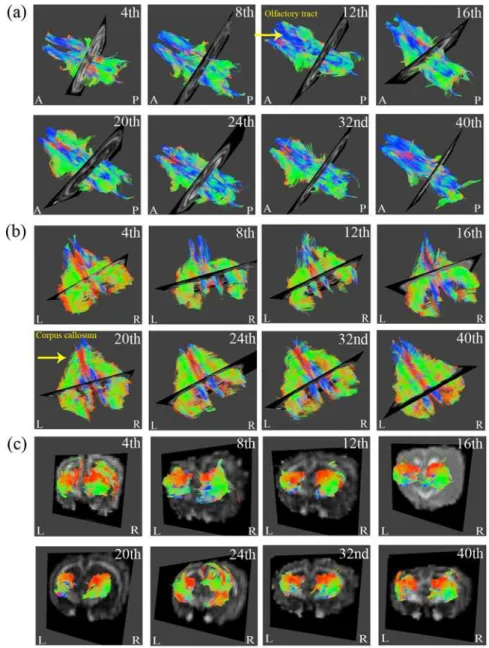
InFig. 3, the rendered fiber pathway of the major white matter tracts, such as the corpus callo-sum and olfactory tract, as well as the gray matter, such as the hippocampus, exhibited refine-ment in the regional tract architecture with increasing age. Tracking the results of the cerebral cortex and whole brain fromFig. 4also validated the cerebral maturation as the complex and complicated fibers were observed to be more compact and well organized.
DTI indices
As shown in Figs.5and6, the normalized FA value of corpus callosum and olfactory bulb in-creased with age, and there was no significant change in the normalized FA of the hippocam-pus with age. The value of normalized FA for the corhippocam-pus callosum, the major white matter Fig 2. The changes in (a) regional brain size and (b) whole brain size in 4- to 40-week-old developing rabbit brains.(c) The changes in the R2 values of the corpus callosum and hippocampus in developing rabbit brains from 4 to 40 weeks.
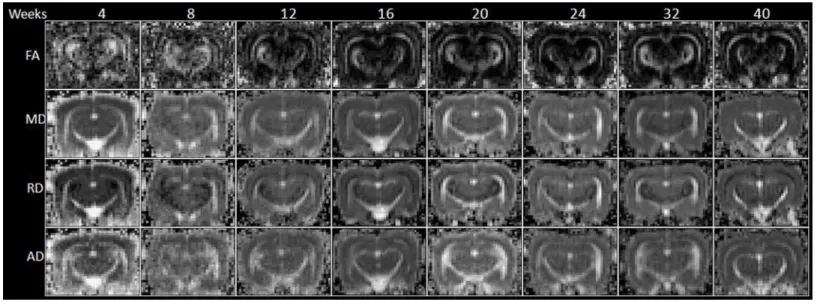
tract, first dip in the 4thto 8thweek, yet the subsequent increase in the following weeks was very prominent. For olfactory bulb, there was a small decrease from the 8thto 12thweek, yet in the subsequent weeks, the increase was equally prominent. The normalized MD and normal-ized RD of the corpus callosum and hippocampus decreased with age, and there was no signifi-cant change in the normalized AD of these structures with age.
GQI indices
In Figs.7and8, we observed that the normalized GFA of the corpus callosum, hippocampus and olfactory bulb increased with age. The normalized GFA value of the structure of the corpus callosum, the major white matter tract, first dip in the 4thto 12thweek, although the subsequent Fig 3. Regional brain DTI tractography from 4- to 40-week-old rabbits.The three regions presented in (a) to (c) include the olfactory tracts, corpus callosum and hippocampus, respectively. (L: Left; R: Right; A: Anterior; P: Posterior.)
Fig 4. The DTI tractography of (a) cerebral cortex and (b) whole brain from 4- to 40-week-old rabbits (L: Left; R: Right; A: Anterior; P: Posterior).
doi:10.1371/journal.pone.0119932.g004
Fig 5. The FA, MD, RD and AD mapping of 4- to 40-week-old rabbit brains derived from DTI.
Fig 6. The longitudinal changes in diffusion indices in DTI, including FA, MD, RD and AD, with respect to the structures of corpus callous, hippocampus and olfactory bulb of 4- to 40-week-old rabbit brains.
doi:10.1371/journal.pone.0119932.g006
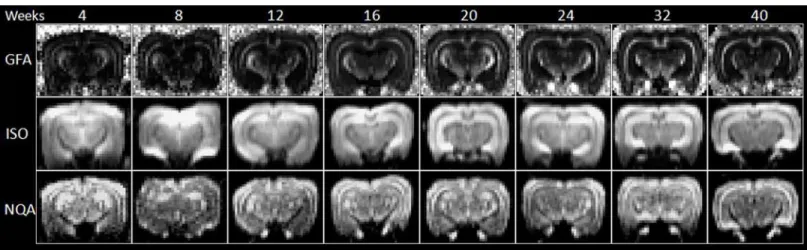
Fig 7. GFA, ISO and NQA mapping of 4- to 40-week-old rabbit brains derived from GQI.
increase in the following weeks was very prominent. With respect to the structures of the olfac-tory bulb and hippocampus, there was a continuous significant increase beginning in the 4th week. Overall, the normalized ISO value of the corpus callosum decreased with age and in-creased in the structure of the hippocampus. With respect to the value of normalized NQA, changes in the hippocampus exhibited a more prominent increase as the brain developed. Fig 8. The longitudinal changes in diffusion indices in GQI, including GFA, ISO and NQA, with respect to the structures of corpus callous, hippocampus and olfactory bulb of 4- to 40-week-old rabbit brains.
Discussion
R2 mapping
According to the results of R2 mapping (Fig. 1b), by the 12thweek, the intensity of the whole brain increased prominently, especially in the regions of the corpus callosum and hippocampus as the brain developed.Fig. 2cdemonstrates that the calculated R2 values of the corpus callo-sum and hippocampus gradually increased with age. D'Arceuil et al. reported that the myelina-tion process of the rabbit brain corpus callosum persisted through at least the 4thweek after birth [22]. Weng et al. observed the thickening of the myelin sheath of the corpus callosum of rat from the 3rdweek to 3rdmonth [23]. Studies by Fukunaga et al. also reported that the pres-ence of myelin or myelination process may have caused the R2 value to increase [24]. By using R2 mapping, we observed that the increasing R2 values is consistent with the increase of myeli-nation process during the same period of cerebral maturation, which may further confirm myelination relationship with the water diffusion parameters.
Tractography
Tractography, commonly known as fiber tracking, is another technique that can be applied to the developing brain to quantitatively assess specific fiber pathway maturation, especially in the white matter regions. Berman et al. were able to demonstrate significant differences in the maturational changes in FA between the motor and somatosensory pathway in premature in-fants, further validating this approach for use in measuring the diffusion changes across multi-ple different levels of functional tracts [25].
In Figs.3and4, the colors of red, green and blue represented fibers in the directions of supe-rior-inferior, left-right and anterior-posterior.Fig. 3ashowed prominent increases of blue fi-bers along the tract especially after 12thweek inferred the maturational refinements in the anterior-posterior pathway of olfactory tracts.Fig. 3bshowed prominent increases of green fi-bers as early as after 20thweek that inferred the maturational refinements in the direction of left to right, which is the major fiber pathway of corpus callosum that have contralateral axonal projections for connecting the left and right cerebral hemispheres. As for the results of the cere-bral cortex inFig. 4a, more abundant fibers of all orientations could be observed, especially after 40thweek which may infer that the fibers of gray matter structure grew in all different di-rections. Finally for the tracking of whole brain fromFig. 4b, it is apparent that a more compact and well organized fiber pathway of all directions had been developed especially after
20thweek.
Diffusion indices
As we mentioned earlier, the diffusion indices or anisotropy values differ markedly between pe-diatric and adult brain [26]. With respect to white matter areas, the diffusion indices are rela-tively low for newborns and increase steadily with the increasing age [27]. We could observe the same trend in the normalized FA values of DTI and normalized GFA values of GQI for the corpus callosum as well. The definition of GFA is documented in the Q-ball Imaging paper and it is calculated from an orientation distribution function (ODF), note that like the FA for DTI, GFA is automatically normalized to [0, 1] as well. According to the paper, scalar measures on the ODF are useful to define tissue contrast, perform statistical analyses, or summarize geomet-ric properties of the ODF [20].
maximum and therefore cannot adequately describe diffusion functions with multiple maxima. The fiber crossing confound in DTI has prompted efforts to develop methods capable of resolv-ing intravoxel fiber crossresolv-ing, such as HARDI, QBI, DSI, GQI [13–18,20,21].
For the trend of normalized FA change inFig. 6aand normalized GFA inFig. 8awhich looked similar but different at the first 3 time points, we believed that these may be resulted from the presence of crossing fibers in the corpus callosum which cannot be resolved from DTI. Myelination process should have taken place as well, yet we speculated that maybe the ef-fect on diffusion anisotropy may not be adequate to cause changes yet. Subsequently after these 3 time points, myelination process may have taken place more rigorously which provided simi-lar increasing trend for both normalized FA and normalized GFA. From these observations, we could infer from the trend difference at the first 3 time points that GQI diffusion indices are the more appropriate representations for the underlying changes caused by the crossing fibers.
Yeh et al. introduced an index known as quantitative anisotropy (QA) for GQI to quantify the spin population in a specific direction which is believed to be able to resolve complicated crossing fibers, especially in the regions of gray matter [21]. The normalized QA (NQA) scales the maximum QA value of a subject to 1 so that QA may be more comparable across subject. NQA values introduced in GQI demonstrated a prominent increase in the gray matter struc-ture of the hippocampus, giving us the opportunity to observe gray matter changes during the maturational process.
According to technical review on DTI of normal and injured developing human brain [28], the precise contribution to the decrease in the values of MD with increasing age is not known, although it has been postulated that the rapid decrease observed between early gestation and term is due to the concomitant decrease in overall water content [9]. As it does, structures that hinder water motion (e.g. cell and axonal membranes) become more densely packed, increas-ing restriction to motion; as if the brain becomes more viscous as its water content decreases. During rabbit brain maturation, our normalized MD values decrease with increasing age, as observed in the structures of the corpus callosum and hippocampus. The same trend could be observed in the values of normalized ISO in the structures of the corpus callosum. However, a different increasing trend could be observed in the hippocampus. ISO used the minimum value of an ODF as the background isotropic diffusion component, as documented in Yeh’s 2010 GQI paper [21]; again another GQI index give us the opportunity to observe gray matter changes during the maturational process.
Through the measurements of three eigenvectors, we may infer that not all the changes in MD are due to the reduction in the overall brain water content. Water diffusion in the perpen-dicular direction to white matter fibers, which is observed principally in RD, decreased with in-creasing age, as demonstrated prominently by our results. This result may indicate changes due to premyelination (change of axonal width) and myelination [29]. As the anisotropy values of the cortical gray matter in rabbit brain after birth are generally consistent; this fact represents the main reason we chose to use cortex anisotropy values for normalization.
Comparison between GQI and DTI indices
method, GQI overcomes the limitation of DTI, which was unable to resolve the complicated neural structures, i.e., fiber crossing. Therefore, GQI-derived diffusion indices can greatly im-prove the level of significance and specificity in the analysis along axial direction.
Previous study demonstrated that various diffusion indices estimated by conventional DTI, including FA, are b-value-dependent. While applying different b-values may provide different physiological information, comparison among conventional DTI studies must be made with caution [30]. The assumption of the monoexponential attenuation due to diffusion is invalid when the b-value is high, but high b-values can probe high diffusion frequency information. The GQI demonstrated in the present study improves the detectability of the microstructural changes during brain maturation.
Limitations
Conventional DTI protocol required at least one b-value with 6 independent diffusion gradient directions and one null image, while higher order HARDI protocol required more diffusion gradient directions and higher b-values. Due to the limitation of our clinical scanner, we have used the maximum 12 directions of the diffusion gradient that was allowed. As for the maxi-mum b-value of 2000 s/mm2, increasing it would have lower down our signal to noise ratio as our rabbit brain is comparatively smaller than human brain.
In future, we definitely look forward to carry out GQI protocol through scanners that are ca-pable of providing higher b-values and more diffusion gradient directions. There is always a challenging issue of optimizing the b-table for diffusion scans as the performance of the b-table depends largely on the reconstruction method, and the best table for one method may not work for another. More studies are needed to resolve this question. As in our study here, we be-lieved that we have taken the best from our clinical scanner, both time wise and signal wise.
Conclusions
Our results demonstrated that the white matter anisotropy and R2 values increased with age. Regional brain DTI tractography of all region of interest (ROI) revealed refinement in fiber pathway architecture with maturation. Furthermore, GQI indices revealed that the major white tract as well as the gray matter change during the mature period and may represent important targets for in vivo human studies. Therefore, this developing rabbit brain DTI and GQI data-base and techniques could be used for educational purposes and neuroscience investigations.
Acknowledgments
The authors appreciate the full support from the School of Medical Imaging and Radiological Sciences, Chung Shan Medical University, Taichung, Taiwan and the Department of Medical Imaging, Chung Shan Medical University Hospital, Taichung, Taiwan. The authors would like to thank Yu-Han Hong and Yi-Wen Peng for their assistance in animal preparation.
Author Contributions
Conceived and designed the experiments: JCW YST. Performed the experiments: SYL FYN. Analyzed the data: SYL FYN. Contributed reagents/materials/analysis tools: JCW YST YPC. Wrote the paper: JCW SYL.
References
2. Drobyshevsky A, Derrick M, Wyrwicz AM, Ji X, Englof I, Ullman LM, et al. White matter injury correlates with hypertonia in an animal model of cerebral palsy. J Cereb Blood Flow Metab. 2007; 27, 270–281. PMID:16736047
3. Saadani-Makki F, Kannan S, Lu X, Janisse J, Dawe E, Edwin S, et al. Intrauterine administration of en-dotoxin leads to motor deficits in a rabbit model: a link between prenatal infection and cerebral palsy. Am J Obstet Gynecol. 2008; 199: 651.e1–651.e7. doi:10.1016/j.ajog.2008.06.090PMID:18845289 4. Eixarch E, Figueras F, Hernandez-Andrade E, Crispi F, Nadal A, Torre I, et al. An experimental model
of fetal growth restriction based on selective ligature of uteroplacental vessels in the pregnant rabbit. Fetal Diagn Ther. 2009; 26: 203–211. doi:10.1159/000264063PMID:19955698
5. Eixarch E, Batalle D, Illa M, Munoz-Moreno E, Arbat-Plana A, Amat-Roldan I, et al. Neonatal neurobe-havior and diffusion MRI changes in brain reorganization due to intrauterine growth restriction in a rabbit model. PLoS ONE. 2012; 7: e31497. doi:10.1371/journal.pone.0031497PMID:22347486
6. Barkovich AJ, Kjos BO, Jackson DE Jr, Norman D. Normal maturation of the neonatal and infant brain: MR imaging at 1.5 T. Radiology. 1988; 166: 173–180. PMID:3336675
7. Basser PJ, Pierpaoli C. Microstructural and physiological features of tissues elucidated by quantitative-diffusion-tensor MRI. J Magn Reson B. 1996; 111: 209–219. PMID:8661285
8. Huppi PS, Maier SE, Peled S, Zientara GP, Barnes PD, Jolesz FA, et al. Microstructural development of human newborn cerebral white matter assessed in vivo by diffusion tensor magnetic resonance im-aging. Pediatr Res. 1998; 44: 584–590. PMID:9773850
9. Neil JJ, Shiran SI, McKinstry RC, Schefft GL, Snyder AZ, Almli CR, et al. Normal brain in human new-borns: apparent diffusion coefficient and diffusion anisotropy measured by using diffusion tensor MR imaging. Radiology. 1998; 209: 57–66. PMID:9769812
10. Mukherjee P, Miller JH, Shimony JS, Conturo TE, Lee BC, Almli CR, et al. Normal brain maturation dur-ing childhood: developmental trends characterized with diffusion-tensor MR imagdur-ing. Radiology. 2001; 221: 349–358. PMID:11687675
11. Rutherford MA, Azzopardi D, Whitelaw A, Cowan F, Renowden S, Edwards AD, et al. Mild hypothermia and the distribution of cerebral lesions in neonates with hypoxic-ischemic encephalopathy. Pediatrics. 2005; 116: 1001–1006. PMID:16199715
12. Glenn OA, Henry RG, Berman JI, Chang PC, Miller SP, Vigneron DB, et al. DTI-based three-dimension-al tractography detects differences in the pyramidthree-dimension-al tracts of infants and children with congenitthree-dimension-al hemi-paresis. J Magn Reson Imaging. 2003; 18: 641–648. PMID:14635148
13. Wiegell MR, Larsson HB, Wedeen VJ. Fiber crossing in human brain depicted with diffusion tensor MR imaging. Radiology. 2000; 217: 897–903. PMID:11110960
14. Alexander AL, Hasan KM, Lazar M, Tsuruda JS, Parker DL. Analysis of partial volume effects in diffu-sion-tensor MRI. Magn Reson Med. 2001; 45: 770–780. PMID:11323803
15. Tuch DS, Reese TG, Wiegell MR, Makris N, Belliveau JW, Wedeen VJ. High angular resolution diffu-sion imaging reveals intravoxel white matter fiber heterogeneity. Magn Reson Med. 2002; 48: 577–582. PMID:12353272
16. Khachaturian MH, Wisco JJ, Tuch DS. Boosting the sampling efficiency of q-Ball imaging using multiple wavevector fusion. Magn Reson Med. 2007; 57: 289–296. PMID:17260358
17. Wu YC, Alexander AL. Hybrid diffusion imaging. Neuroimage. 2007; 36: 617–629. PMID:17481920 18. Wedeen VJ, Hagmann P, Tseng WY, Reese TG, Weisskoff RM. Mapping complex tissue architecture
with diffusion spectrum magnetic resonance imaging. Magn Reson Med. 2005; 54: 1377–1386. PMID:
16247738
19. Callaghan PT. Principles of Nuclear Magnetic Resonance Microscopy. Clarendon Press, Oxford; 1993. pp. 438–441.
20. Tuch DS. Q-ball imaging. Magn Reson Med. 2004; 52: 1358–1372. PMID:15562495
21. Yeh FC, Wedeen VJ, Tseng WY. Generalized q-sampling imaging. IEEE Trans Med Imaging. 2010; 29: 1626–1635. doi:10.1109/TMI.2010.2045126PMID:20304721
22. D'Arceuil H, Liu C, Levitt P, Thompson B, Kosofsky B, de Crespigny A. Three-dimensional high-resolu-tion diffusion tensor imaging and tractography of the developing rabbit brain. Dev Neurosci. 2008; 30: 262–275. PMID:17962716
23. Weng JC, Chen JH, Kuo LW, Wedeen VJ, Tseng WY. Maturation-dependent microstructure length scale in the corpus callosum of fixed rat brains by magnetic resonance diffusion-diffraction. Magn Reson Imaging. 2007; 25: 78–86. PMID:17222718
25. Berman JI, Mukherjee P, Partridge SC, Miller SP, Ferriero DM, Barkovich AJ, et al. Quantitative diffu-sion tensor MRI fiber tractography of sensorimotor white matter development in premature infants. Neu-roimage. 2005; 27: 862–871. PMID:15978841
26. Hermoye L, Saint-Martin C, Cosnard G, Lee SK, Kim J, Nassogne MC, et al. Pediatric diffusion tensor imaging: normal database and observation of the white matter maturation in early childhood. Neuro-image. 2006; 29: 493–504. PMID:16194615
27. Klingberg T, Vaidya CJ, Gabrieli JD, Moseley ME, Hedehus M. Myelination and organization of the fron-tal white matter in children: a diffusion tensor MRI study. Neuroreport. 1999; 10: 2817–2821. PMID:
10511446
28. Neil J, Miller J, Mukherjee P, Huppi PS. Diffusion tensor imaging of normal and injured developing human brain—a technical review. NMR Biomed. 2002; 15: 543–552. PMID:12489100
29. Mukherjee P, Miller JH, Shimony JS, Philip JV, Nehra D, Snyder AZ, et al. Diffusion-tensor MR imaging of gray and white matter development during normal human brain maturation. AJNR Am J Neuroradiol. 2002; 23: 1445–1456. PMID:12372731
30. Jin T, Kim SG. Functional changes of apparent diffusion coefficient during visual stimulation investigat-ed by diffusion-weightinvestigat-ed gradient-echo fMRI. Neuroimage. 2008; 41: 801–812. doi:10.1016/j.