DOI: http://dx.doi.org/10.1590/2446-4740.02317 Volume 33, Number 3, p. 269-275, 2017
Introduction
The search for human brain templates and atlases has been progressing in the past decades. Initially, the most widely used atlases was one by Talairach and Tournoux (Talairach, 1988), being based on histology data from a single subject. Another example of well-known brain template is the cytoarchitectural map of the cortex by Brodmann’s map (Brodmann, 2005), which has been widely used for image registering, identifying, and reporting human cortical locations in a common coordinate system (Strotzer, 2009; Thottakara et al., 2006; Zilles and Amunts, 2010). With the advances in MRI images, a human brain template was developed
by the Montreal Neurological Institute (MNI) and the International Consortium of Brain Mapping (ICBM) (Evans et al., 2012; Mandal et al., 2012). These maps were created by a large number of T1-weighted MR images of normal subjects into a common template and are essentials as a target data for normalization-based group analyses (Evans et al., 2012; Smith et al., 2004).
Following these brain templates and the raising necessity to others MR imaging modalities, the Diffusion Tensor Imaging (DTI) was also intensively studied to add more possibilities for the white matter brain studies (Alves et al., 2012; Itagiba et al., 2010; Miraldi et al., 2013; Rittner et al., 2014). In the past, the lack of white matter information is understandable due to a homogeneous appearance in conventional MRI, as well as in histology preparations (Hua et al., 2008; Mori et al., 2008). However, with the advances in the DTI image acquisition and processing, the usage of quantitative brain maps such as fractional anisotropy (FA) and mean diffusivity (MD) proved as an important measure for many studies and in the clinical routine (Inglese and Bester, 2010; Kubicki et al., 2007; Pujol et al., 2015; Qiu et al., 2015; Shenton et al., 2012). In addition, in order to understand disease patterns (e.g., the lesion frequency in a speciic white matter location) or to
Populational brain models of diffusion tensor imaging for statistical
analysis: a complementary information in common space
Antonio Carlos da Silva Senra Filho
1*, Luiz Otávio Murta Junior
11 Department of Computing and Mathematics, University of São Paulo, Ribeirão Preto, SP, Brazil.
Abstract Introduction: The search for human brain templates has been progressing in the past decades and in order to understand disease patterns a need for a standard diffusion tensor imaging (DTI) dataset was raised. For this purposes, some DTI templates were developed which assist group analysis studies. In this study, complementary
information to the most commonly used DTI template is proposed in order to offer a patient-speciic statistical
analysis on diffusion-weighted data. Methods: 131 normal subjects were used to reconstruct a population-averaged template. After image pre processing, reconstruction and diagonalization, the eigenvalues and eigenvectors were used to reconstruct the quantitative DTI maps, namely fractional anisotropy (FA), mean diffusivity (MD), relative anisotropy (RA), and radial diffusivity (RD). The mean absolute error (MAE) was calculated using a voxel-wise procedure, which informs the global error regarding the mean intensity value for each quantitative map. Results: The MAE values presented a low MAE estimate (max(MAE) = 0.112), showing a reasonable error measure between our DTI-USP-131 template and the classical DTI-JHU-81 approach, which also shows a statistical equivalence (p<0.05) with the classical DTI template. Hence, the complementary standard deviation (SD) maps for each quantitative DTI map can be added to the classical DTI-JHU-81 template. Conclusion: In this study, variability DTI
maps (SD maps) were reconstructed providing the possibility of a voxel-wise statistical analysis in patient-speciic
approach. Finally, the brain template (DTI-USP-131) described here was made available for research purposes on the web site (http://dx.doi.org/10.17632/br7bhs4h7m.1), being valuable to research and clinical applications.
Keywords Magnetic resonance imaging, Diffusion Tensor Imaging, Brain templates, Statistical analysis.
This is an Open Access article distributed under the terms of the Creative Commons Attribution License, which permits unrestricted use, distribution, and reproduction in any medium, provided the original work is properly cited.
How to cite this article: Senra ACS Fo, Murta LO Jr. Populational brain models of diffusion tensor imaging for statistical analysis: a complementary information in common space. Res Biomed Eng. 2017; 33(3):269-275. DOI: 10.1590/2446-4740.02317.
*Corresponding author: Department of Computing and Mathematics, University of São Paulo – USP, Av. Bandeirantes, 3900, Monte
correlate these anatomic abnormalities with functional deicits using group statistical analyses, a need for a standard DTI dataset was raised. For this purpose, some DTI templates were developed (Mori et al., 2009; 2008; Oishi et al., 2009; Zhang et al., 2011), in which the Mori et al. (2008) standard (DTI-JHU-81) have been adopted as the common dataset for many studies.
Following the advances in DTI template reconstruction, the scientiic community also provided several computational tools in order to apply DTI data on neurodegenerative diseases. Known examples of frameworks widely used by the community are the Tract-Based Spatial Statistics (TBSS) (Smith et al., 2006) and Tract Speciic Analysis (TSA) (Zhang et al., 2010), which provide a computational analysis for group-based statistical comparison and are directly beneited with the DTI-JHU-81 template. However, even though the computational application and DTI regularization on neuroscience has been growing, a patient-speciic approach was still lacking.
In this paper, we introduce a complementary DTI template for the widely used DTI-JHU-81 brain template (Mori et al., 2008), which aims to add the variability information on the mean DTI maps already provided in the classical DTI template offered by Mori et al. (2008). Our objective is to make available a useful information for statistical patient-speciic analysis, that it is still lacking in the previous versions of the DTI-JHU-81 template.
Methods
DTI data
DTI data obtained from 131 normal subjects were used for the population-averaged template, where all the subjects were acquired at the Hospital das Clínicas at Ribeirão Preto (M: 70, F: 61, average age: 34.12 (18 – 45 years old, right-handed). The acquisition protocol was set on a 3.0T MRI scanner (Phillips, Achieva) with the following acquisitions parameters: single-shot echo-planar imaging sequence, parallel imaging factor of 2.0, matrix of 128 × 128, ield of view of 240 × 240 mm (nominal resolution: 2.0 mm isotropic), transverse sections were acquired parallel to the anterior commissure-posterior commissure line (AC-PC), N=1 samples, and 72 sections covered the entire hemisphere and brainstem without gaps. Diffusion weighting images were encoded along 32 whole sphere independent orientations and the b-value was 1,000 s/mm2.
The scanning time per dataset was approximately 4 minutes, which follows a reasonable data acquisition protocol in the clinical routine. The study was approved by the Ethics Committee of the Medicine School of Ribeirão Preto at the University of São Paulo.
Data preparation
In order to attenuate the subject motion and eddy-current induced image distortion, the raw diffusion-weighted images (DWIs) sequences were corrected using the recent EDDY method (Andersson and Sotiropoulos, 2016). The average of all DWIs (aDWI) was calculated after the tensor normalization and registration procedure described in Zhang et al. (2010; 2011). The six elements of the diffusion tensor were calculated for each pixel with weighted least square reconstruction developed in DTIFIT toolkit (FMRIB’s Software Library) (Jenkinson et al., 2012). After diagonalization, the eigenvalues and eigenvectors were used to reconstruct the quantitative DTI maps, namely fractional anisotropy (FA), mean diffusivity (MD), relative anisotropy (RA), and radial diffusivity (RD) as described in Equations 1, 2, 3 and 4.
( )
(
)
(
( ))
(
( ))
(
)
2 2 2
1 2 3
2 2 2
1 2 3
3 . 2
E E E FA= λ − λ + λ − λ + λ − λ
λ + λ + λ (1)
( 1 2 3)
3
MD= λ + λ + λ (2)
( )
(
)
(
( ))
(
( ))
( )
2 2 2
1 2 3
3.
λ − λ + λ − λ + λ − λ =
λ
E E E RA
E (3)
2 3
2
RD=λ + λ (4)
The DTI-JHU-81 brain template was used to drive our diffusion data to ICBM space (MNI152). These images were normalized using a hybrid registration approach, where an initial 12-mode afine transformation and a diffeomorphic elastic sequential registration were applied using the FLIRT and FNIRT registration tools (Jenkinson and Smith, 2001; Klein et al., 2009). A recent registration analysis showed that the hybrid approach adopted here results in optimum alignment (Klein et al., 2009; Sotiras et al., 2013), being useful for our data preparations steps. It is worth noting that the transformation matrices were also applied on the gradient tensors in order to rearrange the tensor information to the common space.
population-averaged data, the linearly transformed (trilinear interpolation) tensor ields from each individual were used to calculate the average and standard deviation (SD) maps by simple scalar calculation of tensor elements. The inal result is a collection of DTI quantitative maps in ICBM space, informing the mean and SD intensity proile, being called as DTI-USP-131.
Evaluation of brain templates
A global brain template comparison was conducted regarding the DTI-JHU-81 brain template (comparison between the average maps), in which aims to evaluate the equivalence of our DTI maps and the DTI-JHU-81 dataset. The mean absolute error (MAE) was calculated using a voxel-wise procedure as described in Equation 5, which informs the global error regarding the mean intensity value for each quantitative map. The MAE evaluation is also described for each white matter tract labeled in the Mori et al. (2008) brain atlas, which helps us to evaluate the intensity distortions in each white matter region.
( ) ( ) ( )
| k k |
i JHU i USP
k
D r D
MAE
N
− ∑
= (5)
Where the absolute difference (absolute error) between DJHU (DTI-JHU-81 template) and DUSP (the DTI-USP-131 template) is calculated for each k white matter tract (Mori et al., 2008) (being Nk the total number of voxels belonging to the k white matter mask). In addition, with both mean values (from DTI-JHU-81 and DTI-USP-131), it is possible to verify the statistical equivalence using a hypothesis test (two tailed one sample t-test, after Kolmogorov-Smirnov normality test). In other words, the DTI-USP-131 template is similar to DTI-JHU-81 if the null hypothesis is statistically true (assuming α=0.001).
Results
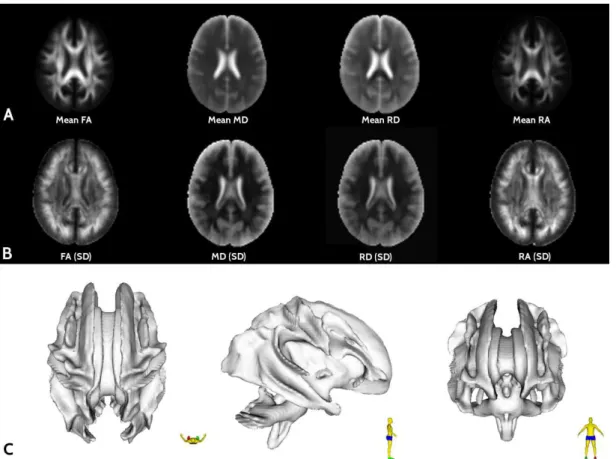
Figure 1 shows the quantitative diffusion maps obtained by DTI-USP-131, where it can be seen the registered DTI-derived maps in the ICBM space for mean and SD maps (rows A and B, respectively). The bottom
Figure 1. Illustration of each quantitative maps obtained from the aDWI data, as described in section Data Preparation. The mean (A) and standard
row of Figure 1 (C) illustrates a 3D representation of the densest iber tracts presented in the brain white matter, which is an important representation that is not provided in the ICBM T1-based templates (Evans et al., 2012).
Regarding the MAE evaluation, Figure 2 illustrates the positioning of the DTI-JHU-81 white matter atlas overlaid with our mean and SD FA map. The FA was chosen only for simplicity and the same procedure could be visualized on the other quantitative maps (i.e. MD, RA, and RD). Using the local white matter tracts information, provided by the Mori et al. (2008) atlas, it is
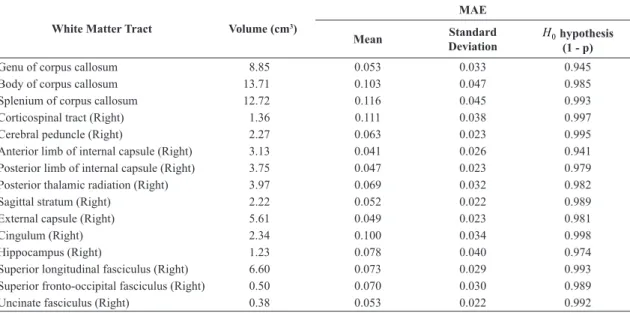
possible to calculate the local voxel intensity distortion and, with this approach, estimate the equivalence of our DTI maps in comparison with the DTI-JHU-81. Table 1 summarizes the values obtained by the MAE approach.
Discussion
Initially, a brief explanation about technical details regarding DTI-USP-131 should be discussed. As seen in DTI Data subsection, the number of samples used in DTI imaging acquisition was set to N=1 due to clinical
Figure 2. The DTI template (mean and standard deviation) with the DTI-JHU-81 atlas overlaid. In this representation is easy to see the alignment
between the previous DTI white matter tracts (from DTI-JHU-81 (Mori et al., 2008)) and our populational quantitative maps. Here, it is illustrated only the FA map, however, the same results were obtained for the MD, RA, and RD maps.
Table 1. Summary results regarding the Mean Absolute Error (MAE) for the main white matter tract given by the Mori et al. (2008). The full table
can be seen in the Supplementary data.
White Matter Tract Volume (cm3)
MAE
Mean Standard
Deviation 0
H hypothesis (1 - p)
Genu of corpus callosum 8.85 0.053 0.033 0.945
Body of corpus callosum 13.71 0.103 0.047 0.985
Splenium of corpus callosum 12.72 0.116 0.045 0.993
Corticospinal tract (Right) 1.36 0.111 0.038 0.997
Cerebral peduncle (Right) 2.27 0.063 0.023 0.995
Anterior limb of internal capsule (Right) 3.13 0.041 0.026 0.941 Posterior limb of internal capsule (Right) 3.75 0.047 0.023 0.979
Posterior thalamic radiation (Right) 3.97 0.069 0.032 0.982
Sagittal stratum (Right) 2.22 0.052 0.022 0.989
External capsule (Right) 5.61 0.049 0.023 0.981
Cingulum (Right) 2.34 0.100 0.034 0.998
Hippocampus (Right) 1.23 0.078 0.040 0.974
Superior longitudinal fasciculus (Right) 6.60 0.073 0.029 0.993 Superior fronto-occipital fasciculus (Right) 0.50 0.070 0.030 0.989
requirements. However, as notice in the original paper of Mori et al. (2008), the number of samples was set to N=3 which decrease the global image noise level by successive averaging. Hence, our DTI template was compensated with more number of samples, where additional 50 subjects were added. The reasoning for this additional number of subjects is based on the signal to noise ratio estimate in MRI acquisition, which is commonly adopted as a squared root function to N (Haacke et al., 1999), which SNRDTI JHU− −81∝81.
( )
3 ≈140.29. In order to reach an approximate image quality to DTI-JHU-81 template our dataset should get more subjects, where( )
- -131 131. 1 131
DTI USP
SNR µ = . Therefore, our DTI template showed a similar image quality than what is noticed in Mori et al. (2008) template. Even though the SNR comparison showed a slightly lower value for our DTI template, the statistical equivalence was achieved as seen in Table 1, proving that DTI-USP-131 presents the same average level than what is described in DTI-JHU-81.
As seen in the results in Figures 1 and 2, the DTI maps reconstruct here presented the same stereotaxic anatomical population characteristics as denoted in the previous brain template (DTI-JHU-81) (Hua et al., 2008; Mori et al., 2008). In more details, the results in Table 1 also afirms that the distortions presented in our DTI maps can be considered as a minimal disturbance, mainly due to the registration procedure that was adopted here. As noted, the MAE values for all the white matter tracts showed a stable estimate (MAE<0.116, p<0.001), which is in a reasonable error measure between our DTI-USP-131 template and the classical DTI-JHU-81 approach. Furthermore, all the white matter tracts, given in the DTI-JHU-81 atlas, showed a statistical equivalence (p<0.001) when our DTI template is used, which means that our approach achieved a precise brain representation. Note in Table 1 that H0 hypothesis was not refused for all the white matter tracts, proving that our DTI template maintains the same mean characteristics as the previous DTI-JHU-81 approach. Using these results, it is reasonable to use our SD maps for further statistical analysis, as seen in Figure 2.
The white matter structures that are appreciable in the DTI-USP-131 models represent reproducible structures among normal adults. Similarly to the Mori et al. (2008) approach, all prominent white matter tracts can be clearly identiied in this averaged map (Figure 1 (C)) and the usage of the previous DTI manual atlas, provided by Mori et al. (2008), can be applied to our DTI-USP-131 brain templates. In other words, the manual labels can be overlaid on our DTI template without loss of precision, as illustrated in Figure 2. It worth remembering that the ICBM-152 template is based on T1-weighted images of 152 normal volunteers and the white matter anatomical representation is
missed due to its homogeneous appearance contrast in T1 weighted images. However, while the ICBM-152 template is useful for anatomical and functional MRI studies, it does not provide detailed information about white matter anatomy. The DTI-based atlas created in this study offers complementary information about the white matter anatomy in the same standardized coordinates.
For group analysis studies, the DTI-JHU-81 provides various types of images (e.g., diffusion-weighted, non-diffusion-weighted, and FA map) (Mori et al., 2009; 2008), being useful as a template for brain normalization in the ICBM-152 coordinates. However, there is a limitation when one may need to use those maps in a statistical evaluation. In other words, the variability information was lacking in the previous Mori et al. (2008) dataset. For this reason, a complementary DTI maps were reconstructed in this study, where the populational standard deviation from healthy individuals was added in the same model presented in the DTI-JHU-81 approach. With this data format, it is possible to check the reproducibility and precision of quantitative DTI-related estimate, mainly in areas such as the uncinate fasciculus, the cingulum, a branch of the superior longitudinal fasciculus, and the subcortical white matter of the superior temporal gyrus can be clearly identiied (Mori et al., 2008). The full analysis, for each white matter tract, is given as a supplementary dataset. In addition, as seen in Figure 2, the SD map often presents higher values on the white/gray matter tissues interface, which is valuable for evaluating more reliable reports in DTI studies. It is important to understand the data luctuation and limitation for brain regions that still suffer from lack of precision in diffusion-weighted acquisition. Mori et al. (2008) was originally concerned to offer a DTI template based on the main white matter tracks in human brain, which is based on an averaged DTI signal. In general, the main contribution given by Mori et al. (2008) to the community was a set of manually delineated white matter probability masks that deine the healthy human brain connectivity. Our DTI template is focused to address complementary statistical information to the DTI-JHU-81 template, offering a variability map to each DTI scalar image, e.g. FA, ADC, RA and RD, and then opening new statistical evaluation possibilities to neuroscience studies.
patient-speciic evaluation on DTI data, which greatly improve the clinical evaluation, e.g. white matter variability in different neurodegenerative diseases, focal lesion disturbance in white matter areas, disease progression on tract-speciic evaluation, automatic lesion detection approaches that relies on voxel-space evaluation, and other applications that need a precise white matter disturbance analysis on a single subject. Some practical examples of DTI-USP-131 usage can be commented, such as the brain surgical planning where the DTI image from a single patient should be analyzed in order to ind the white matter ibers disturbance caused by the disease (Berman, 2009; Kim et al., 2013). Another application could be thought in longitudinal progression of neurodegenerative brain diseases (e.g. Multiple Sclerosis) that affects several white matter areas (Ganiler et al., 2014; Ontaneda et al., 2014).
In conclusion, complementary information for the DTI-JHU-81 template is given, where the variability (SD maps) were reconstructed for the most commonly used DTI quantitative maps, such as FA, MD, RA and RD. The proposed DTI-USP-131 template is a useful dataset for single subject evaluation, bringing more possibilities to surgical planning, neurodegenerative disease follow-up and general brain studies that rely on DTI data analysis. It worth to remembering that all the DTI maps provided here are already in the ICBM space that is useful for many statistical applications using this common space. Although there is no complementary computational toolkit offered in this study (for statistical evaluation purposes), the brain templates described here were made available on the web site (Senra and Murta, 2017), which could be valuable for future statistical evaluations in DTI-related studies.
Acknowledgements
The authors would like to thank CAPES (Coordenação de Aperfeiçoamento de Pessoal de Nível Superior) and CNPq (Conselho Nacional de Desenvolvimento Cientíico e Tecnológico - 201871/2015-7/SWE) for the grants provided.
References
Alves GS, Sudo FK, Alves CEO, Ericeira-Valente L, Moreira DM, Engelhardt E, Laks J. Diffusion tensor imaging studies in vascular disease: a review of the literature. Dementia & Neuropsychologia. 2012; 6(3):158-63. http://dx.doi.org/10.1590/ S1980-57642012DN06030008.
Andersson JLR, Sotiropoulos SN. An integrated approach to correction for off-resonance effects and subject movement in diffusion MR imaging. NeuroImage. 2016; 125:1063-78. PMid:26481672. http://dx.doi.org/10.1016/j.neuroimage.2015.10.019.
Berman J. Diffusion MR tractography as a tool for surgical planning. Magnetic Resonance Imaging Clinics of North America. 2009; 17(2):205-14. PMid:19406354. http://dx.doi. org/10.1016/j.mric.2009.02.002.
Brodmann K. Brodmann’s localisation in the cerebral cortex. Boston: Springer; 2005. https://doi.org/10.1007/b138298.
Evans AC, Janke AL, Collins DL, Baillet S. Brain templates and atlases. NeuroImage. 2012; 62(2):911-22. PMid:22248580. http://dx.doi.org/10.1016/j.neuroimage.2012.01.024.
Ganiler O, Oliver A, Diez Y, Freixenet J, Vilanova JC, Beltran B,
Ramió-Torrentà L, Rovira A, Lladó X. A subtraction pipeline for
automatic detection of new appearing multiple sclerosis lesions in longitudinal studies. Neuroradiology. 2014; 56(5):363-74. PMid:24590302. http://dx.doi.org/10.1007/s00234-014-1343-1.
Haacke EM, Brown RW, Thompson MR, Venkatesan R. Magnetic resonance imaging: physical principles and sequence design. New Jersey: Wiley; 1999.
Hua K, Zhang J, Wakana S, Jiang H, Li X, Reich DS, Calabresi
PA, Pekar JJ, van Zijl PC, Mori S. Tract probability maps in stereotaxic spaces: analyses of white matter anatomy and tract-specific quantification. NeuroImage. 2008; 39(1):336-47. PMid:17931890. http://dx.doi.org/10.1016/j. neuroimage.2007.07.053.
Inglese M, Bester M. Diffusion imaging in multiple sclerosis: research and clinical implications. NMR in Biomedicine. 2010; 23(7):865-72. PMid:20882528. http://dx.doi.org/10.1002/ nbm.1515.
Itagiba VGA, Borges R, Cruz LCH Jr, Furtado AD, Domingues RC, Gasparetto EL. Uso do tensor de difusão na avaliação dos padrões de acometimento da substância branca em pacientes
com tumores cerebrais: é uma ferramenta útil para o diagnóstico
diferencial? Radiologia Brasileira. 2010; 43(6):362-8. http:// dx.doi.org/10.1590/S0100-39842010000600006.
Jenkinson M, Beckmann CF, Behrens TEJ, Woolrich MW, Smith SM. FSL. NeuroImage. 2012; 62(2):782-90. PMid:21979382. http://dx.doi.org/10.1016/j.neuroimage.2011.09.015.
Jenkinson M, Smith S. A global optimisation method for robust affine registration of brain images. Medical Image Analysis. 2001; 5(2):143-56. PMid:11516708. http://dx.doi.org/10.1016/ S1361-8415(01)00036-6.
Kim H, Harrison A, Kankirawatana P, Rozzelle C, Blount J, Torgerson C, Knowlton R. Major white matter fiber changes in medically intractable neocortical epilepsy in children: a diffusion tensor imaging study. Epilepsy Research. 2013; 103(2-3):211-20. PMid:22917916. http://dx.doi.org/10.1016/j. eplepsyres.2012.07.017.
Klein A, Andersson J, Ardekani BA, Ashburner J, Avants B, Chiang M-C, Christensen GE, Collins DL, Gee J, Hellier P, Song JH, Jenkinson M, Lepage C, Rueckert D, Thompson P, Vercauteren T, Woods RP, Mann JJ, Parsey RV. Evaluation of 14 nonlinear deformation algorithms applied to human brain MRI registration. NeuroImage. 2009; 46(3):786-802. PMid:19195496. http://dx.doi.org/10.1016/j.neuroimage.2008.12.037.
Research. 2007; 41(1-2):15-30. PMid:16023676. http://dx.doi. org/10.1016/j.jpsychires.2005.05.005.
Mandal PK, Mahajan R, Dinov ID. Structural brain atlases: design, rationale, and applications in normal and pathological cohorts. Journal of Alzheimer’s Disease. 2012; 31(Suppl 3):S169-88. PMid:22647262.
Miraldi F, Lopes FCR, Costa JVA, Alves-Leon SV, Gasparetto EL. Diffusion tensor magnetic resonance imaging may show abnormalities in the normal-appearing cervical spinal cord from patients with multiple sclerosis. Arquivos de Neuro-Psiquiatria. 2013; 71(9A):580-3. PMid:24141435. http://
dx.doi.org/10.1590/0004-282X20130099.
Mori S, Oishi K, Faria AV. White matter atlases based on diffusion tensor imaging. Current Opinion in Neurology. 2009; 22(4):362-9. PMid:19571751. http://dx.doi.org/10.1097/ WCO.0b013e32832d954b.
Mori S, Oishi K, Jiang H, Jiang L, Li X, Akhter K, Hua K,
Faria AV, Mahmood A, Woods R, Toga AW, Pike GB, Neto PR, Evans A, Zhang J, Huang H, Miller MI, Zijl P van, Mazziotta J. Stereotaxic white matter atlas based on diffusion tensor imaging in an ICBM template. NeuroImage. 2008; 40(2):570-82. PMid:18255316. http://dx.doi.org/10.1016/j. neuroimage.2007.12.035.
Oishi K, Faria A, Jiang H, Li X, Akhter K, Zhang J, Hsu
JT, Miller MI, Zijl PC van, Albert M, Lyketsos CG, Woods R, Toga AW, Pike GB, Rosa-Neto P, Evans A, Mazziotta J, Mori S. Atlas-based whole brain white matter analysis using large deformation diffeomorphic metric mapping: Application to normal elderly and Alzheimer’s disease participants.
NeuroImage. 2009; 46(2):486-99. PMid:19385016. http:// dx.doi.org/10.1016/j.neuroimage.2009.01.002.
Ontaneda D, Sakaie K, Lin J, Wang X, Lowe MJ, Phillips
MD, Fox RJ. Identifying the start of multiple sclerosis injury: a Serial DTI study. Journal of Neuroimaging. 2014; 24(6):569-76. PMid:25370339. http://dx.doi.org/10.1111/jon.12082.
Pujol S, Wells W, Pierpaoli C, Brun C, Gee J, Cheng G, Vemuri B, Commowick O, Prima S, Stamm A, Goubran M, Khan A, Peters T, Neher P, Maier-Hein KH, Shi Y, Tristan-Vega A, Veni G, Whitaker R, Styner M, Westin CF, Gouttard S, Norton I, Chauvin L, Mamata H, Gerig G, Nabavi A, Golby A, Kikinis R. The DTI challenge: toward standardized evaluation of diffusion tensor imaging tractography for neurosurgery. Journal of Neuroimaging. 2015; 25(6):875-82. PMid:26259925. http:// dx.doi.org/10.1111/jon.12283.
Qiu A, Mori S, Miller MI. Diffusion tensor Imaging for understanding brain development in early life. Annual Review of Psychology. 2015; 66(1):853-76. PMid:25559117. http:// dx.doi.org/10.1146/annurev-psych-010814-015340.
Rittner L, Freitas PF, Appenzeller S, Lotufo RA. Automatic DTI-based parcellation of the corpus callosum through the watershed transform. Revista Brasileira de Engenharia Biomédica. 2014; 30(2):132-43. http://dx.doi.org/10.1590/ rbeb.2014.012.
Senra ACS Fo, Murta LO Jr. Populational Diffusion Tensor Imaging Statistical Maps Version 1 [internet]. Mendeley; 2017. [cited 2017 June 08]. Available from: http://dx.doi. org/10.17632/br7bhs4h7m.1
Shenton ME, Hamoda HM, Schneiderman JS, Bouix S, Pasternak O, Rathi Y, Vu MA, Purohit MP, Helmer K, Koerte I, Lin AP, Westin CF, Kikinis R, Kubicki M, Stern RA, Zafonte R. A review of magnetic resonance imaging and diffusion tensor imaging findings in mild traumatic brain injury. Brain Imaging and Behavior. 2012; 6(2):137-92. PMid:22438191. http://dx.doi.org/10.1007/s11682-012-9156-5.
Smith SM, Jenkinson M, Johansen-Berg H, Rueckert D, Nichols TE, Mackay CE, Watkins KE, Ciccarelli O, Cader MZ, Matthews PM, Behrens TE. Tract-based spatial statistics: voxelwise analysis of multi-subject diffusion data. NeuroImage. 2006; 31(4):1487-505. PMid:16624579. http://dx.doi.org/10.1016/j. neuroimage.2006.02.024.
Smith SM, Jenkinson M, Woolrich MW, Beckmann CF, Behrens TEJ, Johansen-Berg H, Bannister PR, Luca M, Drobnjak I, Flitney DE, Niazy RK, Saunders J, Vickers J, Zhang Y, Stefano N, Brady JM, Matthews PM. Advances in functional and structural MR image analysis and implementation as FSL.
NeuroImage. 2004; 23(Suppl 1):S208-19. PMid:15501092. http://dx.doi.org/10.1016/j.neuroimage.2004.07.051.
Sotiras A, Davatzikos C, Paragios N. Deformable medical image registration: a survey. IEEE Transactions on Medical Imaging. 2013; 32(7):1153-90. PMid:23739795. http://dx.doi. org/10.1109/TMI.2013.2265603.
Strotzer M. One century of brain mapping using Brodmann areas.
Clinical Neuroradiology. 2009; 19(3):179-86. PMid:19727583. http://dx.doi.org/10.1007/s00062-009-9002-3.
Talairach J. Co-planar stereotaxic atlas of the human brain: 3-D proportional system: an approach to cerebral imaging. Thieme: New York; 1988.
Thottakara P, Lazar M, Johnson SC, Alexander AL. Application of Brodmann’s area templates for ROI selection in white matter tractography studies. NeuroImage. 2006; 29(3):868-78. PMid:16243544. http://dx.doi.org/10.1016/j. neuroimage.2005.08.051.
Zhang H, Awate SP, Das SR, Woo JH, Melhem ER, Gee JC, Yushkevich PA. A tract-specific framework for white matter morphometry combining macroscopic and microscopic tract features. Medical Image Analysis. 2010; 14(5):666-73. PMid:20547469. http://dx.doi.org/10.1016/j.media.2010.05.002.
Zhang S, Peng H, Dawe RJ, Arfanakis K. Enhanced ICBM diffusion tensor template of the human brain. NeuroImage. 2011; 54(2):974-84. PMid:20851772. http://dx.doi.org/10.1016/j. neuroimage.2010.09.008.