and Endangered Taxon of Gala´pagos Tortoise
Ylenia Chiari1,5.*, Chaz Hyseni1., Tom H. Fritts2
, Scott Glaberman1, Cruz Marquez3, James P. Gibbs4, Julien Claude5, Adalgisa Caccone1
1Department of Ecology and Evolutionary Biology and YIBS-Molecular Systematics and Conservation Genetics Lab, Yale University, New Haven, Connecticut, United States of America,2Museum of Southwestern Biology, University of New Mexico, Albuquerque, New Mexico, United States of America,3Postal del Parque Nacional Gala´pagos, Gala´pagos, Ecuador,4College of Environmental Science and Forestry, State University of New York, Syracuse, New York, United States of America,5Institut des Sciences de l’Evolution, CNRS-UMR, Universite´ Montpellier 2, Montpellier, France
Abstract
Gala´pagos tortoises represent the only surviving lineage of giant tortoises that exhibit two different types of shell morphology. The taxonomy of Gala´pagos tortoises was initially based mainly on diagnostic morphological characters of the shell, but has been clarified by molecular studies indicating that most islands harbor monophyletic lineages, with the exception of Isabela and Santa Cruz. On Santa Cruz there is strong genetic differentiation between the two tortoise populations (Cerro Fatal and La Reserva) exhibiting domed shell morphology. Here we integrate nuclear microsatellite and mitochondrial data with statistical analyses of shell shape morphology to evaluate whether the genetic distinction and variability of the two domed tortoise populations is paralleled by differences in shell shape. Based on our results, morphometric analyses support the genetic distinction of the two populations and also reveal that the level of genetic variation is associated with morphological shell shape variation in both populations. The Cerro Fatal population possesses lower levels of morphological and genetic variation compared to the La Reserva population. Because the turtle shell is a complex heritable trait, our results suggest that, for the Cerro Fatal population, non-neutral loci have probably experienced a parallel decrease in variability as that observed for the genetic data.
Citation:Chiari Y, Hyseni C, Fritts TH, Glaberman S, Marquez C, et al. (2009) Morphometrics Parallel Genetics in a Newly Discovered and Endangered Taxon of Gala´pagos Tortoise. PLoS ONE 4(7): e6272. doi:10.1371/journal.pone.0006272
Editor:Neil John Gemmell, University of Otago, New Zealand
ReceivedJanuary 9, 2009;AcceptedJune 7, 2009;PublishedJuly 17, 2009
Copyright:ß2009 Chiari et al. This is an open-access article distributed under the terms of the Creative Commons Attribution License, which permits unrestricted use, distribution, and reproduction in any medium, provided the original author and source are credited.
Funding:Field work has been supported by a grant of the National Geographic Society (grant number 8017-06). Laboratory work has been supported by YIBS-Ecosave funds. Ylenia Chiari was partly supported by a fellowship of the University of Montpellier 2. The funders had no role in study design, data collection and analysis, decision to publish, or preparation of the manuscript.
Competing Interests:The authors have declared that no competing interests exist. * E-mail: [email protected]
.These authors contributed equally to this work.
Introduction
Conservation biologists rely on systematics to properly recog-nize taxonomic units in order to protect them (e.g., [1]). Since the time of Linnaeus, taxonomic classification has largely been based on morphological characters. However, morphology alone can sometimes be misleading. High intraspecific phenotypic variation can be mistaken as evidence of multiple species (e.g., [2]), while legitimately separate species can be improperly combined due to similarities in morphology (e.g., [3]). The integration of morpho-logical and genetic information has increasingly been used to resolve such uncertainties.
Perhaps equally as important, combining different types of data can also make it possible to indirectly infer the vulnerability of a population facing environmental disturbance. Genetic and/or phenotypic variation can reflect the capacity of a population to respond to different types and levels of stress since it is the raw material upon which adaptation can take place (e.g., [4]). However, conservation measures based on genetic data frequently reflect the analysis of genetic markers that are not necessary subject to natural selection [5]. In addition, phenotypic variation does not always reflect the observed genetic diversity of a population. This is due to the lack of association between the
genes analyzed and traits that are easily measurable (reviewed in [6]), and to the fact that phenotypic variation is partly under the control of non-additive genetic variation. Thus, while neutral markers may serve as one measure of the genetic impact of stress on a population (e.g., low genetic variation, bottleneck), the examination of phenotypic traits that show high heritability could be used as a proxy to evaluate the level of genetic variation at non-neutral loci within a population.
Gala´pagos tortoises are an emblematic and important taxon about which little is currently known and thus additional work is greatly required. These animals are in various stages of endangerment [7,8], and they possess numerous characteristics that are often associated with greater risk of extinction [9,10], including island endemism, slow growth rate, late sexual maturity, and large body size. The distinctiveness of extant Gala´pagos tortoise lineages (11 currently recognized taxa inhabiting six islands) was initially based mostly on diagnostic morphological characters of the shell [11]. More recently, molecular studies revealed that each island harbors a distinct monophyletic lineage, with the exception of Isabela and Santa Cruz, where multiple lineages have been documented [3,12,13,14,15].
consequence, the range of tortoises on the island has been reduced. Only a single taxon (Geochelone nigra porteriorG. porteri, but see also [16]) is currently recognized on the island; however, three genetically distinct tortoise lineages have been shown to inhabit Santa Cruz [3,14]. Each of these three lineages has a sister taxon on nearby islands from which they are genetically highly divergent at the mitochondrial and nuclear level [12,13]. Two of these lineages exhibit a general domed morphology, while the third, which is probably composed of only a few individuals at present, possesses the saddleback morphology (see [17] for a description of the domed and saddleback morphologies). The two domed tortoise popula-tions, referred to as La Reserva and Cerro Fatal, differ in their geographic distribution, population size, and level of genetic diversity [3,7,14]. Despite a lack of visible morphological differen-tiation, the two domed lineages are as genetically distinct from each other as from tortoises occurring on other islands. In fact, they occupy clades that are reciprocally monophyletic and linked to each other through the deepest node of the Gala´pagos tortoise phylogeny [3]. While the La Reserva population harbors one of the largest tortoise population in the archipelago (ca. 2000–3000 individuals), the Cerro Fatal population has a much smaller population size and recently experienced a strong population decline due to human habitat disturbance and heavy poaching. Only about 100 individuals were estimated to have existed in 1974 [7], and this is likely the cause of the dramatically low levels of genetic diversity at mitochondrial and nuclear microsatellite loci that are currently found in this population [3].
In turtles, genetic and morphometric data have often been combined to resolve taxonomic uncertainties (e.g., [18,19,20]). The first objective of the current study is to integrate the two types of data in order to evaluate whether the genetic distinctiveness of the two domed Santa Cruz tortoise populations is also paralleled by morphological differences in shell shape. Corroborative data could provide broader and more comprehensive support for the distinctiveness of the two domed populations on the island. We also investigate whether genetic variation at neutral loci is correlated with morphological variation within each population in order to test whether Cerro Fatal lost genetic variation underlying quantitative traits as well. Here, we integrate nuclear and mitochondrial data with statistical analysis of shell shape morphology using linear and curved measurements. We chose to focus on shell variation because measurements can be precisely collected on this structure and because of its complexity as a morphological trait, resulting from the interaction of many genes [21].
Results
Morphometrics
Table 1 shows the different mean size for each populations and sex. The two populations differed in mean size and mean shape
(Pop as factor, Table 2 and Table 3). Within the two populations, the sexes were dimorphic in size and mean shape, but since the interactions (Sex x Pop) were not statistically significant, sexual dimorphism is expressed in a similar way in both populations (Table 2 and Table 3). Populations did not differ in their allometric coefficient (for allometric coefficient see [22]) (Log(size) x Pop, Table 4), however they differed in mean shape (Pop, Table 4). This means that shape differences between populations are preserved and correspond to different shape proportions during growth. Conversely, sexes showed differences in allometric coefficients (Log(size) x Sex, Table 4) and were found to be similar in mean shape once allometry was filtered out (Sex, Table 4). This means that differences between males and females accumulate during growth, with males having higher values of allometric coefficients than females (data not shown).
Table 1.Mean size.
Population Sex Sample size Mean geometric size (mm) Standard deviation
Cerro Fatal 32 257.5022 59.00279
Males 17 290.2313 50.09574
Females 15 220.4093 45.44959
La Reserva 49 286.6327 64.06705
Males 21 325.1621 73.22504
Females 28 257.7357 36.12028
Mean size of tortoises from La Reserva and Cerro Fatal populations when grouped by population and sex. doi:10.1371/journal.pone.0006272.t001
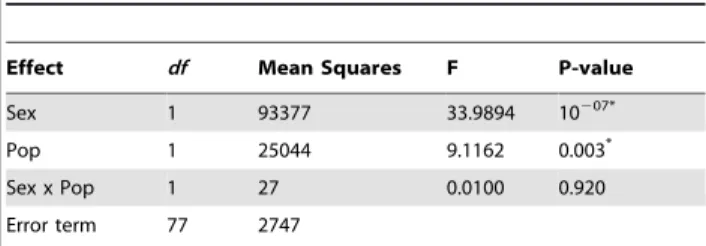
Table 2.ANOVA on mean size differences.
Effect df Mean Squares F P-value
Sex 1 93377 33.9894 10207*
Pop 1 25044 9.1162 0.003*
Sex x Pop 1 27 0.0100 0.920
Error term 77 2747
Mean size distinction between tortoises from La Reserva and Cerro Fatal populations. Two-way ANOVA on size with population (Pop) and sex (Sex) as factors.
*indicates significant p-value (p ,0.05).
x indicates the interaction between factors.df= degree of freedom. doi:10.1371/journal.pone.0006272.t002
Table 3.Shell shape differences.
Effect df
Hotelling-Lawley trace
Approx
F dfnum dfden P-value
Sex 1 1.1296 2.2592 26 52 0.006*
Pop 1 3.1474 6.2948 26 52 10208*
Sex x Pop 1 0.5851 1.1701 26 52 0.308
Error term 77
Shell shape distinction between tortoises from La Reserva and Cerro Fatal populations. Two-way MANOVA on shape variables with population (Pop) and sex (Sex) as factors.
*indicates significant p-value (p ,0.05).
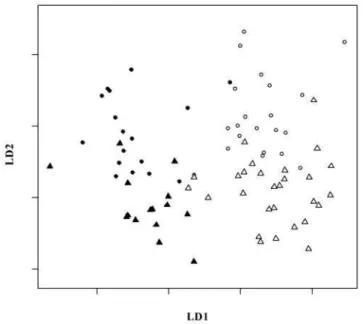
Figure 1 shows the results of the linear discriminant analysis. The two populations and sexes separate along the first and second discriminant axes, respectively. The percentage of discriminant power associated with the first axis was 66%, while the one associated with the second axis was 22%. Tortoises from La Reserva had a slightly flatter and more elongated carapace with a slightly higher anterior opening, thus exhibiting a slight tendency toward a saddleback morphology compared to tortoises from Cerro Fatal. Moreover, the sexual dimorphism was characterized by the females of each population being less domed and with slightly longer and wider carapaces than males (table of discriminant coefficients not shown).
Table 5 shows the estimated size and shape variation of tortoises from the La Reserva and Cerro Fatal populations (Table 5). La Reserva tortoises have larger variation in size and shape compared to the Cerro Fatal population (Table 5). The difference in size
variation between the two populations was not statistically significant (Table 6). The difference in shape variation between both populations was not statistically significant (Table 7), but became significant once variation due to allometric growth was removed (Table 8). This suggests that the differences in shape variation between populations were not due to sampling from different growth stages in each population. In both populations, males varied more in size and shape than females (Table 5), but differences in size variation between sexes within each population were significant only for the La Reserva population (Table 6). Differences in shape variation between sexes were significant within each population (Table 7), but were not statistically significant once variation due to allometry was removed (Table 8). This indicates that differences in raw shape variation between sexes are probably due to allometric differences between males and females and to the different growth stage of the individuals sampled for each sex. The fact that shell variation was better explained by growth for males than for females (Cerro Fatal 42% in males and 17% in females; La Reserva 29% in males and 8% in females) further supports this conclusion.
Genetics
The newly collected microsatellite data were combined with the ones from 136 individuals previously analyzed at the same loci [3,13,14], resulting in a total of 236 individuals available for microsatellite analysis (115 from Cerro Fatal and 121 from La Reserva). Out of the 100 new DNA samples that were collected, mtDNA sequence data for the control region (690 bp) was obtained for 96 individuals. These data were combined with the previously available 128 sequences for the same marker (65 from Cerro Fatal and 63 from La Reserva; [3,14]) for a total of 224 individuals available for mitochondrial analysis.
Levels of microsatellite variability were substantially higher in the La Reserva population than in the Cerro Fatal population (Table 9). The highest number of alleles at a single locus was 32 in La Reserva compared to only nine in Cerro Fatal. The mean number of alleles across all nine loci was 17.2 and 5.3 in La Reserva and Cerro Fatal, respectively, while mean expected heterozygosity (HE) was 0.81 and 0.58 in the two populations,
respectively. Departure from Hardy-Weinberg equilibrium was observed for seven of the nine loci in the La Reserva and six loci in the Cerro Fatal population (p,0.05; four and five respectively after Bonferroni correction for multiple tests). In La Reserva, this departure from Hardy-Weinberg equilibrium is due to heterozy-gote deficiency (six loci, p,0.05; four after Bonferroni correction);
Table 4.Shell shape differences once allometric growth is removed.
Effect df Hotelling-Lawley trace Approx F dfnum dfden P-value
Sex 1 0.9947 2.2057 23 51 0.107
Pop 1 3.1485 6.9815 23 51 2610208*
Log(size) x Pop 1 0.6343 1.4065 23 51 0.052
Log(size) x Sex 1 0.6.744 1.4954 23 51 0.038*
Sex x Pop 1 0.4950 1.0977 23 51 0.380
Log(size) x Pop x Size 1 0.4034 0.8944 23 51 0.604
Error term 73
Shell shape distinction between tortoises from La Reserva and Cerro Fatal populations once allometric growth is filtered out. Multivariate analysis of covariance taking into account Log(size) as covariate, and sex (Sex) and population (Pop) as factors.
*indicates significant p-value (p ,0.05).
x indicates the interaction between factors.df= degree of freedom.dfnum = degree of freedom numerator.dfden = degree of freedom denominator. doi:10.1371/journal.pone.0006272.t004
Figure 1. Graph of the linear discriminant analysis. Linear discriminant analysis along the first and second discriminant axes (LD1 and LD2, respectively). LD1 and LD2 account for 66% and 22% discriminant power, respectively. Black circles = Cerro Fatal males. White circles = La Reserva males. Black triangles = Cerro Fatal females. White triangles = La Reserva females.
in Cerro Fatal heterozygote excess was recorded for three loci (p,0.05; one after Bonferroni correction). Linkage disequilibrium was detected in both populations indicating a non-random association between loci in 10 pairwise comparisons in La Reserva and 29 in Cerro Fatal (p,0.05). The sequential Bonferroni corrections within populations reduced the number of significant non-random associations to one for La Reserva and 16 for Cerro Fatal.
When individuals were assigned to populations to define their ancestry, the analysis delimits two clusters in the dataset (most likely value of K= 2). More than 90% of the tortoises in both
populations were correctly assigned to their original population. Individuals sampled in Cerro Fatal were assigned to their cluster with an average proportion of membership of 0.99, while for La Reserva the coefficient was 0.96. Additionally this analysis detected seven individuals of potential mixed origin between these two populations.
The 224 mtDNA sequences resulted in 26 distinct haplotypes. Twenty-one haplotypes were found in La Reserva, while the other five haplotypes were found in Cerro Fatal. The Cerro Fatal and La Reserva haplotypes grouped into two highly distinct haplotype networks, separated by 28 mutational steps (Figure S1, supporting
Table 5.Size and shape variation.
Population Sex Size variation Shape variation Shape variation (no allometric growth)
Cerro Fatal 3481.329 0.125 0.092
Males 2509.583 0.135 0.083
Females 2065.665 0.086 0.081
La Reserva 4104.587 0.139 0.120
Males 5361.906 0.167 0.123
Females 1304.674 0.109 0.109
Total level of variation in size, shape, and shape with allometric growth filtered out for tortoises from La Reserva and Cerro Fatal populations grouped by population and sex.
doi:10.1371/journal.pone.0006272.t005
Table 6.Size variation differences.
Comparisons Var. obs Sample size 1 Sample size 2 P-value
Cerro Fatal vs La Reserva 1.179 32 49 0.271
Cerro Fatal M vs F 1.2149 17 15 0.307
La Reserva M vs F 4.1098 21 28 0.000*
Cerro Fatal M vs La Reserva M 2.1366 17 21 0.008*
Cerro Fatal M vs La Reserva F 1.9235 17 28 0.053
Cerro Fatal F vs La Reserva F 1.5833 15 28 0.086
Cerro Fatal F vs La Reserva M 2.5957 15 21 7610204*
Exact test on the level of size variation between the different studied groups (tortoises organized by population and sex). *indicates significant p-value (p
,0.05).
M = males. F = females. Var. obs. = observed variance. ‘‘Sample size 1’’ and ‘‘Sample size 2’’ refer to the order of the comparison (first columns on the left of the table). doi:10.1371/journal.pone.0006272.t006
Table 7.Shape variation differences.
Comparisons Var. obs. Sample Size 1 Sample size 2 P-value
Cerro Fatal vs La Reserva 1.112109 32 49 0.185
Cerro Fatal M vs F 1.568833 17 15 0.043*
La Reserva M vs F 1.529417 21 28 0.001*
Cerro Fatal M vs La Reserva M 1.238719 17 21 0.060
Cerro Fatal M vs La Reserva F 1.234676 17 28 0.101
Cerro Fatal F vs La Reserva F 1.270643 15 28 0.034*
Cerro Fatal F vs La Reserva M 1.943343 15 21 1024*
Exact test on the level of shape variation between the different studied groups (tortoises organized by population and sex). *indicates significant p-value (p
,0.05).
information). However, one haplotype, connected to the rest of the Cerro Fatal haplotype network by five mutations, belonged to an individual sampled in La Reserva (Figure S1, supporting information). The Cerro Fatal haplotype network is dominated by one major haplotype presents at a frequency of 83%. Genetic diversity at the mitochondrial level in La Reserva, on the other hand, was more structured, with only a few of the 21 haplotypes found at a frequency higher than 5%. The tortoises in the two populations also differed considerably in levels of mitochondrial haplotype diversity, h (Cerro Fatal = 0.30, La Reserva = 0.85, Table 10). The AMOVA of the control region sequences revealed that most of the variation (90%) is due to between-population differences (within population difference only 10%, p,0.0001). The existence of strong genetic differentiation between the two populations was confirmed by mitochondrial and microsatellite fixation indices (FST= 0.897 and h= 0.148, respectively,
p,0.0001).
Discussion
The shell morphometric analyses parallel the genetic distinc-tiveness found between the two Gala´pagos tortoise populations on Santa Cruz. The two populations differ in size (Table 1 and Table 2), with the tortoises from La Reserva being bigger than those from Cerro Fatal. Shape also differed (Table 3), with tortoises from Cerro Fatal being slightly more domed than tortoises from La Reserva (data not shown). Moreover, differences in shape between populations are not related to different allometric growth patterns (Table 4), meaning that if the populations were sampled at the same growth stage they would still differ in their shell shape. A combination of morphometric variables from the plastron and carapace were able to discriminate between the two populations as well as between sexes (Figure 1).
Mitochondrial and nuclear data show that the two Gala´pagos tortoise populations on Santa Cruz are highly distinct, despite a few individuals being identified as hybrids. Species recognition and range boundaries are difficult to recognize in rapidly speciating taxa (as reviewed in [23]), mainly due to hybridization and rapid morphological divergence. Thus, the prevailing question requiring further deliberation is whether the two studied populations represent distinct species or reflect adaptive variation within the same species and hence separate units under the adaptive evolutionary concept (ACE, [24]; see discussion in [25] for a background on evolutionary units and species concepts). A hybrid zone between the two populations is currently not known. Moreover, hybridization occurs at low rates in the wild and in captivity in Gala´pagos tortoises when individuals of distinct ancestry meet (e.g., [26]). Our results show that individuals of mixed origin between the two populations are rare (only 3% of all sampled individuals), possibly resulting from the migration and consequent hybridization of a very small set of individuals between
Table 8.Shape variation differences once allometric growth is removed.
Comparisons Var. obs. Sample size 1 Sample size 2 P-value
Cerro Fatal vs La Reserva 1.298232 32 49 0.013*
Cerro Fatal M vs F 1.025196 17 15 0.449
La Reserva M vs F 1.122052 21 28 0.216
Cerro Fatal M vs La Reserva M 1.482422 17 21 0.021*
Cerro Fatal M vs La Reserva F 1.321171 17 28 0.039*
Cerro Fatal F vs La Reserva F 1.354460 15 28 0.026*
Cerro Fatal F vs La Reserva M 1.519774 15 21 0.015*
Exact test on the level of shape variation between the different studied groups (tortoises organized by population and sex) once allometric growth is filtered out. *indicates significant p-value (p
,0.05).
M = males. F = females. Var. obs. = observed variance. ‘‘Sample size 1’’ and ‘‘Sample size 2’’ refer to the order of the comparison (first columns on the left of the table). doi:10.1371/journal.pone.0006272.t008
Table 9.Genetic diversity based on nine microsatellite loci.
Microsatellites
Population N N. of Loci N. of alleles HE HO
Cerro Fatal 115 9 Mean6SD 5.3362.55 0.5860.15 0.6160.17
La Reserva 121 9 Mean6SD 17.2269.76 0.8160.16 0.7560.17
Measures of genetic diversity for the Cerro Fatal and La Reserva Gala´pagos tortoise populations based on nine microsatellite loci. N = number of individuals analyzed. HE= expected heterozygosity. HO= observed heterozygosity. SD = standard deviation.
doi:10.1371/journal.pone.0006272.t009
Table 10.Genetic diversity based on the mitochondrial control region.
Mitochondrial DNA
Population N
N. of
haplotypes H
Cerro Fatal 107 5 Mean6SD 0.3060.05 La Reserva 117 21 Mean6SD 0.8560.02
Measures of genetic diversity for the Cerro Fatal and La Reserva Gala´pagos tortoise populations based on a 690 bp fragment of the mtDNA control region. N = number of individuals analyzed.h= haplotypic diversity. SD = standard deviation.
populations or the greater proximity of the taxa’s historical ranges (prior to current settlement of the agricultural zone between them that likely extirpated tortoises from the area). Whatever the case, nuclear and mitochondrial genetic distances between the two populations are comparable to the genetic distances existing among recognized distinct lineages of Gala´pagos tortoises (see [12] for mitochondrial absolute distances and [13] for microsatellite distances).
Neither shell morphology (saddleback and domed) nor island of origin are reliable for distinguishing among taxa of Gala´pagos tortoises. For example, domed and saddleback shell forms seem to have evolved multiple times in the archipelago [27]. In the same way, based on recent data, distinct evolutionary lineages exist on the same island (as in Santa Cruz and Isabela, [3,12,13,14,15]). However, the current taxonomy of the group remains a source of debate, with distinct lineages indicated either as one species or distinct species or subspecies (e.g., [27,28,29,30]). The two Gala´pagos tortoise populations on the island of Santa Cruz are currently described as one single species due to their similar shell morphologies (both domed) and the fact that they occur on the same island. However, genetic distances at nuclear and mito-chondrial levels, as well as morphological differences, indicate the existence of two separate evolutionary lineages on this island. In particular, the genetic distances between the two populations are comparable to the ones of separate evolutionary lineages inhabiting different islands (and indicated as separate species in [27]). Thus, the two populations represent at least distinct evolutionary and conservation units under the adaptive evolution-ary concept, which is a more integrated and flexible concept than the ESU [31,32], taking into account not only genetic distances at mitochondrial and nuclear markers, but also other differences characteristic of each evolutionary unit (e.g., shell morphology). Our results further support the need for taxonomic revision of Gala´pagos tortoises based on the integration of different datasets (genetic diversity and shell morphology differences within and among lineages) that have yet to be generated.
Our results additionally suggest that the amount of variation in shell shape is different in these two populations, which also parallels the genetic diversity results. Cerro Fatal shows hetero-zygote excess, high levels of linkage disequilibrium (both of which can be explained by a past bottleneck), and much less genetic variability overall at mitochondrial and nuclear loci than the La Reserva population (Table 9 and Table 10 and [3,13,14]). The low genetic diversity observed in Cerro Fatal tortoises has been suggested to have resulted from the more recent founding of this population by migrants from another island, San Cristo´bal [3,12], and a population size reduction due to human disturbance [7]. On the other hand, the La Reserva population is one of the largest and most genetically diverse tortoise populations in the Gala´pagos [3,13,14].
The tortoise shell is a complex polygenic morphological trait (reviewed in [21]) that serves a variety of functions besides providing physical protection. It is important for animal self-righting [33], thermoregulation, locomotor performance [34], physiological functions such as serving as a reservoir for water, fat and wastes, and successful mating and reproduction. Thus, the tortoise shell is considered to be an important trait for individual survivorship and fitness. Myers and colleagues [35] found plastron shape variation to be highly heritable (see Table 1 [35] for heritability values), suggesting a similar heritable genetic compo-nent also for the shell. Based on this, our study suggests that non-neutral genes such as the ones involved in shell development likely also experienced a decrease in variability, as did neutral
(mitochondrial control region and microsatellites) markers in the Cerro Fatal population in comparison to La Reserva.
Although the parallel genetic and morphological patterns implicate demography as a primary force in shaping both neutral and non-neutral genes frequencies, past studies have revealed a complex relationship between neutral markers and morphological characters in other recently diverged organisms (e.g., Darwin’s finches, [36,37]; sticklebacks, [38,39]; cichlids, [40,41]). These studies suggest that selection and plasticity may also play a role in shaping phenotypic variation and differentiation, and we therefore must consider them in the interpretation of the data. For example, in our study, while the parallel between genetic and shell shape variation between these two lineages can be explained by the different demographic histories of the two populations, the larger difference in genetic variation compared to morphological shell shape variation observed between La Reserva and Cerro Fatal tortoises (ratio of three-four times for genetics, depending if we consider the number of alleles/haplotypes or the haplotype diversity, vs. a ratio of 1.3 times for shell shape variation) requires some additional explanation. A slower rate of morphological evolution compared to molecular evolution could explain the observed pattern (but see below). However, the lack of knowledge about the amount of variation at quantitative traits involved in shell morphology, the heritability of these traits, and the influence of plasticity are all factors that impede our ability to further explore the imperfect parallelism between morphological and genetic variation. For example, it is known that diverse movement patterns and environmental diversity are known to cause dissimilarity in shell shape in other chelonians (e.g., [42,43]). Therefore, phenotypic plasticity could explain why the relation-ship between neutral genes and morphology is not linear.
Natural selection may also be acting on shell morphology and may explain why the genetic divergence between the two Santa Cruz populations is much more pronounced than for morphology. If we assume that both populations are derived from a domed shell ancestor, then it would seem that stabilizing selection is acting on genes underlying shell shape. In fact, mitochondrial phylogenetic trees indicate that the two highly divergent carapace morphologies (saddleback and domed) evolved multiple times in the archipelago (e.g., [3,12,27]), suggesting that highly divergent shell forms could have evolved between these two populations. The large genetic divergence between the two Santa Cruz populations is in line with the timeframe in which saddleback morphology has arisen in other tortoise populations. Therefore stabilizing selection rather than a slower rate of shell evolution is more plausible. On the other hand, if either or both of the populations derive from a saddleback ancestor, then strong positive selection and convergence would have to have occurred to result in two similarly domed populations. However, the current phylogenetic data available are insufficient to hypothesize the ancestral morphology of each lineage to distinguish among the different scenarios analyzed above.
strongly affected by allometric growth (Table 4 and Table 8). In fact, once variation due to allometric effects is removed, shape differences between females and males of the same population disappear, indicating that these differences could be explained by the different growth stage (probably older) of males compared to females.
Based on our data, the two domed tortoise populations of Santa Cruz are genetically and morphologically distinct. The recognition of a separate taxon for the Cerro Fatal population is of primary importance for conservation and would reflect our current understanding of the evolutionary history of this group. The number of surviving individuals is low although not well defined. As our data suggest, the size and mean shape of this population, as well as the level of quantitative variation (using the shell as a proxy of a quantitative trait), parallel the extremely low genetic diversity at neutral loci, indicating a possibly reduced potential to respond to environmental disturbance.
Additional ecological and behavioral data on these populations, as well as applying a combination of morphometric and genetic analyses to other turtle populations would help to further our understanding of the relationship between shell shape variation and genetic diversity at neutral loci. Moreover, since the Cerro Fatal population is small and contains relatively few reproducing individuals producing most of the recruits, it may offer a rare opportunity to establish pedigrees in order to better understand how shell shape variation is heritable. This would offer insights into the evolution of Gala´pagos tortoises and their shell forms, as well as improve conservation efforts. If shell shape variation would prove to be highly heritable, then quantifying additive genetic variation could be used to identify especially endangered populations of Gala´pagos tortoises with direct implications for the management of these animals.
Materials and Methods
Ethics Statement
Animal procedures were carried out in this study following the ethics guidelines on animal handling as required by Yale University.
Sampling
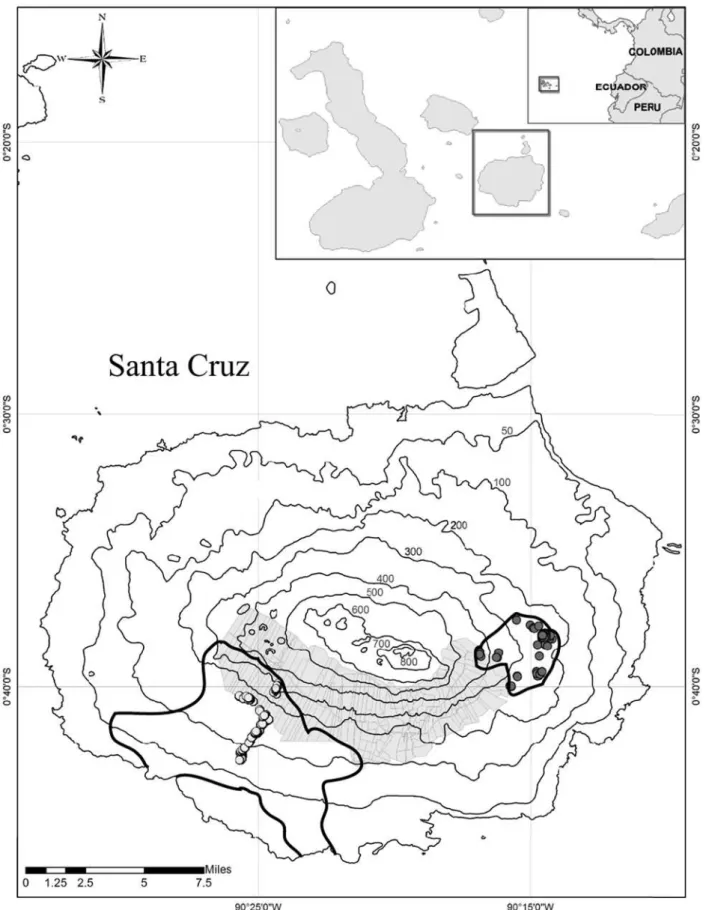
Fieldwork was carried out in August 2006 on Santa Cruz Island in the Gala´pagos archipelago (Figure 2). We sampled a total of 122 Gala´pagos tortoises (64 and 58 from the Cerro Fatal and La Reserva populations respectively) in the known distribution areas of adult individuals of the two lineages. The two populations are endemic to the island of Santa Cruz and do not overlap in their distribution areas, which are currently separated by agricultural zones (Figure 2). Within the larger distribution area of the La Reserva population, preliminary data show that male tortoises occur in different areas depending on the two different seasons (hot, from December to May and cold, from June to November) [44]. The lower altitudinal range of the distribution area of La Reserva (Figure 2) is mostly occupied by juveniles [44] and it was not sampled in our study. Both populations occur and traverse very similar ecological gradients, from low, hot and dry environments to high, cool and moist ones (pers. obs.).
Geographic coordinates and elevation above sea level were recorded for each sampled individual and its sex was determined based on external features (concave plastron and characteristics of the anal scutes and the tail for males) as described in [11]. Morphological measurements and blood samples for genetic analysis were collected from individual animals, which were subsequently released. Blood was sampled only from animals that
had not been previously sampled for blood in other expeditions. This resulted in a total of 100 total individuals; 45 of which were from Cerro Fatal and 55 from La Reserva. Since all sampled animals were marked with identification tags, each sample is known to represent a distinct individual. Blood samples were collected and preserved in a solution of 0.1 M Tris buffer, 0.1 M EDTA, and 2% SDS at pH 8.0 and were kept at room temperature for the duration of the field trip (four weeks) and subsequently stored at280uC.
Morphometrics
Measurements of 26 characters from the shell (Figure 3 and Supporting Information S1) were obtained using tree and smaller dial calipers (resolution 1.0 mm and 0.1 mm, respectively) and a flexible tape ruler (resolution 1.0 mm) for straight and curved measurements, respectively (measurements available upon request to the authors). In our analyses, we included only sexually mature individuals with a curved carapace length measuring 580 mm and above (CL, Supporting Information S1). Individuals with major injuries or shell deformities were excluded from analyses. Seven individuals of mixed origin were removed from the morphometric analyses. The final dataset consisted of a total of 32 individuals (17 males and 15 females) from the Cerro Fatal population and 49 individuals (21 males and 28 females) from La Reserva.
All morphometric analyses were run in the R environment [45] following the general framework of Claude [46]. Since the goal of morphometric analyses is to deconstruct the form of the studied object into its size and various shape components, analyses were run taking into account both size and shape variation of shell measurements independently. Size was estimated as the geometric mean from all the measurements of each individual. Shape was estimated as the original measurements divided by size (as defined above) for each individual (see [46,47] for similar applications).
To test whether populations and sexes differ in size, a two-way analysis of variance (ANOVA) was run on size data using the F-test and type II sum of squares (factors are unbalanced within each category, see [48]) with sex and population as factors. Differences in shape between the two populations and sexes were estimated for each of the shape variables through a two-way multivariate analysis of variance (MANOVA) using the Hotelling-Lawley statistics and the type II sum of squares and cross products, also with sex and population as factors. To estimate whether sexual dimorphism was similar or different between populations, the interaction between factors was also taken into account. A linear discriminant analysis was applied using the four groups (the two different populations subdivided by the different sexes).
We also tested whether allometric growth was similar between populations and between sexes. To do this, we first log-transformed shape variables and size and then regressed the shape variables on size, taking into account the factors of population, sex, and their interaction. We then applied a multiple multivariate analysis of covariance (MANCOVA) to test if there were differences in allometric growth between populations and sexes within each population. In doing so, we also checked whether populations and sexes differed in mean shape considering allometry (e.g., whether populations differed for a given growth stage). This allowed biases introduced by the sampled individuals of each population and sex at a different growth stages to be accounted for.
Figure 2. Map of Santa Cruz Island with sampling localities highlighted.Map insets indicate the geographic location of the Gala´pagos archipelago, west of the Ecuadorian coast, as well as the location of Santa Cruz in the archipelago. Altitude is shown on the map in meters. The shaded area represents the agricultural zone. Grey (Cerro Fatal) and white (La Reserva) circles denote samples used for the genetic analysis (including the subset of samples used for morphometric analysis, see Materials and Methods). Thicker black lines on Santa Cruz indicate the known distribution area of each of the studied populations.
Monte Carlo approach with 10000 replicates. Once allometry was filtered out, shape variation was also analyzed between sexes and populations by using the same statistical test. To filter allometry, we used the residual shape variation from the regression of log-transformed shape variables on log-log-transformed size.
Genetics
DNA extraction was carried out with the Qiagen DNeasy Tissue Kit (Qiagen, Inc.) as per the manufacturer’s protocol. Samples from previous field trips [3,13,14] were combined with the newly collected samples for the genetic analysis. The newly sampled individuals were screened for variation at nine microsat-ellite loci as in [13], except that the Gal263 locus was not included in the analysis. These samples were genotyped on an ABI 3730 DNA Analyzer and analyzed using both GENEMARKER 1.6 (SoftGenetics, State College, PA) and GENEMAPPER 4.0 (Applied Biosystems, Foster City, CA). Allelic richness across all microsatellite loci, observed (HO) and expected (HE)
heterozygos-ity values were calculated using ARLEQUIN v3.11 [49]. Departure from Hardy-Weinberg equilibrium was assessed using a modification of the Markov-chain random walk algorithm described by [50] as implemented in ARLEQUIN with a Markov chain length of 1,000,000 and 100,000 burn-in steps. In addition, exact tests for heterozygote deficiency and excess were conducted using a modification of Markov chain randomization method when more than five alleles were detected per locus (with 1,000 batches with 10,000 iterations per batch, after10,000 burn-in steps) as implemented in GENEPOP v4.0.7 [51]. In all other cases exact significance values were calculated with the same software by complete enumeration [52]. Pairwise linkage disequilibrium between each pair of loci (36 pairwise comparisons) within each population was tested using a Markov chain method (100,000 burn-in steps and 1,000 batches at 10,000 iterations per batch) as implemented in GENEPOP. Multiple-test corrections were applied to Hardy-Weinberg and linkage disequilibrium tests using
the sequential Bonferroni [53] correction procedures in order to control type I and type II errors. Genetic divergence was quantified in ARLEQUIN using the FST index [54] estimated
by h [55]. The program STRUCTURE 2.2 [56] was used for inferring population structure and to estimate possible admixture. This program accounts for deviations from Hardy-Weinberg and linkage disequilibrium by population structure and assigns individuals to K clusters. The algorithm implemented in the program uses a Bayesian approach with a Markov Chain Monte Carlo (MCMC) procedure. In our study, we evaluated prior models with K between 1 and 4, allowing admixture between populations and correlated allele frequencies. For each value ofK, the MCMC was estimated after a burn-in of 100,000 steps, and a chain length of 1,000,000 steps.
To amplify the mtDNA control region, we used primers CytoR4 and DL3Rev and the PCR protocol described in [14]. Both strands were sequenced using BigDye v3.1 terminator on an ABI 3730 DNA Analyzer. Mitochondrial DNA sequences were assembled and edited with SEQUENCHER 4.2.2 (Gene Codes Corp.) and aligned in MEGA 4 [57] using CLUSTALW (GenBank accession numbers GQ259489-GQ259587). Sequences were collapsed and haplotypes were identified using COLLAPSE 1.2 [58]. Haplotype networks were constructed using the median joining method [59] in NETWORK 4.2.0.1 (Fluxus Technology Ltd.). ARLEQUIN was also used to calculate haplotype diversity, run an AMOVA (Analysis of Molecular Variance), and to quantify FST via the level of genetic divergence between the two samples
(based on the Tamura and Nei [60] genetic distance).
Supporting Information
Figure S1 Haplotype networks of the La Reserva and Cerro Fatal populations based on a fragment of the mtDNA control region. Dot size corresponds to the number of individuals sharing the same haplotype. On the bottom left, scale size is indicated.
Figure 3. Measurements obtained on the shell.Carapace (left and center) and plastron (right) of a Gala´pagos tortoise with the measurements used for this study indicated (see Supporting Information S1 for details on how measurements were taken).
Black dots represent median vectors; each line represents one mutational step, unless recorded otherwise noted by numbers. Different colors are used to represent tortoises sampled in La Reserva (grey) and Cerro Fatal (white) (as in Figure 2).
Found at: doi:10.1371/journal.pone.0006272.s001 (0.27 MB EPS)
Supporting Information S1 Measurements description Found at: doi:10.1371/journal.pone.0006272.s002 (0.05 MB DOC)
Acknowledgments
We are grateful to the Gala´pagos National Park authorities for issuing the permits for sample collection and the Charles Darwin Research station for
facilitating the work. We are also thankful to Arie van der Meijden, Uwe Fritz, Jonathon Marshall and Walter Salzburg for fruitful discussions on the topic of this paper, Jerry Guo for helping with the lab and field work, and Lady Marquez and Monique Mendez for helping with the sampling. This is the publication ISEM 2009-065 of YC and JC.
Author Contributions
Conceived and designed the experiments: YC AC. Performed the experiments: YC CH. Analyzed the data: YC CH JC. Contributed reagents/materials/analysis tools: AC. Wrote the paper: YC. Did field work: YC CH THF SG CM JPG. Fine-tuned the manuscript: SG JC AC.
References
1. May RM (1990) Taxonomy as a destiny. Nature 347: 129–130.
2. Fritz U, Siroky´ P, Hajigholi K, Michael W (2005) Environmentally caused dwarfism or a valid species—Is Testudo weissingeri Bour, 1996 a distinct evolutionary lineage? New evidence from mitochondrial and nuclear genomic markers. Mol Phylogent Evol 37: 389–401.
3. Russello M, Glaberman S, Gibbs JP, Marquez C, Powell JR, et al. (2005) A cryptic taxon of Gala´pagos tortoise in conservation peril. Biol Lett 1: 287–290. 4. Wikelski M, Thom C (2000) Marine iguanas shrink to survive El Nin˜o. Nature
403: 37–38.
5. Frankham R (1995) Conservation genetics. Annu Rev Genet 29: 305–327. 6. Hoffmann AA, Hercus MJ (2000) Environmental stress as an evolutionary force.
BioScience 50: 217–226.
7. MacFarland CG, Villa J, Toro B (1974) The Gala´pagos giant tortoises (Geochelone elephantopus). Part I: status of the surviving population. Biol Cons 6: 118–133. 8. Pritchard PCH (1996) The Gala´pagos tortoises-nomenclature and survival
status. Chelonian Research Monograph 1: 1–85.
9. McKinney ML (1997) Extinction vulnerability and selectivity: combining ecological and paleontological views. Annu Rev Ecol Syst 28: 495–516. 10. Purvis A, Gittleman JL, Cowlishaw G, Mace GM (2000) Predicting extinction
risk in declining species. Proc R Soc Lond B 267: 1947–1952.
11. Van Denburgh J (1914) Expedition of the California Academy of Science to the Gala´pagos Islands 1905-1906. X. The gigantic land tortoises of the Gala´pagos Archipelago. Proc Calif Acad Sci Ser 4 (2): 203–374.
12. Caccone A, Gentile G, Gibbs JP, Fritts TH, Snell HL, et al. (2002) Phylogeography and history of giant Gala´pagos tortoises. Evolution 56: 2052–2066.
13. Ciofi C, Milinkovitch MC, Gibbs JP, Caccone A, Powell JR (2002) Microsatellite analysis of genetic divergence among populationsh of giant Gala´pagos tortoises. Mol Ecol 11: 2265–2283.
14. Beheregaray LB, Ciofi C, Caccone A, Gibbs JP, Powell JR (2003) Genetic divergence, phylogeography and conservation units of giant tortoises from Santa Cruz and Pinzo´n, Gala´pagos Islands. Cons Genet 4: 31–46.
15. Beheregaray LB, Gibbs JB, Havill NP, Fritts TH, Powell JR, et al. (2004) Giant tortoises are not so slow: Rapid diversification by recent volcanism in Gala´pagos. Proc Nat Acad Sci USA 101: 6514–6519.
16. Le M, Raxworthy CJ, McCord WP, Mertz L (2006) A molecular phylogeny of tortoises (Testudines: Testudinidae) based on mitochondrial and nuclear genes. Mol Phylogenet Evol 40: 517–531.
17. Fritts TH (1983) Morphometrics of Gala´pagos tortoises: evolutionary implica-tions. In: Bowman RI, Berson M, Leviton A, eds. Patterns of evolution in Gala´pagos organisms. San Francisco, California: Pacific Division of the American Association for the Advancement of Science:107–122.
18. Seidel ME, Lucchino RV (1981) Allozymic and morphological variation among the musk turtlesSternotherus carinatus,S. depressusandS. minor(Kinosternidae). Copeia 1: 119–128.
19. Carretero MA, Znari M, Harris DJ, Mace’ JC (2005) Morphological divergence among populations ofTestudo grecafrom west-central Morocco. Anim Biol 55: 259–279.
20. Zuffi M, Odetti F, Batistoni R, Mancino G (2006) Geographic variation of sexual size dimorphism and genetics in the European pond turale,Emys orbicularis andEmys trinacris, of Italy. Ital J Zool 73: 363–372.
21. Gilbert SF, Cebra-Thomas JA, Burke A (2008) How the turtle gets its shell. In: Wyneken J, Godfrey MH, Bels V, eds. Biology of turtles. Boca Raton USA: CRC Press, Taylor & Francis Group:1–16.
22. Huxley JS (1932) Problems of relative growth. John Hopkins University Press, 1993 Edition.
23. Shaffer HB, Thomson RC (2007) Delimiting species in recent radiations. Syst Biol 56: 896–906.
24. Fraser D, Bernatchez L (2001) Adaptive evolutionary conservation: towards a unified concept for defining conservation units. Mol Ecol 10: 2741–2752. 25. Chiari Y, Orozco-terWengel P, Vences M, Vieites DR, Sarovy A, et al. (2006)
Genetic identification of units for conservation in tomato frogs, genusDyscophus. Cons Genet 7: 473–482.
26. Russello MA, Beheregaray L, Gibbs JP, Fritts TH, Havill N, et al. (2007) Lonesome George is not alone among Gala´pagos tortoises. Current Biology 17: R317–R318.
27. Poulakakis N, Glaberman S, Russello M, Beheregaray LB, Ciofi C, et al. (2008) Historical DNA analysis reveals living descendants of an extinct species of Galapagos tortoise. Proc Nat Acad Sci USA 105: 15464–15469.
28. Pritchard PCH (1996) The Gala´pagos tortoises— nomenclatural and survival status. Chelonian Res Monogr 1: 1–85.
29. Zug GR (1997) Gala´pagos tortoise nomenclature: still unresolved. Chelonian Conserv Biol 2: 618–619.
30. Fritz U, Havasˇ P (2007) Checklist of chelonians of the world. Vertebrate Zoology 57: 149–368.
31. Ryder OA (1986) Species conservation and systematics: the dilemma of subspecies. Trends Ecol Evol 1: 9–10.
32. Moritz C (1994) Defining ‘‘Evolutionarily Significant Units’’ for conservation. Trends Ecol Evol 9: 373–375.
33. Domokos G, Va´rkonyi PL (2008) Geometry and self-righting of turtles. Proc R Soc B 1630: 11–17.
34. Zani PA, Claussen DL (1995) Effects of extrinsic load on locomotion in painted turtles (Chrysemis picta). Copeia 1995. pp 735–738.
35. Myers EM, Janzen FJ, Adams DC, Tucker JK (2006) Quantitative genetics of plastron shape in slider turtles (Trachemys scripta). Evolution 60: 563–572. 36. Burns KJ, Hackett SJ, Klein NK (2002) Phylogenetic relationships and
morphological diversity in Darwin’s finches and their relatives. Evolution 56: 1240–1252.
37. Grant PR, Grant BR, Markert JA, Keller LF, Petren K (2004) Convergent evolution of Darwin’s finches caused by introgressive hybridization and selection. Evolution 58: 1588–1599.
38. Hendry AP, Taylor EB (2004) How much of the variation in adaptive divergence can be explained by gene flow? An evaluation using lake-stream stickleback pairs. Evolution 58: 2319–2331.
39. O´ lafsdo´ttir GA´, Snorrason SS, Ritchie MG (2007) Morphological and genetic divergence of intralacustrine stickleback morphs in Iceland: a case for selective differentiation? J Evolution Biol 20: 603–616.
40. Clabaut C, Bunje PME, Salzburg W, Meyer A (2007) Geometric morphometric analyses provide evidence for the adaptive character of the Tanganyikan cichlid fish radiations. Evolution 61: 560–578.
41. Salzburger W (2009) The interaction of sexually and naturally selected traits in the adaptive radiations of cichlid fishes. Mol Ecol 18: 169–185.
42. Swingland IR, North PM, Dennis A, Parker MJ (1989) Movement patterns and morphometrics in giant tortoises. J Anim Ecol 58: 971–985.
43. Bonnet X, Lagarde F, Henen BT, Corbin J, Nagy KA, et al. (2001) Sexual dimorphism in steppe tortoises (Testudo horsfieldii): influence of the environment and sexual selection on body shape and mobility. Biol J Linn Soc 72: 357–372. 44. Torres Corral M. de L. (2002) Distribucio´n espacial, preferencia de habitat y demografı´a de la tortuga giganteGeochelone negrita(Testudinata: Testudinidae) en la Isla Santa Cruz, Gala´pagos. Master Thesis, Pontifica Universidad Catolica del Ecuador. Facultad de Ciencia Exactas Y Naturales, Departamento de Ciencias Biologicas.
45. The R Development Core Team (2008) R: A Language and Environment for Statistical Computing. Version 2.7.2.
46. Claude J (2008) Morphometrics with R. New York: Springer.
47. Mosimann JE (1970) Size allometry: size and shape variables with character-izations of the lognormal and generalized gamma distributions. Journal of the American Statistical Association 65: 930–948.
48. Claude J, Pritchard PCH, Tong H, Paradis E, Auffray J-C (2004) Ecological correlates and evolutionary divergence in the skull of turtles: a geometric morphometric assessment. Syst Biol 53: 933–948.
49. Excoffier L, Laval G, Schneider S (2005) Arlequin (version 3.0): an integrated software package for population genetics data analysis. Evolutionary Bioinfor-matics Online 1: 47–50.
51. Rousset F (2008) GENEPOP ’007: a complete reimplementation of the GENEPOP software for Windows and Linux. Mol Ecol Res 8: 103–106. 52. Louis EJ, Dempster ER (1987) An exact test for Hardy-Weinberg and multiple
alleles. Biometrics 43: 805–811.
53. Rice WR (1989) Analyzing tables of statistical test. Evolution 43: 223–225. 54. Wright S (1965) The interpretation of population structure by F-statistics with
special regard to systems of mating. Evolution 19: 395–420.
55. Weir BS, Cockerham CC (1984) Estimating F-statistics for the analysis of population structure. Evolution 38: 1358–1370.
56. Pritchard JK, Stephens M, Donnelly P (2000) Inference of population structure using multilocus genotype data. Genetics 155: 945–959.
57. Tamura K, Dudley J, Nei M, Kumar S (2007) MEGA4: molecular evolutionary genetics analysis (MEGA) software version 4.0. Mol Biol Evol 24: 1596–1599. 58. Posada D (2004) Collapse, Version 3.1. Salt Lake City, UT: Department of
Zoology, Brigham Young University.
59. Bandelt HJ, Forster P, Rohl A (1999) Median-joining networks for inferring intraspecific phylogenies. Mol Biol Evol 16: 37–48.