BGD
7, 4749–4799, 2010Fractal metrology for biogeosystems
analysis
V. Torres-Arg ¨uelles et al.
Title Page
Abstract Introduction
Conclusions References
Tables Figures
◭ ◮
◭ ◮
Back Close
Full Screen / Esc
Printer-friendly Version Interactive Discussion
Discussion
P
a
per
|
Dis
cussion
P
a
per
|
Discussion
P
a
per
|
Discussio
n
P
a
per
|
Biogeosciences Discuss., 7, 4749–4799, 2010 www.biogeosciences-discuss.net/7/4749/2010/ doi:10.5194/bgd-7-4749-2010
© Author(s) 2010. CC Attribution 3.0 License.
Biogeosciences Discussions
This discussion paper is/has been under review for the journal Biogeosciences (BG). Please refer to the corresponding final paper in BG if available.
Fractal metrology for biogeosystems
analysis
V. Torres-Arg ¨uelles1, K. Oleschko2, A. M. Tarquis3, G. Korvin4, C. Gaona2, J.-F. Parrot5, and E. Ventura-Ramos1
1
Universidad Aut ´onoma de Quer ´etaro, Quer ´etaro, M ´exico
2
Centro de Geociencias, Universidad Nacional Aut ´onoma de M ´exico (UNAM), Blvd. Juriquilla 3001, Qro., 76220, Quer ´etaro, M ´exico
3
Dep. of Applied Mathematics to Agricultural Engineering (E.T.S.I.A.) C.E.I.G.R.A.M., Technical University of Madrid (U.P.M.), Ciudad Universitaria, 28040, Madrid, Spain
4
King Fahd University of Petroleum and Minerals, Dhahran 31261, Saudi Arabia
5
Instituto de Geograf´ıa, UNAM, Ciudad Universitaria, D.F., M ´exico
Received: 15 April 2010 – Accepted: 31 May 2010 – Published: 22 June 2010
Correspondence to: K. Oleschko ([email protected])
BGD
7, 4749–4799, 2010Fractal metrology for biogeosystems
analysis
V. Torres-Arg ¨uelles et al.
Title Page
Abstract Introduction
Conclusions References
Tables Figures
◭ ◮
◭ ◮
Back Close
Full Screen / Esc
Printer-friendly Version Interactive Discussion
Discussion
P
a
per
|
Dis
cussion
P
a
per
|
Discussion
P
a
per
|
Discussio
n
P
a
per
|
Abstract
The solid-pore distribution pattern plays an important role in soil functioning being re-lated with the main physical, chemical and biological multiscale and multitemporal pro-cesses. In the present research, this pattern is extracted from the digital images of three soils (Chernozem, Solonetz and “Chocolate” Clay) and compared in terms of
5
roughness of the gray-intensity distribution (the measurand) quantified by several mea-surement techniques. Special attention was paid to the uncertainty of each of them and to the measurement function which best fits to the experimental results. Some of the applied techniques are known as classical in the fractal context (box-counting, rescaling-range and wavelets analyses, etc.) while the others have been recently
de-10
veloped by our Group. The combination of all these techniques, coming from Fractal Geometry, Metrology, Informatics, Probability Theory and Statistics is termed in this paperFractal Metrology (FM). We show the usefulness of FM through a case study of soil physical and chemical degradation applying the selected toolbox to describe and compare the main structural attributes of three porous media with contrasting structure
15
but similar clay mineralogy dominated by montmorillonites.
1 Introduction
“If you cannot measure it you cannot manage it” (Cox, 2002). If you cannot measure something with known exactness and precision you cannot make unbiased decisions. The science of measurements is called Metrology and it deals with the theoretical
20
and practical aspects of measurements (ISO, 2004; JCGM, 2008). The main goal for Metrology is to outline ways in which metrological constants can be measured to required accuracies (NIST, 2001). To date, some nine well-defined disciplines have de-veloped from the original Metrology, each one focusing on specific objectives (Fig. 1), with several emerging areas in the development phase (such as Roughness
Metrol-25
BGD
7, 4749–4799, 2010Fractal metrology for biogeosystems
analysis
V. Torres-Arg ¨uelles et al.
Title Page
Abstract Introduction
Conclusions References
Tables Figures
◭ ◮
◭ ◮
Back Close
Full Screen / Esc
Printer-friendly Version Interactive Discussion
Discussion
P
a
per
|
Dis
cussion
P
a
per
|
Discussion
P
a
per
|
Discussio
n
P
a
per
|
(Willink, 2005; Cox et al., 2008), while the features which affect the reliability of the measurements of linear and angular quantities in industrial production are analyzed byDimensional Metrology (Curtis and Farago, 2007). The structure of uncertainty is analyzed in a reference way by Working Group 1 of the Joint Committee for Guides in Metrology (JCGM/WG1). We suggest that the study of complex and deeply
in-5
terconnected Biogeosystems, whose behavior is defined by a common principle of self-organizing criticality (Beir ´o et al., 2008), requires special measurands (quantities to be measured, ISO, 2004) and a corresponding toolbox of reference measurement techniques to quantify scale invariance (SI), universality (UNI), nonlinearity (NL), com-plexity (COM), criticality (CR) as well as the uncertainty of their measurements. The
10
lack of reference techniques, standards and quality control for the measurements of these basic attributes of complex systems, makes difficult any intergroup comparisons of the usually extensive data surveys, resulting in unsustainable decision-making. In this study, we combine some principles and techniques ofFractal Geometry,Metrology,
Informatics,Probability Theory andStatistics inside a new branch of Metrology, called
15
Fractal Metrology, and introducescale invariant roughnessas the main measurand of SI, UN, COM and CR of complex systems (Oleschko et al., 2008).
The present study has three goals: (i) To validate the step-by-step protocol for mea-suring the scale invariance of roughness on the structural patterns of a complex system (soilin our case), paying special attention to the uncertainty of each used measurement
20
technique; (ii) To test some new (designed by our group), as well as some common roughness measurement techniques on three soils with contrasting structural patterns, but with the same reference-mineralogy; (iii) To compare qualitatively (by visualization) and a quantitatively (in terms of the Hurst exponent) the symmetry breaking of soil aggregates under a degradation process (sodium salinization).
BGD
7, 4749–4799, 2010Fractal metrology for biogeosystems
analysis
V. Torres-Arg ¨uelles et al.
Title Page
Abstract Introduction
Conclusions References
Tables Figures
◭ ◮
◭ ◮
Back Close
Full Screen / Esc
Printer-friendly Version Interactive Discussion
Discussion
P
a
per
|
Dis
cussion
P
a
per
|
Discussion
P
a
per
|
Discussio
n
P
a
per
|
2 Complexity, criticality and roughness
We designedFractal Metrology to measure the degree of complexity and criticality of complex biogeosystems in terms of the roughness (main measurand) of their structural patterns. Undercomplexity, following Christensen and Moloney (2005), we understand the phenomenon when “the repeated application of simple rules in systems with many
5
degrees of freedom gives rise to emergent behavior not encoded in the rules them-selves”. In the present research this behavior was observed during the collapse of the solid and pore patterns ofChernozem under a common agricultural degradation process, salinization, leading to an emergent new unfertile soil, namelySolonetz. The structural pattern of the later is compared with the pure “Chocolate” Clay (a kind of
10
clayey deposits in Russia with chocolate color) composed by minerals of the montmo-rillonite group. The main difference between these soils is the origin of the dominating cation inside the CEC (Cation Exchange Complex): calcium is dominating in the Cal-cic Chernozem, while sodium prevails in Solonetz and Chocolate Clay. The Solonetz was formed from the Chernozem inside the same Chernozem-Solonetz pedological
15
complex (Oleschko, 1981), while the Chocolate Clay was taken as the example of a reference-matrix which has never been involved in the aggregation process (Vadyun-ina et al., 1980).
The termcriticality refers to the behavior of the system at the point of phase transi-tion, where no characteristic scale exists (and therefore there is pure scale invariance,
20
Christensen and Moloney, 2005). In the present study we are looking for critical behav-ior in the Chernozem-Solonetz complex, comparing the soil structural patterns before and after the transition from the totally aggregated (State I, Chernozem) to massive (State II, Solonetz) structure (Oleschko, 1981). During this transition, the structural pattern of Chernozem, a highly fertile soil with perfectly permeable sponge structure
25
BGD
7, 4749–4799, 2010Fractal metrology for biogeosystems
analysis
V. Torres-Arg ¨uelles et al.
Title Page
Abstract Introduction
Conclusions References
Tables Figures
◭ ◮
◭ ◮
Back Close
Full Screen / Esc
Printer-friendly Version Interactive Discussion
Discussion
P
a
per
|
Dis
cussion
P
a
per
|
Discussion
P
a
per
|
Discussio
n
P
a
per
|
structural attributes of Chernozem which have remained unchanged during the transi-tion to Solonetz, and test the ability of Fractal Metrology to measure the differences or similarities between the compared soils.
Roughnessis a basic common feature of all kinds of either real-world systems (nat-ural, social, economical or technological) or mathematics. Weisstein (2010), in
agree-5
ment with Finch (2001, 2003) defines a k-rough (or k-jagged) number as a positive integer whose prime factors are all greater than or equal tok. In the real-world, rough-ness characterization is mostly limited to visual judgment. The surface roughrough-ness ap-pears as a set of apparently random peaks and valleys, resulting in the fine-texture ir-regularities due to the interaction of internal and external processes (El-Sonbaty et al.,
10
2008). Smooth surfaces are rare in Nature (Majumdar and Bhushan, 1991), while rough ones have many useful properties (“rough skin is good” for suppressing air tur-bulence, see Monroe, 2006; Fransson et al., 2006). Roughness has a considerable effect on the contact of surfaces (Borri-Brunetto et al., 1999); it can influence adhe-sion(Wang et al., 2008),friction (Kim et al., 2006), wear (Bigerelle et al., 2007), and
15
reflection(Verhoest et al., 2008). While surface roughness has a positive effect in in-creasing adhesion it is considered as an undesirable imperfection from the point of view of friction (Chandrasekaran and Sundararajan, 2004; Jensen, 2006). In each of the above-mentioned examples a small change in the distribution of heights, widths, or curvatures of the peaks has an important effect on the rough surface’s behavior (Kim
20
et al., 2006). Light scattering from optical coatings is the best example for how strongly processes could be affected by the roughness of interfaces (Germer, 2000). However, in spite of the great influence of surface roughness on system behavior its measure-ment is still a notable problem of Metrology (Villarubia, 2005; Van Gorp et al., 2007). Therefore, a quantitative measurement of surface roughness is essential for several
25
BGD
7, 4749–4799, 2010Fractal metrology for biogeosystems
analysis
V. Torres-Arg ¨uelles et al.
Title Page
Abstract Introduction
Conclusions References
Tables Figures
◭ ◮
◭ ◮
Back Close
Full Screen / Esc
Printer-friendly Version Interactive Discussion
Discussion
P
a
per
|
Dis
cussion
P
a
per
|
Discussion
P
a
per
|
Discussio
n
P
a
per
|
3 Fractals and scale invariance
No formal definition of fractals exists. Informally, Mandelbrot (2002) defines the fractals as irregular shapes, in either mathematics or the real world, with the property that each small part of them is a reduced-size copy of the whole. Mandelbrot emphasizes that the use of wordsfractureandfractal derived from the same root (fractus) is not a mere
5
accident. First by Mandelbrot et al. (1984), and then by numerous follow-up studies, it has been shown that the fractal dimensionD(the main distinctive attribute of a fractal) is an invariant measure of the roughness of fractures in metals and rocks (Mandelbrot, 2002). Mandelbrot proposed to viewFractal Geometry as a scientific approach to de-scribe the sensation of rough versus smooth, as a “study of scale invariant roughness”.
10
Fractal Metrology has the same goal and measurand but it focuses on the selection and calibration of reference measurement techniques and their comparison in terms of uncertainty, as well as the best fitting measurement model.
Spatio-temporal invariance which is a main feature of natural nets and the basic concept of Physics is especially suitable to describe the structural patterns of complex
15
systems. At present, the four most widely used types of spatial invariance in Physics (Nambu, 2008) are rotational invariance (ferromagnets); translational invariance (crys-tals); local gauge invariance (superconductors); and, global gauge invariance (super-fluids). Recently,scale invariance as well has been found useful in applied sciences and for theoretical purposes.
20
We propose the scale invariant roughness as the main measurand of Fractal Metrol-ogy. Mandelbrot (2002, 5–6) argued that “much in nature is ruled by what used to be called pathology” but, fortunately, the latter “is not unmanageable”. He continued: “This is so because it obeys a form of invariance or symmetry that overlaps Nature and Mathematics, and is called scale invariance or scaling that is central to my life work. . .
25
BGD
7, 4749–4799, 2010Fractal metrology for biogeosystems
analysis
V. Torres-Arg ¨uelles et al.
Title Page
Abstract Introduction
Conclusions References
Tables Figures
◭ ◮
◭ ◮
Back Close
Full Screen / Esc
Printer-friendly Version Interactive Discussion
Discussion
P
a
per
|
Dis
cussion
P
a
per
|
Discussion
P
a
per
|
Discussio
n
P
a
per
|
the metrological measurand, selection of the corresponding reference measuring tools and assignment of a realistic uncertainty to the measurements (compared by
Student’-tand Pearson’sr correlation analyses). This way, we shall accomplish the three main tasks of Metrology (NIST, 2001).
3.1 Optics of fractal objects
5
Surface reflectance properties are among the most important attributes of matter. Rec-ognizing the material from these properties (such as lightness and gloss) is a nontrivial task (Fleming et al., 2003), being related with problems of the “universe of projec-tions” (Puente, 2004). The reflectance measurements by a scanning optical micro-scope proved to be statistically effective to inspect the surfaces of optical components
10
for imperfections (ranging from sub-micrometer to several micrometres, Gomez et al., 1998). Fleming et al. (2003) documented that a skewed distribution of illuminant inten-sities is a necessary condition for perceiving surface reflectance, as the skew tends to increase the contrast between darkest and brightest regions. Korvin (2005) general-ized Pentland’s (1984) result about the fractal dimension of the optical image of rough
15
surfaces. He proved, without imposing the condition that the reflection obeys Lam-bert’s Law, that the surface and the image have the same fractal dimension and there-fore the roughness can be statistically extracted from the images. We designed two methods to extract the digital image roughness, by converting the original image con-sisting ofNr×Ncpixels to a time series (.ts). Every pixel has a gray valuepi j between 20
0 and 255. Herei=1,...,Nr is the row-index, j=1,...,Nc is the column index, where Nr and Nc depend on the image size (mean image size in the present research was
1000×874). One way to convert an image to a time series is to rearrange all pixels row-wise into a 1-dimensional (1-D) arrayF={p11,p12,...,p1N,p21,...p2N,...,pN1,...pNN}of
length 1000×874, what we call firmagram (Oleschko et al., 2004) and whose
rough-25
ness can be measured by algorithms available for the analysis of self-affine sets. An other possibility is to consider theempirical histogram nk={#(pi j=k
BGD
7, 4749–4799, 2010Fractal metrology for biogeosystems
analysis
V. Torres-Arg ¨uelles et al.
Title Page
Abstract Introduction
Conclusions References
Tables Figures
◭ ◮
◭ ◮
Back Close
Full Screen / Esc
Printer-friendly Version Interactive Discussion
Discussion
P
a
per
|
Dis
cussion
P
a
per
|
Discussion
P
a
per
|
Discussio
n
P
a
per
|
or its normalized version, the empirical PDF pk=
nn
k
N2
k=0,1,...,255 o
. The series
p1,p2,...,p255, extracted from each digital image of interest constitutes the time series
for further fractal analysis. Note that by definition a stochastic process (or random func-tion{x(t)}α) is a family of real- (or complex-) valued functions depending on a random
parameterα, wheret usually plays the role of time. In the case of images analysis t 5
represents the pixel position (in case offirmagramanalysis) or pixel value (in case of
PDF analysis).
4 Metrology
While as Hardy (1940) observed, a mathematician makes patterns, the specialist in Metrology should make these patterns workable. Metrology is the science looking
10
for the specific theoretical and practical aspects of the measurement and traceability, uncertainty and calibration carried out in the numerous applied and theoretical fields (JCGM, 2008). It was born to make comparisons based on quantitative measurements and directed to understand, interpret and make correct decisions about the system of interest. The selection of measurand is the first step in each measuring process. When
15
this selection is made keeping in mind the strict standards of Metrology, the objects or system measurements become statistically precise and close to the true values of parameters.
5 Fractal metrology
Complex systems exhibit scaling properties which obey power laws (Katz, 2006;
Plow-20
BGD
7, 4749–4799, 2010Fractal metrology for biogeosystems
analysis
V. Torres-Arg ¨uelles et al.
Title Page
Abstract Introduction
Conclusions References
Tables Figures
◭ ◮
◭ ◮
Back Close
Full Screen / Esc
Printer-friendly Version Interactive Discussion
Discussion
P
a
per
|
Dis
cussion
P
a
per
|
Discussion
P
a
per
|
Discussio
n
P
a
per
|
general (and probably universal) principles underlying the internal structure and exter-nal behavior of such systems it is indispensable to develop a generic pattern-oriented framework based on metrological principles and suitable for the measurement of com-plexity (Grimm et al., 2005). This framework should provide a unifying scheme for the main definitions, notions and techniques. The standardization however, is by no means
5
a trivial procedure (Berry, 2001).
5.1 Basic concepts of fractal metrology
The metrological description of each phenomena of interest comprises certain clearly defined steps (JCGM, 2008). The present research focuses on three of them: 1. The selection of the main measurand; 2. The comparison in terms of uncertainty between
10
the known techniques for measurand quantification; 3. The selection of measurement model for measurements representation. These steps are visualized on Fig. 2. The image of a tree (Mezquite from Queretaro State, Mexico) was used as to represent the branching structure (Dodds, 2010) of the information required by Fractal Metrology. This tree forms the base of the hierarchical ordering, clustering, coding, switching and
15
control in a Fractal Metrology network of elements (Kaneko, 1990). This graph is suit-able to design the step-by-step procedure for measurement of scale invariant rough-ness of multiscale and multitemporal images, time series or signals. The distinctive fea-ture of this information organization and management is a clear hierarchical and logical character of the system functioning. Three main roots are constituted by data banks
20
which alimented the highly ramified branches (consisting of by known and new mea-surement techniques) through the unique trunk corresponding to the dimensionless measurands of roughness (fractal dimensions and corresponding Hurst exponents). The uncertainty is taken as the main indicator of efficiency of each compared tech-nique to quantify the measurand with known precision. The Weierstrass-Mandelbrot
25
BGD
7, 4749–4799, 2010Fractal metrology for biogeosystems
analysis
V. Torres-Arg ¨uelles et al.
Title Page
Abstract Introduction
Conclusions References
Tables Figures
◭ ◮
◭ ◮
Back Close
Full Screen / Esc
Printer-friendly Version Interactive Discussion
Discussion
P
a
per
|
Dis
cussion
P
a
per
|
Discussion
P
a
per
|
Discussio
n
P
a
per
|
aren’t trees” (Monroe, 2010).
5.1.1 Hurst exponent as the measurand
We selected the Hurst exponent as the main measurand of roughness and therefore of Fractal Metrology, because of its ability to express the asymptotic statistical proper-ties of a random processx(t) (Denisov, 1998), and because it merges local and global
5
features of space/time anisotropy inside the unique variable called roughness. Pro-posed by the hydrologist Harold Edwin Hurst (1951), the classical rescaled adjusted rangeR/S-statistics have become a popular and robust technique for local and global dependence analysis (Mandelbrot, 2002). In time-series the Hurst exponent measures the growth of the standardized range of the partial sum of deviations of a data set
10
from its mean (Ellis, 2007). Mandelbrot and Wallis (1968) have incorporated in the Hurst methodology ordinary least squares (OLS) regression techniques, and proposed to estimate the statistics over several subseries (windows) dividing the whole series length (Ellis, 2007). The Hurst exponent (H) is related to the fractal dimension (D) by a simple (conjectured) rule, that first time appeared in Hardy’s (1916) work:
15
D=2−H , (1)
where 2 is the Euclidean dimension of the space where the fractal is embedded. The Hurst exponent is especially suitable to characterizestochastic processes(Mandelbrot and van Ness, 1968) from the point of view of scale invariance (Bassler et al., 2006). There are basic differences between persistent (H>0.5) and antipersistent (H<0.5)
20
processes, while the white noise is characterized by H=0.5. Note that the H values tend to 0 when the roughness is growing.
5.2 “Toolbox” of fractal metrology
The soil roughness was extracted from digital images and measured on firmagram, histogram and probability density function by selected measurement techniques.
BGD
7, 4749–4799, 2010Fractal metrology for biogeosystems
analysis
V. Torres-Arg ¨uelles et al.
Title Page
Abstract Introduction
Conclusions References
Tables Figures
◭ ◮
◭ ◮
Back Close
Full Screen / Esc
Printer-friendly Version Interactive Discussion
Discussion
P
a
per
|
Dis
cussion
P
a
per
|
Discussion
P
a
per
|
Discussio
n
P
a
per
|
5.2.1 Firmagram roughness
Image digitization refers to the transformation of an apparently continuous image into discrete intensity values distributed at equally spaced locations across an xy-grid, called araster (Pawley, 2006). The procedure results in an array of rows and columns which we (Oleschko et al., 2004) proposed to analyze as a one-dimensional array of
5
data gathered inside the same column. The graphical representation of this column is the above-mentioned firmagram (Oleschko et al., 2004). The whole distribution of gray-tones (from 0 – black, to 255 – white) inside an image represents its global roughness (Fig. 4Ab, Bb, Cb), while a baseline of each selected area refers to the local roughness. This dual representation visualizes how the image roughness is changing with scale,
10
with an accuracy of one pixel. The Histo Gene algorithm (Parrot, 2003) scans the im-age from the first pixel on the top line until the final one on the bottom, building a column of the intensity values. The output files are in.tsformat therefore the measurement of their roughness becomes a trivial task (seemeasurement techniques).
5.2.2 Histogram roughness
15
The second way to extract the measurand for our research is using the histogram. The histogram is considered a precise way to summarize the statistical information associated with a complex system (Strauss, 2009; Tancrez et al., 2009). To get the his-togram in the present work we used the algorithmFrequ Hist, written by Parrot (2003). TheFrequ Hist output file consists of the frequencies of occurrence (y) of each
gray-20
intensity value (x), forming a time series whose roughness can be measured by se-lected reference techniques. The output file of the Hist Gene (.ts) is transferred to
Frequ Hist (.xls). The output file of the latter algorithm consists of four data columns. The first one contains the values of gray tones extracted from the original gray-scale image, arranged in decreasing order. The second one displays the frequency of each
25
BGD
7, 4749–4799, 2010Fractal metrology for biogeosystems
analysis
V. Torres-Arg ¨uelles et al.
Title Page
Abstract Introduction
Conclusions References
Tables Figures
◭ ◮
◭ ◮
Back Close
Full Screen / Esc
Printer-friendly Version Interactive Discussion
Discussion
P
a
per
|
Dis
cussion
P
a
per
|
Discussion
P
a
per
|
Discussio
n
P
a
per
|
respective probability to find it inside the image, constituting the effective probability density function(PDFef) of the analyzed image (Fig. 4Ad, Bd, Cd). The roughness of both PDFs is quantified by the measurement techniques (see Sect. 5.3). The PDFefis
compared with the modeled theoretical distribution by means of the @RISK (Palisade Corporation, 2005) software (Fig. 4Ae, Be, Ce).
5
5.2.3 Probability density function roughness
The Histogram is one of the most useful forms of summarizing random data for vi-sual and statistical analysis (Lu and Guan, 2009). It is an extremely useful tool for graphically represent data variability which is described in quantitative terms by the
probability density function (Strauss, 2009). For a continuous function, the PDF
ex-10
presses the probability that the variable of interestX lies in an interval (a b), (see, e.g. NIST/SEMANTECH, 2006):
Zb
a
f(x)dx=Pr[a≤X≤b].
For a discrete distribution, the PDF represents the probability that the variableX takes the valuex. Note, that when displayed, the PDF graph has the same appearance as
15
the histogram (Fig. 4Ad, Bd, Cd, Fig. 4Ae, Be, Ce).
Berry (1996) was first who drew attention to “some unexpected fractal properties” of the probability density
P(r,t)≡ |Ψ(r,t)|2(r={x1,x2,...xD})
for what he called “the simplest imaginable nonstationary Schr ¨odinger waveΨ”. He
20
BGD
7, 4749–4799, 2010Fractal metrology for biogeosystems
analysis
V. Torres-Arg ¨uelles et al.
Title Page
Abstract Introduction
Conclusions References
Tables Figures
◭ ◮
◭ ◮
Back Close
Full Screen / Esc
Printer-friendly Version Interactive Discussion
Discussion
P
a
per
|
Dis
cussion
P
a
per
|
Discussion
P
a
per
|
Discussio
n
P
a
per
|
fractals in fractal boxes he has suggested some simple modifications which giveDtime
andDspace.
In our research the fractal behavior of PDF was found empirically. In addition to the PDF estimation by means of Frequ Hist, the statistical analysis of the gray-tone dis-tribution across each analyzed image has also been accomplished by the commercial
5
software @RISK 4.5 add-in for Microsoft Excel (Palisade Corporation, 2005). The tools ofRisk Analysis have been used since long for the analysis of financial data oscilla-tions, but rarely applied in Natural Sciences. We have found @RISK a user-friendly software (except its rather high price!) suitable for Biogeoscience studies because of its precision and relative simplicity.
10
The @RISK 4.5 package selects the best fit to the experimental data function from among 37 different theoretical probability distributions (Normal, Lognormal, Logistic, Beta, Gamma, Pareto, etc.). The algorithm is based on a Monte-Carlo simulation tech-nique which replaces the uncertain or unknown values of an experimental dataset by a range of more probable values. The list of five selected, best fitting functions are
dis-15
played automatically, the first one being the most probable for the studied data. To cre-ate a histogram, the software finds the maximum and minimum values of a data range, divides the range into classes whose level of importance depends on the probability of occurrence of values, defined as {p}={p1,p2,...,pn}=data rank array. In @RISK
4.5 (Palisade Corporation, 2005) the probability density function is used to construct
20
the frequency distribution from an infinitely large set of values where the class size is becoming infinitesimally small. The visual similarity between PDFs constructed by
Frequ Hist and @RISK can be observed in Fig. 4Ad, Bd, Cd and Ae, Be, Ce.
5.3 Measurement techniques
There are a legion of fractal descriptors suitable to quantify the specific attributes of
25
complex systems. For instance, the fractal dimension (D) measures the set’s space-filling ability (Mandelbrot, 1982); the degree of itstranslation invarianceis quantified by
BGD
7, 4749–4799, 2010Fractal metrology for biogeosystems
analysis
V. Torres-Arg ¨uelles et al.
Title Page
Abstract Introduction
Conclusions References
Tables Figures
◭ ◮
◭ ◮
Back Close
Full Screen / Esc
Printer-friendly Version Interactive Discussion
Discussion
P
a
per
|
Dis
cussion
P
a
per
|
Discussion
P
a
per
|
Discussio
n
P
a
per
|
and tortuosity of the pore and solid networks are measured byrandom-walk fractal di-mensions (Korvin, 1992; Rodriguez-Iturbe and Rinaldo, 1997), orspectral dimension
orfracton (Orbach, 1986). The main advantages and problems of fractal descriptor measurements have been described in details in some by now standard (Korvin, 1992; Barton and La Pointe, 1995; Falconer, 1997; Turcotte, 1997, etc.) as well as recent (T ´el
5
and Gruiz, 2006) books. There are several useful reviews comparing the algorithmic aspects of these measurements and the performance of each fractal dimension: for instance, theboundary fractal dimensionis treated in Klinkenberg (1994) and Gallant et al. (1994);self-affine time series analysisin Malamud and Turcotte (1999) and Pel-letier and Turcotte (1999), while thecorrelation dimension was the subject of Kogan’s
10
(2007) detailed study. A comparison of computer-simulated examples was given by Be-hery (2006). The compilation of Sun et al. (2006, Table 1), focusing on the techniques used for the fractal dimension analyses of the surface features extracted by remote sensing, is especially useful for summarizing and comparing the different techniques.
Mandelbrot (2002) proposed to put the most important fractal analysis techniques
15
into a “toolbox”, just as the tools of the electricians’ and plumbers’. The “power-law”
figuring in the probability distribution Pr{U>u}∼u−αdescribing the distribution of a sys-tem’s attributes having a sizeU>ucan be used inFractal Metrologyas a superior tool for fractal modeling. Levitz (2007) used the notion“basic toolbox” to capture forms and patterns, while we applied the term “toolkit” as more proper for applied sciences (in
20
Oleschko et al., 2010). For Fractal Metrology we propose to use the original term “tool-box” (oreffective toolbox), to honor to the pioneering works of Mandelbrot (2002). We shall put inside this box some tools designed by us in addition to the common fractal techniques of one of the available commercial software –Benoit (1.3) (SCION Corp., Trusoft, 1999, one of its early versions was reviewed by Seffens, 1999). Each Benoit
25
BGD
7, 4749–4799, 2010Fractal metrology for biogeosystems
analysis
V. Torres-Arg ¨uelles et al.
Title Page
Abstract Introduction
Conclusions References
Tables Figures
◭ ◮
◭ ◮
Back Close
Full Screen / Esc
Printer-friendly Version Interactive Discussion
Discussion
P
a
per
|
Dis
cussion
P
a
per
|
Discussion
P
a
per
|
Discussio
n
P
a
per
|
exponents) are designed for self-similar sets or curves, while therescaled range(DRS), power spectrum (DPS), roughness/length (Dr), variogram (Dv), and wavelet (Dw)
di-mensions are used for self-affine traces or time series (SCION Corp., Trusoft, 1999). The following discussion will involve only five of the mentioned techniques.
5.3.1 Box dimension (DB)
5
The size of a self-similar fractal set has been shown to display a power-law relationship with the measurement scale where the fractal dimension is the exponent of the power-law (Tang and Marangoni, 2006). TheBox Dimension technique is the classical way to prove the fractal behavior of the studied mathematical, computer-simulated or real physical set and is used in this work to measure the roughness from the space-filling
10
ability of solid and pore networks. In this technique, the counting of boxes contain-ing pixels of the object is accomplished, considercontain-ing the box as occupied if at least one analyzed intensity value belongs to the box. The following equation is basic for
Dboxcalculation:
N(d)∼ 1
dDb (2)
15
whereN(counted for a set of box sizes with different orientation) is the number of those boxes of linear sized which contain at least one point of the structure (Fig. 3f).
5.3.2 R/S Analysis (DR/S)
The R/S analysis is used to describe the self-similarity properties of time series through the Hurst exponent (Scipioni et al., 2008). This traditional method can be described in
20
terms of the range of partial sums of deviations of values from the mean of a time se-ries, normalized by its standard deviation (Alvarez-Ramirez et al., 2008). TheRescaled rangeR/S(w) is defined as (TruSoft, 1999):
R/S(w)=
R(w)
S(w)
BGD
7, 4749–4799, 2010Fractal metrology for biogeosystems
analysis
V. Torres-Arg ¨uelles et al.
Title Page
Abstract Introduction
Conclusions References
Tables Figures
◭ ◮
◭ ◮
Back Close
Full Screen / Esc
Printer-friendly Version Interactive Discussion
Discussion
P
a
per
|
Dis
cussion
P
a
per
|
Discussion
P
a
per
|
Discussio
n
P
a
per
|
wherewis the window length;R(w) is the range of values inside the sampled interval;
S(w) is the average standard deviation, angular brackets denote expected values. The following equation shows the power-law relation which can be established between the
R/S ratio and window length via the Hurst exponentH:
R/S(w)∼wH. (4)
5
The linearity of the double logarithmic plot of R/S(w) as a function of w reveals a scaling law, whereH is the Hurst exponent which is obtained from the slope of the straight line. The relationship between fractal dimension and Hurst exponent is given by Hardy’s (1916) conjecture (see Eq. 1).
5.3.3 Power spectrum (DPS)
10
A powerful method to extract the hidden structural information (such as: periodicities and persistence) from a fluctuating time-series is to calculate its power spectrum (Su and Wu, 2007). The power spectrum method gives a scale invariant measure of fractal dimension since the log-log slope of the power spectrum is invariant to arbitrary rescal-ing of the input (Wilson, 1997). Usually, the Fast Fourier Transform (FFT) is applied
15
to estimate the power spectrum (Dimri and Prakash, 2001). To obtain an estimate of the fractal dimension, the power spectrumP(k) (wherek=2π/λ is the wavenumber, andλis the wavelength) is first calculated and plotted on a double logarithmic plot as
P(k) versus k. If the time-series is self-affine, this plot should follow a straight line for large wavenumbers, with a negative slope−b which is estimated by regression. The
20
exponent−bis related to the fractal dimensionDPSas follows (TruSoft, 1999):
DPS=
5−b
2 . (5)
5.3.4 Wavelets (DW)
Wavelets are localized functions of zero mean, constructed by the linear combination of scaling functions (Bakucz and Kr ¨uger-Sehm, 2009). They are especially useful for
BGD
7, 4749–4799, 2010Fractal metrology for biogeosystems
analysis
V. Torres-Arg ¨uelles et al.
Title Page
Abstract Introduction
Conclusions References
Tables Figures
◭ ◮
◭ ◮
Back Close
Full Screen / Esc
Printer-friendly Version Interactive Discussion
Discussion
P
a
per
|
Dis
cussion
P
a
per
|
Discussion
P
a
per
|
Discussio
n
P
a
per
|
compressing images due to certain wavelet transform properties which are in some ways superior to the conventional Fourier transform (Weisstein, 2010). The Wavelet Method is based on the fact that the wavelet transform of a self-affine trace is also self-affine (Rehman and Siddiqi, 2009). The characteristic measure of wavelet variance analysis is the wavelet exponent, Hw (Malamud and Turcotte, 1999). Wavelets are
5
implemented using trigonometric functions that are oscillating around zero in a non-smooth sweep, and localizing them in the frequency space (Jones and Jelinek, 2001). Consider n wavelet transforms all of them with a different scaling coefficient ai, let S1,S2,...Sn be their standards deviations from zero. Define the ratiosG1,G2,...,Gn−1
of the standard deviations as G1=S1/S2,G2=S2/S3,...,Gn−1=Sn−1/Sn, and compute 10
the average value ofGi as (TruSoft, 1999):
Gavg=
n−1
P
i=1
Gi
n−1. (6)
The Hurst exponent (H) isH=f(Gavg), wheref is a heuristic function which describesH
byGavg for stochastic self-affine traces (TruSoft, 1999). The mother wavelet in Benoit
1.3 is a step function. Malamud and Turcotte (1999) have underlined that wavelets
15
analysis does not share the power-spectral analysis’ inherent problems, such as win-dowing, detrending etc.
5.4 Measurement uncertainty
We propose to measure the uncertainty in terms of standard deviation (σ). The H
andσvalues extracted by selected Benoit techniques from the original digital images,
20
firmagrams and PDF were subjected to Person’sr and Student’st statistical analyses in order to estimate the statistical significance of the differences between them.
Comparative analysis of the five selected reference measurement tools is realized in the present research following the Guide to the expression of uncertainty (GUM)
in measurement (2008), published by the Joint Committee for Guides in Metrology
BGD
7, 4749–4799, 2010Fractal metrology for biogeosystems
analysis
V. Torres-Arg ¨uelles et al.
Title Page
Abstract Introduction
Conclusions References
Tables Figures
◭ ◮
◭ ◮
Back Close
Full Screen / Esc
Printer-friendly Version Interactive Discussion
Discussion
P
a
per
|
Dis
cussion
P
a
per
|
Discussion
P
a
per
|
Discussio
n
P
a
per
|
(JCGM). The statement ofmeasurement uncertainty is used in its broadest sense as adoubt defining it asa parameter, associated with the result of a measurement, that characterizes the dispersion of the values that could be reasonably attributed to the
measurand (JCGM, 2008, p. 2). The GUM recognizes two types of measurement
er-rors (systematic and random) putting them on a probabilistic basis through the concept
5
ofmeasurement uncertainty (JCGM, 2009). The latter is described asthe measure of how well one believes one knows the measurand value(JCGM, 2009, p. 3).
Thestandard uncertainty is defined as the standard deviation (JCGM, 2008) of the input quantity. We propose to measure the uncertainty of fractal analyses in terms of the standard deviation (σ) for the Benoit results.
10
The statistical significance of the differences in standard uncertainties of the Benoit’s data was quantified by Student’s-tand Pearson’srcorrelation analyses. The Pearson’s
r correlation matrix (computed by the MINITAB Software, 1998) was constructed as:
rX Y =
Pn
i=1(Xi−X¯)(Yi−Y¯)
(n−1)SXSY , (7)
whereX,Y are all possible pairs of the compared variables, see Tables 7–11. Here,
15
¯
X and ¯Y are mean values, SX and SY are standard deviations. Student’s t-test was
carried out for paired variables in the SPSS Inc. (1989–2004) environment.
For the @RISK results we carried out the statistical comparison of the significance of the obtained differences in a few statistics built from the first four moments: mean, variance, kurtosis and skewness (Tables 8–11).
20
The standard deviations of all used techniques (except the wavelets) were analyzed by the same statistical tests but independently ofH. Additionally, the Person’sr and Student’st-tests were applied to the three compared soils of contrasting genesis, look-ing for a correlation between the roughness of their images. Finally, the same two statistical tests were applied to the four statistics yielded by @Risk PDF analysis.
BGD
7, 4749–4799, 2010Fractal metrology for biogeosystems
analysis
V. Torres-Arg ¨uelles et al.
Title Page
Abstract Introduction
Conclusions References
Tables Figures
◭ ◮
◭ ◮
Back Close
Full Screen / Esc
Printer-friendly Version Interactive Discussion
Discussion
P
a
per
|
Dis
cussion
P
a
per
|
Discussion
P
a
per
|
Discussio
n
P
a
per
|
5.5 Measurement function
The rule forconverting a quantity value into the corresponding value of the measurand
is named a measurement model (JCGM 200, 2008). We selected the Weierstrass-Mandelbrot function (Berry and Lewis, 1980) as the measurement model (JCGM, 2009) which fits well to our experimental data (the firmagram as well as the
prob-5
ability density function, see later). Developing a measurement model corresponds to the formulation stage of uncertainty evaluation (JCGM, 2009). The Weierstrass functionW0(t) is an everywhere continuous but nowhere differentiable function (NIST,
2010 online Digital Library of Mathematical Functions, DLMF) constituted by the sum of a convergent trigonometric series of the form
10
W0(t)= X∞
n=0ω
nexp(2πi bnt), (8)
where the subscript in W0(t) corresponds to “original”; the base b is a real number >1, and the weight ω is written either ω=b−H, with 0<H<1 or as ω=bD−2, where 1<D=2−H<2; it can be proven that D is the Minkowski-Bouligand dimension for the graph ofW0(t) (Mandelbrot, 2002, 146–147). Several systems with fractal features (i.e.
15
exhibiting scale invariant roughness) can be described with the modified Weierstrass function introduced by Mandelbrot who added to the series furthersubharmonics or quasi-subharmonics. This special and pathological function, called as Weierstrass-Mandelbrot function (Berry and Lewis, 1980; Wang et al., 2008) is continuous, non differentiable and possesses no scale. It is defined as:
20
W(x)=
∞
X
n=−∞
(1−e(i γnx))ei φn
γ(D−2)n ,(1< D <2,γ >1,φnarbitrary) (9)
BGD
7, 4749–4799, 2010Fractal metrology for biogeosystems
analysis
V. Torres-Arg ¨uelles et al.
Title Page
Abstract Introduction
Conclusions References
Tables Figures
◭ ◮
◭ ◮
Back Close
Full Screen / Esc
Printer-friendly Version Interactive Discussion
Discussion
P
a
per
|
Dis
cussion
P
a
per
|
Discussion
P
a
per
|
Discussio
n
P
a
per
|
6 Results and discussion 6.1 Experimental setup
Seventeen micromorphological images of three soils with contrasting structural pat-terns but with similar clay content and mineralogy (Oleschko, 1981) were used for the statistical comparison of the measurement techniques selected for inclusion in Fractal
5
Metrology. The Chernozem-Solonetz pedological complex was sampled in the same agricultural field (Tambov State, Russia). The undisturbed samples (8 cm×4 cm) were collected with specially designed samplers from the arable horizon of each studied soil. All samples were taken at field moisture in order to conserve the soil’s structural pat-tern. In the laboratory, samples were dried by the acetone replacement method and
10
impregnated with resin. The hardened samples were sectioned horizontally making sure that the natural solid-pore distribution anisotropy derived from the tillage prac-tices is preserved (Fig. 3a, c, e). Thin sections (2 cm×4 cm) with 30 µm thickness, were prepared by standard in Russia petrographic procedure (Parfenova and Yarilova, 1977; Brewer, 1964) and analyzed under the petrographic (Carl Zeiss) microscope. All
15
thin sections and digital images are representative of the structural patterns’ original anisotropy.
The Chernozem and Solonetz are located five-ten meters apart of each other, inside the patches of a typical mosaic of a man-induced Bad Lands landscape. However, theChernozemis the black soil with the highest known level of sponge-type structure
20
development (Phase 1), while theSolonetz is a saline-sodium soil with typical mas-sive pattern and ephemeral fractures derived from the altering expansion/contraction cycles (Phase 2). Solonetz had originated from the Chernozem as a result of chemical degradation due to unsustainable irrigation with saline water. Therefore, the experi-mental setup was focused to capture the critical behavior and phase transition of the
25
BGD
7, 4749–4799, 2010Fractal metrology for biogeosystems
analysis
V. Torres-Arg ¨uelles et al.
Title Page
Abstract Introduction
Conclusions References
Tables Figures
◭ ◮
◭ ◮
Back Close
Full Screen / Esc
Printer-friendly Version Interactive Discussion
Discussion
P
a
per
|
Dis
cussion
P
a
per
|
Discussion
P
a
per
|
Discussio
n
P
a
per
|
Figures 3a, b, c and 4Aa, Ba, Ca show the representative examples of micromor-phological images of Chernozem (Figs. 3a and 4Aa) and Solonetz (Figs. 3c and 4Ba), visualizing their contrasting structural patterns that have resulted in statistically different physical properties (Table 2) and soil behavior. The loss of the original quality is related to the structure’s collapse in response to the drastic changes which occurred inside the
5
cation exchange complex where the calcium dominating in Chernozem had been re-placed by sodium, resulting in Solonetz formation. The phase transition from the highly connected to massive pattern with water-unstable structure and ephemeral fractures has occurred when the sodium concentration exceeded the permissible (critical) level of the macro- and microaggregates’ stability. Because of the universality of phase
tran-10
sitions (Stanley, 1971), we expected the similarity of Hurst exponents in case of both soils regardless of some local details. In our case the divergences of the order parame-ters at the critical Na contentCNa,crit scalenear the critical point as∼
CNa,crit−CNa
−λ
. We tried to capture and visualize this trend for the compared soils, measuring it by Fractal Metrology toolbox. The final comparison was carried out between the structural
15
patterns of both soils and the Chocolate Clay whose massive microstructure had never passed through an aggregation process (Fig. 3e).
The compared images were taken from thin sections using an optical microscope under 10×magnification (Oleschko, 1981).
6.2 Structural patterns comparison
20
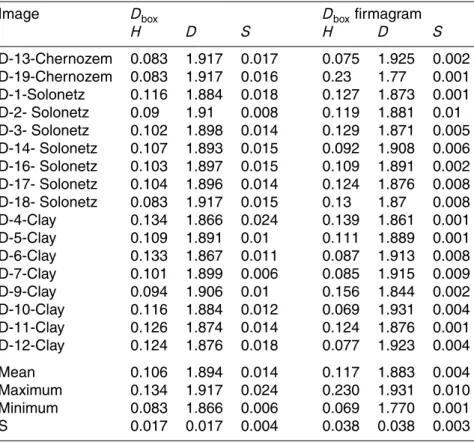
The mean value of the fractal box dimensions for the three compared soils, extracted from the original image and the negative image of the firmagram (Benoit’s box counting algorithm is working only on the white part of an image, Fig. 3f) is close to 1.89, the fractal dimension of the Sierpinski carpet (Korvin, 1992), varying between 1.87 (Cher-nozem) and 1.92 (Solonetz). The data variation is low, with highest mean standard
25
deviation of 0.017 obtained for Dbox of Chernozem (original image) and the minimal
BGD
7, 4749–4799, 2010Fractal metrology for biogeosystems
analysis
V. Torres-Arg ¨uelles et al.
Title Page
Abstract Introduction
Conclusions References
Tables Figures
◭ ◮
◭ ◮
Back Close
Full Screen / Esc
Printer-friendly Version Interactive Discussion
Discussion
P
a
per
|
Dis
cussion
P
a
per
|
Discussion
P
a
per
|
Discussio
n
P
a
per
|
from the point of view of the space filling ability of their solid and pore patterns, and their roughness calculated by the box fractal dimension. Note that the box counting analysis of the firmagram extracts more precise information about the matrix density (solids and pores mutual distribution) inside the original images.
The apparent independence of the box counting dimension on soil genesis for the
5
studied pedological complex compared with Chocolate Clay (porous material which can not be named soil) can be observed in Table 1. This independence can be inter-preted as empirical evidence for some generic features (universality?) of roughness of these materials with similar clay mineralogy (micro-scale) but contrasting appearance of structural patterns (macro-scale). Therefore, neither the box fractal dimension nor
10
the standard deviation were able to detect any differences in the roughness of digital images of the compared soils.
Our previous physical experiments, and corresponding computer simulations, have shown similar trends for soils of different genesis (Oleschko et al., 2000). Fractal analy-sis of multiscale soil images, firmagrams as well as observed and computer-simulated
15
microwaves scattered from soil (has not been done in the present study), yielded simi-lar values for the fractal parameters (Oleschko et al., 2002, 2003).
In Table 2 the microaggregate composition of the Chernozem and Solonetz esti-mated by the reference pipette method (Vadyunina and Korchagina, 1973) are com-pared for two genetic horizons. The high content of physical clay (the physically active
20
fraction of particles with size <0.01 mm, considered as most important for microag-gregation) in both soils ensures their suitability to form clusters of fine particles (mi-croaggregates). Notwithstanding, the differences in the nature of the dominant cation in CEC are responsible for contrasting physical and chemical properties of Chernozem and Solonetz. We speculate that the similarity in roughness between these soils is due
25
to their high physical clay content, which increased significantly with depth (Oleschko, 1980).
BGD
7, 4749–4799, 2010Fractal metrology for biogeosystems
analysis
V. Torres-Arg ¨uelles et al.
Title Page
Abstract Introduction
Conclusions References
Tables Figures
◭ ◮
◭ ◮
Back Close
Full Screen / Esc
Printer-friendly Version Interactive Discussion
Discussion
P
a
per
|
Dis
cussion
P
a
per
|
Discussion
P
a
per
|
Discussio
n
P
a
per
|
differences, independently on the applied measurement techniques (Tables 3 and 4).
6.3 Uncertainty of fractal measurements
As the second step of measurements protocol, the Hurst exponent values, extracted from the images, firmagrams and PDFs by Box Counting, Rescaled-Range, Power Spectrum and Wavelets techniques were compared as regards the mean value of the
5
Hurst exponent and its standard deviation (Table 5). TheHRSextracted from the
orig-inal images transformed into time series (ts) has highest mean value in Chernozem (0.064) as compared with Solonetz (0.039) and Clay (0.031). The mean standard de-viation shows the same tendency: its value is higher for theHRSof Chernozem (0.742)
in comparison with Solonetz (0.362) and Chocolate Clay (0.377). We note that the
10
Chernozem’s standard deviation measured by Rescaled Range technique (0.742) is more than almost 50 times larger than for Box Counting (0.017).
As in the case of box counting (Table 5), the standard deviation was smaller forHRS
extracted from the firmagrams, being equal to 0.193 for Chernozem and minimal for Clay (0.104). The mean value of HRS measured for the firmagrams three soils was
15
0.229, and therefore the corresponding mean fractal dimension wasDRS=1.771. The values of roughness measured by the power spectrum method applied on the origi-nal images and firmagrams were comparable with those values obtained by theR/S
technique (except the “Clay” samples where the fractal dimension has reached the topological limit of 2): the mean value ofHPSis equal to 0.208 for images. For all
tech-20
niques the roughness information extracted from the PDF was noisier in comparison with the two other sources namely original digital images and firmagrams. In spite of the listed differences between the differently measured Hurst exponents, these were not statistically significant only for four compared standard deviation pairs (Tables 5 and 6). The H values measured by Wavelets technique fluctuated around 0.5 (the
25
BGD
7, 4749–4799, 2010Fractal metrology for biogeosystems
analysis
V. Torres-Arg ¨uelles et al.
Title Page
Abstract Introduction
Conclusions References
Tables Figures
◭ ◮
◭ ◮
Back Close
Full Screen / Esc
Printer-friendly Version Interactive Discussion
Discussion
P
a
per
|
Dis
cussion
P
a
per
|
Discussion
P
a
per
|
Discussio
n
P
a
per
|
The meanHRSvalue measured on the firmagram was equal to 0.229 (with standard
deviation 0.141) showing that the HRS extracted from the original image has higher
roughness (meanHRS=0.044) and higher uncertainty (SRS=0.493). The power spec-trum technique gave the similar meanHPSvalue of 0.208 for the original images of the
compared soils, showing higher roughness for the firmagram (HPS=0.048). The values
5
ofHwmeasured by Wavelets method fluctuated around 0.5 for images, firmagrams and
PDF, the meanHwvalue was equal to 0.40 for the original images (Table 5).
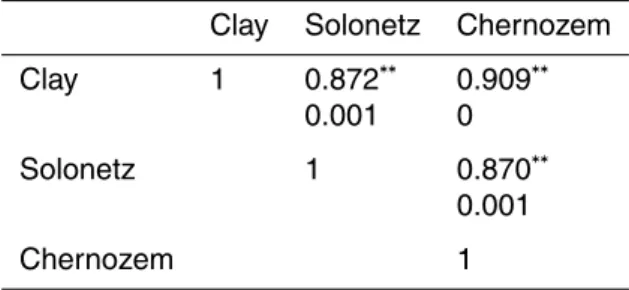
This conclusion is confirmed by Pearson’sr analysis where 45 different pairs ofH
were compared (Table 7), showing the statistically significant correlation at the 0.01 level among 7 of them, at the level 0.05 among four pairs, and uncorrelated values of
10
the remaining 34 pairs. However, it is notable that among these 34 pairs, 23 corre-spond to the Hurst exponents measured by wavelets technique (which have correlated negatively−0.80, and only once with theHRSof soil firmagrams) while the other eleven
have correlation coefficients close to 0.45.
In spite of the statistical similarity between the compared soils’ roughness (Table 4),
15
theprecisionof the compared techniques measured in terms of standard deviation was significantly different, except for the following pairs which show significant correlation:
Sbox(image) versus Sbox(firmagram) with correlation coefficient of −0.528; SRS(image) and SPS(i mage), wherer=−0.72, (Table 6).
The outlier (high) standard deviation values of the spectral dimension might be due
20
to the special construction of the time series extracted from the digital images and firmagrams. In the image one should expect a spatial correlation over a distance of a few pixel-sizes between the neighboring valuespi ,j;pi±1,j;pi±2,j;.... Because of this,
some artificial periodicity in the firmagram of period≈N could have appeared, so that the lags, window-length, etc., used to estimateH orDfrom the images and firmagrams
25
must be kept much less than image sizeN in order to avoid this artifact.
BGD
7, 4749–4799, 2010Fractal metrology for biogeosystems
analysis
V. Torres-Arg ¨uelles et al.
Title Page
Abstract Introduction
Conclusions References
Tables Figures
◭ ◮
◭ ◮
Back Close
Full Screen / Esc
Printer-friendly Version Interactive Discussion
Discussion
P
a
per
|
Dis
cussion
P
a
per
|
Discussion
P
a
per
|
Discussio
n
P
a
per
|
Chernozem-Solonetz pedological complex images and the Chocolate Clay (Tables 8– 11). We speculate that the influence of microstructure and soil mineralogy on image roughness is more important than all other attributes characteristic for the macrofea-tures of the structural pattern. The detailed architecture of Solonetz on the microscale preserved the original Chernozem features, conserving the self-organizing capacity of
5
the fine matrix near the transition point when sodium content overpasses the critical value. This catastrophic event, known assoil chemical degradation, involves a struc-tural phase transition detectable by visual comparison of microscopic images. The Chernozem aggregates collapsed at all hierarchical levels, resulting in the massive pattern of Solonetz, where the major attraction between the solid particles (with high
10
content of montmorillonites) is responsible for the low inter-aggregate porosity and high fracture density. This re-arrangement of structural patterns does not cause statistically significant changes in the scale-invariance of the microstructure. However, in spite of the statistically insignificant differences of the Hurst exponent values, theH values of Solonetz and Chocolate Clay for some techniques tend to be smaller, indicating higher
15
roughness (Table 5). These changes can be interpreted as indications of the break-down of interconnected porosity in Solonetz, due to the soil’s chemical degradation. In most of the analyzed cases the roughness of the micromorphological images has antipersistent character.
7 Conclusions
20
The presented results of applying the Fractal Metrology toolbox to three soils with contrasting structural patterns but very similar mineralogy prove the effectiveness of certain fractal descriptors for measuring the dynamics of complex systems. The box counting dimension extracted from the images and firmagrams was more precise in terms of standard deviation in comparison with the three other techniques selected for
25
BGD
7, 4749–4799, 2010Fractal metrology for biogeosystems
analysis
V. Torres-Arg ¨uelles et al.
Title Page
Abstract Introduction
Conclusions References
Tables Figures
◭ ◮
◭ ◮
Back Close
Full Screen / Esc
Printer-friendly Version Interactive Discussion
Discussion
P
a
per
|
Dis
cussion
P
a
per
|
Discussion
P
a
per
|
Discussio
n
P
a
per
|
yields results close to those in case of the box- andR/S analyses but it has incompa-rably higher uncertainty probably due to the artificial construction of the firmagrams. The wavelets technique was not able to extract meaningful roughness estimates from the studied images, the resultingH values fluctuated aroundH=0.5 characteristic for white noise. Similar tendency was found for the Hurst values extracted from the PDFs
5
of gray intensities. Notwithstanding, the statistically significant similarity between the roughness of Chernozem and Solonetz belonging to the same pedological complex affected by salinization proves the suitability of the proposed step by step technique to look for the critical behavior of soil structural patterns related with degradation. The selected toolbox can be useful for the quantification of the spatio-temporal dynamics
10
and behavior of other Earth systems, especially in similar cases of phase-transition. We conclude that a combined use of different fractal descriptors ensures the required statistical control for fractal measurements of complex system attributes and behavior, and provides data for unbiased comparison. The optimal selection of fractal parame-ters to capture critical behavior and phase transition should be tested for each specific
15
application.
Acknowledgements. This research has been funded by Consejo de la Ciencia y Tecnolog´ıa
(CONACyT)M ´exico, under Grant 84502 and PAPIIT (UNAM) IN116009. The first author grate-fully acknowledges the postgraduate scholarship support of CONACyT. G. Korvin grategrate-fully acknowledges the creative atmosphere of his home institute, KFUPM, and the many visits to
20
Mexico when he has had opportunity to interact with K. Oleschko’s research group.
References
Alvarez-Ramirez, J., Echeverria, J. C., and Rodriguez, E.: Performance of a high-dimensional R/S method for Hurst exponent estimation, Physica A, 387, 6452–6462, 2008.
Bakucz, P. and Kr ¨uger-Sehm, R.: A new wavelet filtering for analysis of fractal engineering
25
surfaces, Wear, 266, 539–542, 2009.