ABSTRACT: Carbon ibers have been widely used as structural reinforcement in aeronautical composites, because of their exceptional mechanical properties. However, carbon ibers present few polar groups on their surfaces inducing a weak interaction with some thermosetting and thermoplastic matrices. Surface treatments, such as thermal and electrochemical oxidation, are generally followed by sizing in order to improve interfacial adhesion between carbon ibers and some matrices. The precise surface characterization, by means of its chemical groups and radical identiication, has been pointed out as an effective tool of carbon ibers inishing assessment process. Goniometry and Fourier transform-infrared spectroscopy are widely used to characterize some materials applied in industry, but not for carbon ibers, mainly because of their ilamentary shape and the high concentration of carbon even in their near surface. In this paper, unsized and sized Torayca T300 carbon ibers were characterized by goniometry tests to evaluate hydrophilic or hydrophobic character. Qualitatively, it was noticed the effect of sizing on carbon ibers by their hydrophilic behavior, which has not been observed in unsized samples. Chemical analysis was performed by Fourier transform-infrared spectroscopy using different setups: photoacoustic, attenuated total relectance and universal attenuated total relectance. The Fourier transform-infrared spectroscopy/attenuated total relectance/Germanium was shown to be the most promising technique to analyze carbon ibers surface, despite the low level of relative intensities of some bands. By this technique, it was possible to observe differences between unsized and sized carbon ibers spectra.
KEYWORDS: Carbon iber, Infrared spectroscopy, Wettability, Characterization, Surface properties.
Applicability of FT-IR Techniques and
Goniometry on Characterization of Carbon
Fiber Surfaces
Mauro Santos de Oliveira Junior1,2, Milton Faria Diniz3, Rita de Cássia Lazzarini Dutra3,4, Marcos Massi1,2, Choyu Otani2
INTRODUCTION
In the last decades, carbon ibers (CF) have become a requisite and worthy material used in strategic applications. hey have been widely used in structural reinforcement in composites, mainly in aeronautics, aerospace and automotive industries because of their excellent mechanical, thermal and electrical properties. Furthermore, their low volumetric expansion coeicient and low density turned them more attractive for these industries. CF used in structural applications are normally obtained at temperatures above 1500 °C. hey present special characteristics, such as ordered graphitic structure disposed preferentially in parallel to the iber axis and their high concentration of carbon is at least 92% (Chung 1994). he crystallinity of CF is strongly inluenced by the carbonization process parameters (Chung 1994; Morgan 2005). However, the concentration of elements like nitrogen and oxygen is poor in CF, even on their surface. hus, the low content of polar groups in the CF surface can compromise their adhesion to some polymeric matrices (Chan et al. 1996; Montes-Morán et al. 2001; Xu et al. 2008).
A surface treatment is necessarily employed at the end of the process to obtain CF, in order to reduce the electrostatic charge on their surface and to handle them. It is important to improve the interfacial adhesion between CF and the composite matrix. Basically, these treatments can be divided into two groups: wet and dry processes. In dry processes, plasmas have been widely used for this purpose (Donnet et al. 1986, 1987; Chan et al. 1996; Montes-Morán et al. 2001; Park et al. 2010; Oliveira Jr
1.Universidade Federal de São Paulo – Instituto de Ciência e Tecnologia – Departamento de Ciência e Tecnologia – São José dos Campos/SP – Brazil. 2.Departamento de Ciência e Tecnologia Aeroespacial – Instituto Tecnológico de Aeronáutica – Divisão de Ciências Fundamentais – São José dos Campos/SP – Brazil. 3.Departamento de Ciência e Tecnologia Aeroespacial – Instituto de Aeronáutica e Espaço – Divisão de Química – São José dos Campos/SP – Brazil. 4.Departamento de Ciência e Tecnologia Aeroespacial – Instituto Tecnológico de Aeronáutica – Divisão de Engenharia Mecânica – São José dos Campos/SP – Brazil.
Author for correspondence: Mauro Santos de Oliveira Junior | Universidade Federal de São Paulo – Instituto de Ciência e Tecnologia – Departamento de Ciência e Tecnologia | Rua Talim, 330 – Vila Nair | CEP: 12.231-280 – São José dos Campos/SP – Brazil | Email: [email protected]
et al. 2011). On the other hand, the wet processes based on electrochemical reactions, such as oxidation, luorination, and oxyluorination, have been employed to modify the CF surface (Basova et al. 1999; Ho et al. 2008; Seo and Park 2009). Generally, following these processes, a coating of polymeric sizing, also denoted as inishing, can be applied to protect the CF surface.
hese treatments generally increase the surface energy and wettability of some materials. Goniometry has been a simple technique that can be applied to analyze these thermo-dynamic properties. he hydrophobic or hydrophilic features of any material can be quickly assessed just by measuring the contact angle of a liquid dropped over its lat surface, in order to determine its adhesive potential. Fowkes (1964) showed the contribution of some molecular interactions to the total surface energy. For polymers, dispersive and polar forces are usually the main components that make up the total surface energy. hese parameters are generally calculated by measuring contact angles of two diferent liquids. Owens and Wendt (1969) and Kaelble and Uy (1970) developed a method called geometric mean that is applied to calculate the surface energy of polymers using polar and apolar liquids in the goniometry setup. Wu (1971) described a method called harmonic mean that can be suitable when goniometry measurements are made with high surface tension liquids. However, the contact angle of samples with high surface energy can not be measured reliably, mainly for polymers, because the liquid usually spread irregularly over the surface, but the wettability can be analyzed in a qualitative way. In order to infer from mechanical and chemical changes occurred on CF by a speciic treatment, the characterization of their surface is important to evaluate how efficient this treatment is. For chemical analysis, the spectroscopy techniques are widely used to characterize polymers. he use of light-based spectroscopy, like Fourier transform-infrared spectroscopy (FT-IR), is a challenge in the analysis of CF, because they intensively absorb electromagnetic radiation and the scattering can make it diicult to obtain good spectra from them. hus, few authors have worked intensively with various FT-IR techniques to characterize CF (Morita et al. 1986; Graf et al. 1987; Ishida 1987; Ohwaki 1993; Boehm 1994; Ohwaki and Ishida 1995; Yang and Simms 1995).
Ohwaki (1993) characterized CF by some FT-IR techniques and X-ray photoelectron spectroscopy (XPS). It was possible to identify some chemical bonds on the CF surface with good sensibility by FT-IR analysis, and the results are in agreement with those obtained by XPS analysis. By varying some parameters
from FT-IR/attenuated total relectance (ATR), such as the light polarization states, the crystal type and the beam incident angle, Ohwaki also veriied an improvement of the signal/noise (S/N) ratio spectra. he improvement in the S/N ratio was better for small incident angles in non-polarized light, but it aims a deeper layer from the bulk sample (Ohwaki and Ishida 1995).
Jiang et al. (2015) have recently studied CF surface modiied by electrophoretic deposition using FT-IR and other techniques. Despite of FT-IR spectra have indicated formation of C=O and C–O groups on CF surface, they used the transmission mode that is inappropriate to analyze surfaces. Samples prepared with KBr pellet are inadequate, because of its hygroscopic character that can introduce bands related to OH groups from humidity around 3300 and 1650 cm−1, interfering in spectrum
interpretation. herefore, it can be supposed that the analysis of CF surface through speciic techniques could be promising.
hus, this study was focused on the investigation of chemical contents on unsized and sized CF surfaces by FT-IR and goniometry. hese techniques are useful and applied to some materials, being cheaper than XPS. By comparing already-known photoacoustic (PAS), ATR and the new technique universal attenuated total relectance (UATR), it was possible to verify that each technique has an appropriate sensibility to identify some diferences between these two types of ibers. Goniometry analysis was also employed to evaluate qualitatively the hydrophilic or hydrophobic characteristics of these CF.
EXPERIMENTAL
RAW MATERIAL
Tows with 3,000 ilaments of unsized and sized Torayca T300 CF have been used in this paper. he polymeric sizing coating of these CF is based on epoxy resin and it represents 1 wt%.
GONIOMETRY
surfaces. However, CF tows (3,000 filaments) have a non-planar and discontinuous surface, and it is diicult to make a quantitative analysis by this technique.
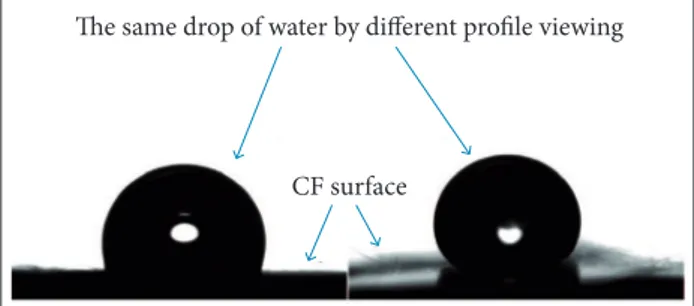
he geometric form of the drop, oval, is similar to the form visualized at the middle of the drop shown in Fig. 2a. hese results are qualitative, because the measurement of the contact angle is compromised by the diiculty to obtain the baseline that is necessary to deine the interface between the drop and the surface which allows measuring correctly the angle. he contact angle seems to be near to 90° in the parallel proile. On the other hand, the angle seems to be higher in the transversal proile, as shown in Fig. 2b. When unsized CF were compared with sized ones, the latter proved to be more hydrophilic, because the drop of water spread out the whole sample, as shown in Fig. 3.
hese results obtained by goniometry technique are important in order to show that the sized CF have a surface energy higher than that of the unsized ones, despite having a low percentage in weight of polymeric sizing over the CF surface. With these results, the FT-IR techniques were applied in order to compare both ibers and identify some chemical bonds.
Glass plate
Top view
Adhesive tape Carbon iber (ilaments)
Side view
Plane surface Space
Approximate dimensions (15 × 20 × 3 mm)
The same drop of water by different profile viewing
CF surface
Needle Figure 1. Sample of CF prepared for goniometry analysis.
FT-IR ANALYSIS
The chemical analysis of the CF surface was made using the PAS accessory coupled to a FT-IR Spectrometer Spectrum 2000 – PerkinElmer as well as ATR and UATR accessories coupled in a Spectrum One FT-IR Spectrometer – PerkinElmer. For FT-IR/PAS analysis two distinct speed conditions were set up under nitrogen. he fast scan was made with a speed of 0.2 cm/s, 32 scans, 8 cm−1 of resolution and
spectral range from 4000 to 400 cm−1. The slow analysis
has the same parameters, but a speed of 0.05 cm/s. FT-IR/UATR analysis was made using a ZnSe crystal in the region between 4000 and 550 cm−1 and 40 scans. A pressure of 100 N
over the sample was set up to improve the surface contact with the crystal. he FT-IR/ATR analysis was made using Ge crystals. Each of these two techniques operates with the following parameters: 40 scans, light beam incident angle of 45° and, in this case, the samples were spread over both faces of the crystal. For FT-IR/ ATR/Germanium (Ge), the range of operation was from 4000 to 700 cm−1. he environmental condition of all spectroscopy
analysis was 25 ± 2 °C and 45 ± 3% of humidity.
RESULTS AND DISCUSSION
GONIOMETRY CHARACTERIZATION
Drops of deionized water were deposited on the CF surface. The drop profile was taken for analysis in the parallel and transverse CF axis direction, in order to infer from the inluence of the roughness of the whole sample (multiple ilaments), as shown in Fig. 2. In the parallel direction, roughness tends to be smoother than in a transverse direction, because transversal ilaments hold the drop by mechanical anchorage.
Figure 3. Drop of water deposited on sized CF surface.
Figure 2. Proile of deionized water on the CF surface. (a) Parallel to the CF axis; (b) Transverse to the CF axis.
FT-IR ANALYSIS
he spectroscopic analysis of CF was carried out by three diferent FT-IR techniques starting by those considered near-surface, such as FT-IR/PAS. Other techniques, FT-IR/UATR and FT-IR/ATR/Ge, were also used in order to obtain good spectra from unsized and sized CF Toray T-300.
PHOTOACOUSTIC DETECTION
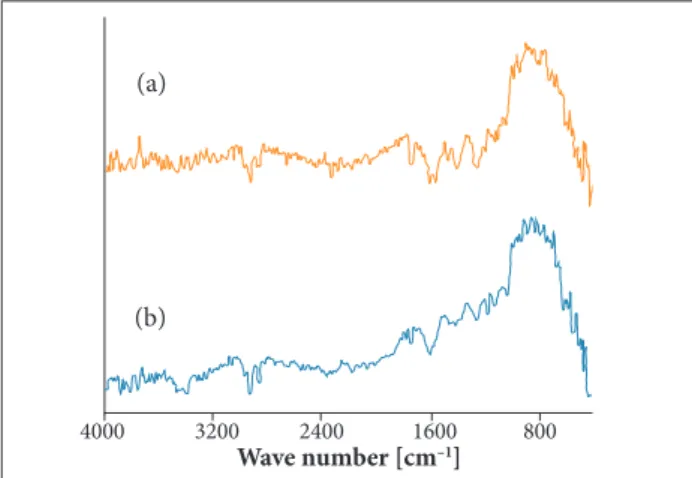
is reached basically by choosing the adequate scan speed. his technique proved to be effective in the analysis of opaque materials, such as the CF and most of its composites (Graf 1987). he irst analyses of unsized (A) and sized (B) CF were performed at speed scan of 0.2 cm/s. his condition is considered the fastest and prior to detect chemical groups near to the surface. In this case, as can be seen in Fig. 4, the relatively low S/N ratio spectrum was obtained due to the absence of strong absorption bands, leading to a difficult assessment among spectra band with speciic chemical species.
he results obtained by the speed scan of 0.2 cm/s led to the decision of carrying out the analysis with the slow speed scan of 0.05 cm/s. his choice was based on previous study performed in other researches, in which a better S/N ratio was obtained in the spectra produced by using a slower scan speed (Nogueira et al. 2007). Slow scan keeps the incident beam at the same region for a considerable time, contributing to the spectra accumulation, which becomes favorable to enrich the main spectrum (Stegge and Urban 2001).
he FT-IR/PAS (0.05 cm/s) spectra of unsized (A) and sized (B) CF are presented in Fig. 5. It was noted an attenuation of the noise, but the proile of the spectra presented the same appearance of those in the fast speed scan. It was not possible to clearly identify any chemical bonds on CF bulk or on their surfaces.
In our case, the procedure of obtaining FT-IR/PAS of CF was limited. he results were not satisfactory, mainly because the spectra had a low S/N ratio and did not show any diference between them. his result could be related to the fact that the PAS technique investigates more properly near-surface specimens, and the chemical content of CF can be placed in a depth between 1 – 4 µm. herefore, FT-IR/UATR was chosen
to be the next step to analyze the surface of both CF (Abidi and Hequet 2005; Sanches et al. 2008).
UNIVERSAL ATTENUATED TOTAL REFLECTANCE
The FT-IR/UATR method does not need a considerable amount of samples, because the exposed surface area of the crystal is positioned to make the contact with the sample which has a diameter of 2 mm (Sanches et al. 2008). The FT-IR/UATR spectra of unsized (A) and sized (B) CF showed an anomalous spectrum in the region between 1220 and 3600 cm−1. Inverted bands with high intensities in the
region between 1900 and 2200 cm−1 were given, producing
spectra in which the main baseline was easily lost, making it difficult a good analysis of the spectra, as shown in Fig. 6. These results lead to the conclusion that it was not possible to explore this technique, at least by the method of the direct analysis of CF. Thus, the FT-IR/ATR/Ge technique was employed to analyze CF in order to verify the chemical
Wave number [cm–1]
4000 3200 2400 1600 800
Wave number [cm–1]
4000 3200 2400 1600 800
Wave number [cm–1]
4000 3200 2400 1600 800
Figure 4. FT-IR/PAS spectra (0.2 cm/s). (a) Unsized
CF; (b) Sized CF. Figure 6. FT-IR/UATR spectra. (a) Unsized CF; (b) Sized CF.
Figure 5. FT-IR/PAS spectra (0.05 cm/s). (a) Unsized CF; (b) Sized CF.
(a) (a)
(a)
(b) (b)
changes in the surface not observed by other techniques (Ohwaki 1993; Ohwaki and Ishida 1995).
The use of Germanium crystal as fiber samples holder was introduced in this part of the study aiming at the analysis of carbon layers close to the sample surface, due to its better eiciency presented against the use of the hallium Bromo-Iodine crystal (KRS-5) (Urbaniak-Domagala 2012; Barbeş et al. 2014; Technical Note, 2004).
ATTENUATED TOTAL REFLECTANCE
FT-IR/ATR/Ge was also employed to make a comparative analysis between unsized and sized CF. he advantage of this technique over FT-IR/UATR consists of a larger contact area of the crystal used in the present method (20 × 50 mm) in relation to the crystal size used in the UATR method, which uses a small crystal of 2 mm in the diameter. he refractive index of Ge crystal is 4.0, consequently, it allows to access near-depth surface up to 0.67 µm, which can be useful for thin-ilms, composites and ibers (Urbaniak-Domagala 2012). his means that the FT-IR/ATR/Ge method permits a near-surface analysis in a large amount of points of the sample, enriching the spectrum. he FT-IR/ATR/Ge spectra of unsized (A) and sized (B) Torayca T-300 CF showed well-deined absorption band proiles and baselines, as shown in Fig. 7.
However, it is known the Torayca T-300 is not graphitized CF and some elements of the precursor can be presented in its structure. hese CF could also have been undergone a surface treatment, even being sold as an unsized CF. his was evidenced by the observation of some bands, mainly in
the region near 1200 cm−1 of FT-IR/ATR/Ge spectrum (A),
as shown in Fig. 7. Sized CF were characterized with the same technique and their FT-IR/ATR/Ge spectrum (B) was a little richer than that of the unsized CF. A pasty residual substance was extracted from sized CF (B) by immersion in acetone at room temperature. In this case, a little amount of sample was obtained because the quantity of sizing in the CF surface is near 1 wt%. However, this residue was enough to be characterized by UATR, as can be observed by the FT-IR/UATR spectrum (C) in Fig. 7. he region between 700 and 1800 cm−1 is rich in absorption bands and some of them
have their correspondent on sized CF.
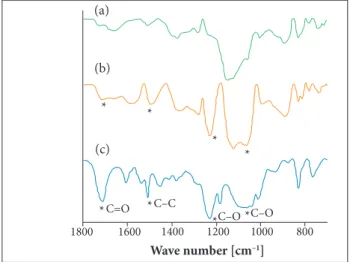
The partial spectra from this region are presented in Fig. 8,in which there is a variation of approximately 5% in intensities of some bands from unsized (A) and sized (B) CF, mainly in the region between 700 and 1300 cm−1. he intensity
of FT-IR/ATR/Ge bands is somewhat 10 times higher than FT-IR/UATR spectrum bands, at the same region.
It can be observed some intense bands in the UATR spectrum of the residue (C) and some of them can also be observed in sized CF (B), as shown in Fig. 8. he appearance of bands in the regions 1070 – 1150 cm−1 and 1230 cm−1 are probably related
to the stretching of C–O bond, corroborating the presence of epoxy resin in CF, because this bond is presented in the basic structure of this resin. he band at 1500 cm−1 can be attributed to
the stretching of C–C bond, which is a characteristic of aromatic molecules and it can compose complementary structures of some resins, such as C=O bond, observed at 1710 cm−1, commonly
present in modiied epoxy resins and/or esters (Smith 1979;
Wave number [cm–1]
4000 3200 2400 1600 800
Wave number [cm–1]
1800 1600 1400 1200 800
C–O C–O C–C
C=O
1000
* *
* *
* *
* *
Figure 7. FT-IR/ATR/Ge spectra. (a) Unsized CF; (b) Sized CF; (c) FT-IR/UATR spectrum of residual substance removed from sized CF.
Figure 8. FT-IR/ATR/Ge partial spectra. (a) Unsized CF; (b) Sized CF; (c) FT-IR/UATR partial spectrum of residual substance removed from sized CF.
(a)
(a)
(b)
(c)
(b)
Ohwaki 1993; Boehm 1994; Dutra et al. 1995; Ohwaki and Ishida 1995; Pamula and Rouxhet 2003).
CONCLUSIONS
In this study, it was clearly observed in a qualitative way that unsized and sized CF showed hydrophobic and hydrophilic behavior, respectively, indicating goniometry as a quick and cheap technique for CF surface assessment. It was possible to verify the limitations and advantages of PAS, ATR and UATR techniques to analyze near-surface chemical groups of CF. he FT-IR/PAS is one of the most eicient techniques to do near-surface analysis. However, its response was not satisfactory to characterize CF, mainly due to diiculties in preparing samples and the depth of chemical content. As CF are ilamentary, it is diicult to keep them in rest and
consequently the signal detection of PAS is compromised. A low S/N ratio was obtained, independently of the speed scan used. he characterization of CF by FT-IR/UATR was also compromised, in function of the appearance of a negative absorption in a large area in the middle of the spectra for both ibers. he reason why this phenomenon occurred must be deeply studied and other ways must be explored. he FT-IR/ ATR/Ge was shown to be the most promising technique to analyze CF, despite the low level of relative intensities of some bands presented by CF. However, it was possible to verify that unsized CF (as received) had already been submitted to a surface treatment through comparative analysis. It was also possible to identify some chemical bonds present in both sized CF as in the residue removed from them. hese results showed that FT-IR/ATR/Ge can be useful to the characterization of carbon iber surface, mainly ater the surface treatment made at the end of carbonization processes.
REFERENCES
Abidi N, Hequet E (2005) Fourier transform infrared analysis of trehalulose and sticky cotton yarn defects using ZnSe-diamond universal attenuated total relectance. Text Res J 75(9):645-652. doi: 10.1177/0040517505057527
Barbeş L, Rădulescu C, Stihi C (2014) ATR-FTIR spectrometry
characterisation of polymeric materials. Rom Rep Phys 66(3): 765-777.
Basova YV, Hatori H, Yamada Y, Miyashita K (1999) Effect of oxidation-reduction surface treatment on the electrochemical behavior of PAN-based carbon ibers. Electrochem Commun 1(11):540-544. doi: 10.1016/S1388-2481(99)00112-5
Boehm HP (1994) Some aspects of the surface chemistry of carbon blacks and other carbons. Carbon 32(5):759-769. doi: 10.1016/0008-6223(94)90031-0
Chan CM, Ko TM, Hiraoka H (1996) Polymer surface modiication by plasmas and photons. Surf Sci Rep 24(1-2):1-54. doi: 10.1016/0167-5729(96)80003-3
Chung DDL (1994) Carbon iber composites. Washington: Butterworth-Heinemann.
Donnet JB, Brendle M, Dhami TL, Bahl OP (1986) Plasma treatment effect on the surface energy of carbon and carbon ibers. Carbon 24(6):757-770. doi: 10.1016/0008-6223(86)90186-7
Donnet JB, Dhami TL, Dong S, Brendle M (1987) Microwave plasma treatment effect on the surface energy of carbon ibres. J Phys D: Appl Phys 20(3):269-275. doi: 10.1088/0022-3727/20/3/005
Dutra RCL, Takahashi MFK, Diniz MF (1995) Importância da preparação de amostras em espectroscopia no infravermelho com transformada de Fourier (FTIR) na investigação de constituintes em materiais compostos. Polímeros 5(1):41-47.
Fowkes FM (1964) Attractive forces at interfaces. Ind Eng Chem 56(12):40-52. doi: 10.1021/ie50660a008
Graf RT, Koenig JL, Ishida H (1987) Introduction to optics and infrared spectroscopic techniques. In: Fourier transform infrared characterization of polymers. vol. 36. New York: Springer. p. 1-32.
Ho KKC, Lee AF, Lamoriniere S, Bismarck A (2008) Continuous atmospheric plasma luorination of carbon ibres. Compos Appl Sci Manuf 39(2):364-373. doi: 10.1016/ j.compositesa.2007.10.008
Ishida H (1987) Quantitative surface FT-IR spectroscopic analysis of polymers. Rubber Chem Technol 60(3):497-554. doi: 10.5254/1.3536139
Jiang JJ, Liu F, Deng C, Fang LC, Li DJ (2015) Inluence of deposited CNTs on the surface of carbon iber by ultrasonically assisted electrophoretic deposition. IOP Conf Ser Mater Sci Eng 87(1):1-4. doi: 10.1088/1757-899X/87/1/012103
Kaelble DH, Uy KC (1970) A reinterpretation of organic liquid-polytetraluoroethylene surface interactions. J Adhes 2(1):50-60. doi: 10.1080/0021846708544579
Montes-Morán MA, Martínez-Alonso A, Tascón JMD, Paiva MC, Bernardo CA (2001) Effects of plasma oxidation on the surface and interfacial properties of carbon ibres/polycarbonate composites. Carbon 39(7):1057-1068. doi: 10.1016/S0008-6223(00)00220-7
Morgan P (2005) Carbon iber and their composites. Boca Raton: CRC Press.
Nogueira LM, Dutra RCL, Diniz MF, Pires M, Evangelista M, Santana FA, Tomasi L, Santos P, Nonemacher R (2007) Avaliação da aplicabilidade de técnicas MIC/FT-IR/DSC para a caracterização de ilmes multicamadas. Polímeros 17(2):158-165. doi: 10.1590/S0104-14282007000200015
Ohwaki T (1993) Surface characterization of carbon iber by infrared spectroscopy (PhD thesis). Cleveland: Case Western Reserve University.
Ohwaki T, Ishida H (1995) Optimization of the surface characterization of carbon iber by FT-IR internal relection spectroscopy. Appl Spectrosc 49(3):341-348. doi: 10.1366/0003702953963634
Oliveira Jr MS, Santos LV, Sagas JC, Pereira FP, Machado JPB, Otani C, Massi M, Sobrinho ASS (2011) Surface treatment of pan-based carbon-ibre with microwave excited plasmas. Paper presented at: V Brazilian Carbon Conference; Rio de Janeiro, Brazil.
Owens DK, Wendt RC (1969) Estimation of the surface free energy of polymers. J Appl Polym Sci 13(8):1741-1747. doi: 10.1002/ app.1969.070130815
Pamula E, Rouxhet PG (2003) Bulk and surface functionalities of type III PAN-based carbon ibres. Carbon 41(10):1905-1915. doi: 10.1016/S0008-6223(03)00177-5
Park SJ, Chang YH, Moon CH, Suh DH, Im SS, Kim YC (2010) A study of atmospheric plasma treatment on surface energetics of carbon ibers. Bull Korean Chem Soc 31(2):335-338. doi: 10.5012/ bkcs.2010.31.02.335
Sanches NB, Diniz MF, Alves LC, Dutra JCN, Cassu SN, Azevedo MFP, Dutra RCL (2008) Avaliação da aplicabilidade de técnicas FT-IR de relexão (UATR) e de transmissão para a determinação do teor de acrilonitrila (AN) em NBR. Polímeros 18(3):249-255. doi: 10.1590/S0104-14282008000300011
Seo MK, Park SJ (2009) Surface characteristics of carbon ibers modiied by direct oxyluorination. J Colloid Interface Sci 330(1):237-242. doi: 10.1016/j.jcis.2008.10.005
Smith AL (1979) Applied infrared spectroscopy. New York: John Wiley & Sons.
Stegge JM, Urban MW (2001) Stratiication processes in thermoplastic oleins monitored by step-scan photoacoustic FT-IR spectroscopy. Polymer 42(12):5479-5484. doi: 10.1016/S0032-3861(00)00852-1
Technical Note - FT-IR spectroscopy, attenuated total relectance (ATR). 2004. Shelton (CT): PerkinElmer; [accessed 2015 Aug 21]. http:// shop.perkinelmer.com/Content/technicalinfo/tch_atraccessories.pdf
Urbaniak-Domagala W (2012) The use of the spectrometric technique FTIR-ATR to examine the polymers surface. In: Farrukh MA, editor. Advanced aspects of spectroscopy. Rijeka: InTech. p. 85-104. doi: 10.5772/48143
Wu S (1971) Calculation of interfacial tension in polymer systems. J Polym Sci Part C Polym Symp 34(1):19-30. doi: 10.1002/ polc.5070340105
Xu Z, Chen L, Huang Y, Li J, Wu X, Li X, Jiao Y (2008) Wettability of carbon ibers modiied by acrylic acid and interface properties of carbon iber/epoxy. Eur Polym J 44(2):494-503. doi: 10.1016/ j.eurpolymj.2007.11.021