THE INTEGRATED SURVEY FOR EXCAVATED ARCHITECTURES: THE COMPLEX
OF CASALNUOVO DISTRICT WITHIN THE WORLD HERITAGE SITE
“
SASSI
”
(MATERA, ITALY)
T. Cardinale a *, R. Valva b, M. Lucarelli c a
PhD Candidate, Dipartimento delle Culture Europee e del Mediterraneo, Università degli Studi della Basilicata, Via Lazzazera Matera, Italy - (tizcardina@hotmail.it)
b
Msc Student, Dipartimento delle Culture Europee e del Mediterraneo, Università degli Studi della Basilicata, Via Lazzazera Matera, Italy - (roby2110_@hotmail.it)
c
Msc Student, Dipartimento delle Culture Europee e del Mediterraneo, Università degli Studi della Basilicata, Via Lazzazera Matera, Italy - (marica.lucarelli@libero.it)
Commission V, WG V/4
KEY WORDS: survey, preservation, 3D modelling, historic heritage, non-destructive techniques
ABSTRACT:
Never as within the complex of Sassi (Matera, South of Italy), the parties have a volumetric material identity and a special construction condition for which, first of all, you need to know the whole to which they give life, and then the individual components and their connections.
In the course of time, in the Lucan city, there were stable and favorable conditions that allowed the development of an architectural language, of juxtaposition of the materials, interpenetration of space and conformation of the volumes, which generated an exceptional urban phenomenon. The distribution of these building artifacts in symbiotic connection with the connective calcareous texture that hosts them , resulted in a spontaneously harmonious figurative balance that characterizes the constructive expedients employed and the distributive and morphological solutions. This is the reason why the Sassi, and the overlooking Park of Rupestrian Churches of Matera Murgia, have been entered in 1993 in the UNESCO World Heritage List.
The complexity of a built space, such as this one, determines the need for a non-traditional approach, so you have to combine last generation tools and canonical ones for survey, drawing and representation, within a dialectic between memory and design, tradition and innovation. For this reason, an appropriate cognitive apparatus has been set up for the entire technical process, making use of different non-destructive and non-contact techniques: digital photogrammetry, total station, laser scanner and thermography, in order to obtain a three-dimensional computer model, useful for the diagnosis and the preservation of the integrity of cultural heritage.
* Corresponding author.
1. INTRODUCTION
1.1 General Instructions
Interpret the signs and put them in conjunction with one or more phenomena is possible if you know the properties of materials and their behaviour in the environment. In this sense, it becomes essential to integrate different methods and tools that can be used not only in the process of understanding and interpretation, but also in those of restitution, in the belief that there is no an “indifferent” survey.
Years of research, survey campaigns and interpretation of the data showed that the Sassi of Matera, emblem of the symbiosis between nature, architecture, energy, at the same time, represent the place where tradition and innovation interpenetrate one to each other, and where digital reality cannot replace the real one, but it just goes to run alongside in a perfect union.
The ability to investigate a so complex reality, on the one hand appears as a challenge regarding the usual approach of the restoration and recovery, on the other one offers an important opportunity for the knowledge, the enhancement and the fruition of cultural landscape of Matera, as well as the defence of everyday life in a site where you can break down the constitutive elements of the matter and of the voids keeping in mind that the whole is not simply the sum of the parts.
Traditional instruments are then complemented by a set of data and procedures resulting from new digital technologies capable of giving life to a model that represents in the most effective and interactive possible way any artefact of historical and artistic interest, opening new possibilities of use, classification and study of cultural heritage.
The geometric, material and thermal survey, together with the possible three-dimensional reconstruction of buildings, forcing operators and users to an effort of interpretation, definition of structure and properties of the object’s surfaces, and survey of the constructive, technology and energy aspects.
These analyses, carried out by subjects who have different skills and expertise, lead to a semantic interpretation of the data obtained from the survey, which is configured as an operation in which, thanks to the observation of form and architectural composition, you can give back the characters that make up the built through a process that uses the act of “drawing” as a way to “understand” and “communicate” architecture.
So we have tried to prepare an appropriate apparatus to support the entire technical process, making use of different strategies of cognitive and non-destructive diagnostic analyses to investigate the built environment. These methodologies can be aimed at the characterization and qualification of degradation by non-invasive techniques in situ, or at cognitive analysis of the architectural work.
2. METHODOLOGY
2.1 THE THERMOGRAFIC MAPPING
Among these ones, the thermography can be used for non-destructive investigations to be performed on site in order to check the moisture in the masonry. The use of this “diagnostic” technique is not intended primarily to the quantitative measure of moisture content in a wall, but allows to delineate qualitatively the mapping of the fronts of moisture and to locate the areas of thermal dispersion and/or storage, pathologies not visible with the naked eye.
Thermography is nothing more than the “drawing of the heat”, that is the graphic representation of the emissions of radiation of a body in the “thermal infrared range”. This representation is carried out by sophisticated electronic devices equipped with particular types of sensors able to convert the signal acquired in the infrared range in a video signal.
The increasingly wide spread of applications in scientific and technical literature shows clearly how in the field of non-destructive investigations, infrared thermography represents, over all, a diagnostic and cognitive technique, extremely versatile and efficient with a very wide horizon of applications.
Reconstruct the history of an artefact, read the constructive characteristics, correlate the state of preservation to the materials that constitute it, are all elements to which the use of infrared thermography is able to offer a significant support.
The use of infrared thermography with well-established and absolutely non-invasive methodologies of acquiring, combined with software tools for image processing can be a valuable aid in the multidisciplinary integrated approach to the knowledge and preservation of architectural artefacts with historical interest, thanks to highlight the discontinuity of physical and thermal properties of materials forming the first few centimetres of the wall.
In this perspective, are then presented the results of several applications within the Rione Casalnuovo in the area of the
Sasso Caveoso (a part of the Sassi complex) in the city of Matera (Figs. 1, 2, 3).
Specifically, the analysis began with the collection of archival and documentary data and continued collecting information on the place, mainly geographical, cultural, historical and constructive. Because of the lack of formal-geometric and physical-constructive documentation, we have included a phase of collection of physical data, despite the difficult practicability and accessibility in the area, with most of the spaces that are closed, sometimes with railings, other times because of partial collapses. We have established some criteria for the selection of case studies and then we have made a photo recognition of the traditional core.
The area has an extension of 27000 square meters (three hectares). Its particular morphology, which meant that it was the place of privileged settlement above all religious communities, is characterized by the rock of the church of Santa Maria dell’Idris
and of San Giovanni (387 meters above sea level) and by the large plateau of the monastery of Santa Lucia alle Malve on which are the remains of a medieval cemetery, and by a path almost flat, at the foot of Mont'Errone at an altitude of approximately 488 mt, which is followed, behind the rocky ridge, by the overhang of the Gravina.
Even today it is particularly evident the conformation of the area, made up of settlements mainly in the cave; architectures above ground, in very limited numbers, over time almost completely saturated the very limited building space, taking shape, in most
cases, as an extension of the cave and then later of the elementary cell-type of vernacular architecture, the lamione, that is the spatial organism basis, then evolved into more complex and original systems: it consists of a very simple rectangular crowned by a barrel vault and is characterized by a jagged gable facade. The wall that closes underground caves is entirely analogous to that which concludes the front of the elementary living cell leaning against the slope. The tens of hundreds of artefacts of this type are characterized by an entrance door and a fanlight for the circulation of air and light in the indoor environment. In the specific case of the heritage, object of interest of this work, the most delicate and difficult case is clearly that of extreme situations of decay and neglect. This is the case of this area in the
Casalnuovo District, which subsequently to the evacuation of the Sassi in the Fifties, in a few years, has seen triggering the sequence of a series of events: infiltration of water from the mantle, collapse of roof structures, involvement of the vertical structures. This situation actually unfortunately covers large areas of the national territory and raises dramatic problems about the possibility of permanence of a “minor” heritage that in many cases, first of all that of Matera, presents characteristics of the material culture and remarkable historical and symbolic values that go completely recovered adapting typologies to the contemporary standards of habitability, health and hygiene. So this is a suggestive urban context of great historical value, constituted precisely not only by monumental buildings, but especially from “minor” buildings that can be treated as decorative elements of a great facade represented by Sassi
context: any intervention will have as its goal the protection of the unicum represented by ancient districts.
So the study of the historical-artistic, archaeological, architectural and environmental heritage, is the prerequisite knowledge to all forms of planning and protection of the area. For this reason, we made use of the thermal mapping of the site that, through detection of quantitative data about temperature, and qualitative ones about humidity, was used to develop a valuable framework concerning the physical, chemical and biological degradation in the Sassi area.
The technique of thermography is an analysis that allows rapid identification of defects. The term thermal mapping means a process of monitoring and capture of thermal anomalies of the buildings through the use of digital sensors (infrared thermography), aimed at defining judgments on the quality of the building envelope and related energy losses.
With the thermographic survey campaign, radiations in the infrared range emitted by the buildings are recorded and, on the basis of these ones, temperatures are calculated and represented in a scale of “false colours”. The final product of this processing performed by the camera depends on the distance between the object to detect and the camera itself and on the angle of the focal lens of the instrument. In outdoor thermographic survey, in most cases one must necessarily resort to multiple thermographic measures and then to different thermal images. Logically, this also affects the spatial resolution of the image (the shorter the distance, the greater the spatial resolution).
From an instrumental point of view, the images were taken using a Fluke Ti32 thermal camera with detector FPA (Focal Plane Array) micro bolometer operating in the long wave spectral range between 8 and 14 microns. Regarding the spatial resolution of the acquisition system, the FPA is equipped with a matrix of sensitive elements of dimensions 320 (H) x 240 (V) with a field of view of 23.0 °(H) x 17.0 °(V) and is capable of producing a thermal resolution minimum equal to or less to 0.45 °C with a precision of the measured temperature of ± 2 °C within a The International Archives of the Photogrammetry, Remote Sensing and Spatial Information Sciences, Volume XL-5/W4, 2015
temperature range of 100 °C (the range of measurable temperatures is between -20 °C and 600 °C). This acquisition system offers, in addition to a remarkable handiness, a spatial resolution that allows to investigate an area of dimensions 314 x 309 mm at a shooting distance of 250 mt. From a methodological point of view shots were taken using the solar source as thermal stimulus analyzing qualitatively the transient that passively is created inside the wall to the combined effect of solar radiation and spontaneous thermo-physical processes affecting the border artefacts.
The particular urban structure of the Sassi, absolutely stratified, has strongly influenced the outdoor technical survey, forcing the operator, unable to stand in the front position with respect to the complex of buildings, just to fractionate shooting of the area in a high number of frames to obtain a higher resolution. This has led to the need to reconstruct the whole after, in post-processing step, in order to homogenize the color response of every single shot, to recompose the elevations, which have been acquired from Piazzale Belvedere of the Park of Churches caves, located frontally to the study area, on the other side of the ravine. In fact the two-dimensional maps of radiometric measurements processed by the acquisition system in images of the spatial distribution of temperature (thermograms) affecting the outer layers of the architectural surface (the accuracy in the return of textures walls and discontinuities is therefore function of thickness, type, material properties forming the wall and entities of the thermal stress).
The mosaic image shows the surface temperature of the casing therefore measured by the camera in a chromatic scale homogenized in the range of assumed values.
These images were processed with the demo version of the dedicated software Microgeo NRG, one of the best software on the market, able to straighten and create mosaics of the thermograms, optimizing the measurement distance from the object and standardizing the values of emissivity, relative humidity, together with the temperature intervals, in order to subsequently be combined into more complex photo mosaics able to return in a unified manner the entire portion consisting of the facades of the Casalnuovo District facing the ravine. Important: you cannot change the focus of the machine and then, in the case of blurry photos, you must repeat the analysis. During post-processing, the obtained image is (geo) - codified and mapped to a reference metric system that allows you to accurately measure the lengths and the surfaces of the represented objects and structures. This superposition of layers is then interrogated within any CAD environment.
Subsequently, the thermal image geometrically exact, is subjected to a procedure of thematic classification of the values with the aim to discretize and account the thermal response for temperature classes. The purpose is to emphasize any heat loss by providing an excellent tool to support the critical analysis of the dispersions.
In this regard it should be emphasized that the thermogram acquired is referred to a very specific moment and represents the thermal response of the building exclusively linked to the time of acquisition.
In order to allow an exhaustive thermographic campaign, we have been complied with recommendations on the boundary conditions: the thermograms were in fact acquired at sunset in a typical day in late June, thus avoiding the risk of misinterpretation, arising from structures directly exposed to solar radiation, with limited variations in wind speed (steady state pressure) and contained differences in internal and external temperature changes (steady state temperature).
Nevertheless, outside, a precise reading is definitely harder than inside since that the data is greatly influenced by the presence of widespread vegetation.
In any case the most evident disease is caused by the internal circulation of moisture and from its evaporation from the surface of the stone, which determines the crystallization of soluble salts contained in it. Another phenomenon of degradation is the washing away of the stone caused by the water of rain, slightly acidic, which, dissolving the calcium carbonate, causes an increase of the surface porosity.
Figure 1. Thermal image of the ravine of an area of the
Casalnuovo District
Figure 2. Mosaicking of thermograms processed with the aid of the software NRG © Microgeo
Figure 3. Results of the thermal mosaicking of a big area of the
Casalnuovo District
2.2 ACTIVE SENSORS: TIME OF FLIGHT LASER SCANNER
Based on light waves, the active sensors realized, as a direct result of the measurement session, a set of three-dimensional coordinates which are related to a high number of points in a reference system correlated with the instrument. Then, the so measured points are determined by polar spherical coordinates which are then returned in Cartesian coordinates. This is possible because the active optical sensors detect the spatial position of the surface or of the measured point, dividing the framed surface in picture elements similar to the pixels of a digital image. The color information can be recorded by the sensor itself or from a digital external integrated camera. Usually, the light source is integrated in the sensor, for this reason the light that invests the object has a defined structure (Fig. 4).
Figure 4. Schematic diagram of a time of flight scanner
The use of this type of controlled light source allows to automate the process of measuring points, which are detected by the sensor itself making repeatable the measuring operation. It is possible to acquire large amounts of three-dimensional data of complex geometries with very high accuracy. You can identify several basic stages for the survey of artifacts: the first phase determines the success of the survey and its metric efficacy and consists of an acquisition project. It is essential the placement of the target, the fixed points that are automatically recognized by the management software of the scans, as each scan is captured with an own reference system. You need at least three targets equal for each pair of scans to be recorded. By paying attention to all the elements that obstruct the recording area you proceed with the acquisition of data. By setting the number of points at a certain distance, you define the scale of the detail to be obtained. Finally there is the processing of data which in turn can be divided into: data filtering, scan registration, extraction of 2D data and/or modeling. Filtering can be done through the manual or automatic elimination of scattered points in the wrong position due to measurement errors; filtering redundant points, or at a distance less than the average of all the mutual distances between the points; elimination of a certain percentage of points to have lower loss of data during the filtering step; reduction of the surface roughness without reducing the number of points. The next step is the registration of two or more clouds of points that is carried out with roto-translational motion of a cloud on the other one performed with the target, automatically recognized, or homologous points selected manually, or with the method of matching surface. After obtaining the complete model, it is possible derive 2D data, such as plans, elevations and sections. By transforming the point cloud into mesh you get a 3D model
that can be textured and, by using dedicated software, the display of these models becomes compatible with any media.
Our study on a part of the Casalnuovo district, consists in obtaining a three-dimensional geometric model, from which to derive sections, elevations, indirect measurements and, more generally, all the graphic elaborations necessary for the representation and subsequent studies.
The instrument used is a laser scanner Leica HDS 3000 (Fig. 5) which has a field of view up to 360 ° x 270 °, integrated digital camera for photographic overlays calibrated automatically. The emitted laser beam reflected on the surface and acquires each point with coordinates XYZ with respect to a local reference system of the own machine. The figure you get is a very detailed point cloud that follows exactly the geometry of the detected object with an accuracy of 6 mm over a distance of 50 mt from the object.
The first phase was that of the design of digital survey. Due to space constraints, it was necessary to spend more time to this stage in order to ensure that the various scans could be recorded without the obstruction of the affected parts by the walls of the corridors.
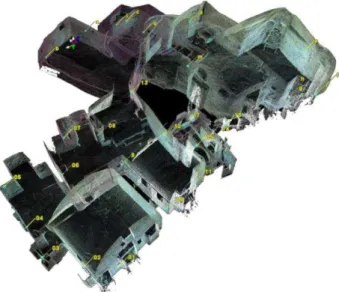
To be sure of being able to firmly connect with each other all the scans, we drew some sketches studying what could be the preferred location for each scan and the relative number of target (Fig. 6) sufficient for a proper registration. Another difficulty was to avoid gray areas to have a complete survey. Due to the complexity of the construction site, we had problems of different brightness between the excavated and constructed environments, therefore it was necessary to adjust the brightness of the instrument to find the right balance between overexposed and underexposed areas. The second phase, that of acquisition, lasted 5 days, with a total of 20 scans. Because of the geometry of space and of time at our disposal, the instrument has been set in order to have a distance between the points of 0,03 mt every 10 mt. The third phase, that of registration, was carried out with the roto-translation of a cloud on the other one through the automatic recognition of target HDS and the superficial matching. To minimize the error, the scans were recorded in groups to then obtain the final one with an error of 5 mm. Once you get the overall cloud of points, there is the creation of 2D drawings (plans, sections and elevations), from which it was possible to obtain all the necessary metrics information (Fig. 7). The next step was to make a 3D model that can be queried by a wide audience for educational, technical and touristic purposes.
Figure 5. Laser scanner used for survey The International Archives of the Photogrammetry, Remote Sensing and Spatial Information Sciences, Volume XL-5/W4, 2015
Figure 6. Identification and positioning of the targets
Figure 7. Plans, sections and elevations
2.3 PHOTOGRAMMETRY AND ANALYSIS AIMED AT THE HERITAGE RECOVERY
The techniques based on passive sensors (image-based methods) use the light in the environment to capture images to be processed later to derive 3D information of the scene observed. For cartographic, architectonic, industrial and archaeological surveys, one of the techniques more used and known is the photogrammetry: science that allows accurate measurements and 3D reconstruction from photographs (images).
Photogrammetry is a non-invasive, low-cost and user-friendly interface that allows you to determine metric information on the size, shape and position of an object or scene, starting from the identification of homologous points in the images. This establishes a geometric relationship between the pictures and the actual scene at the time of shooting, using the mathematical model of collinearity (Fig. 8). You can get 3D metric information on the object through the use of at least two images.
To obtain stereoscopic views and derive 3D information from the areas of overlap in the images, in photogrammetry, similarly to what happens in the human vision, you need to incorporate an object with at least two images taken from different viewpoints. For a good photogrammetric restitution and for data processing are required a proper amount of high-resolution images and a right calibration of the machine, knowing the focal length, the offset of the main point and the parameters of lens distortion. It often happens that the object to represented is too complicated as size or geometry to be detected only through stereoscopic shots; in this case a large number of images, from different points of view around the object and with converging axes, are acquired and oriented simultaneously with the method of the compensation with projective bundles (Fig. 9).
Figure 8. Collinearity
Figure 9. Method of compensating with projective beam
Once captured the images, we proceed with the process of derive metrics and 3D information of a scene:
1. calibration of the camera to determine the internal orientation; 2. triangulation of the images to determine the external orientation;
3. 3D restitution of the scene to derive a unstructured, sparse or dense points cloud;
4. creation of a polygonal geometric structured model (mesh); 5. weaving of the geometric pattern and production of an orthophoto.
In the case of a detailed geometries, such as low-reliefs or statues, are preferred automatic procedures (image matching), capable of extracting a large number of matches (and thus points in 3D) necessary to return the scene with all its geometric details. These techniques are still developing, but the current results testify to the great potential of the method, comparable to those obtained with active optical sensors. For the orientation of the images can be used control points with known coordinates, geometric constraints of various types, or the resulting model can be scaled by direct distance measurements taken directly on the object. The most common commercial software that use this approach allow to obtain coordinates of points, vector restitution, sections and photo-textured models.
The decision to use photogrammetry in the survey of the environments of Casalnuovo, was dictated by the need to analyze and map the present degradation. The laser scanner at our disposal did not allow us to obtain orthophotos of good quality to work for mapping degradation in a consistent manner with the prospect of recovery project of the environments. Precisely for this reason we had to resort to a photogrammetric survey, this time not to get a complete 3D model, but rather to produce orthophotos (Figs. 10, 11) and proceed in the restitution of a more detailed analysis. The texture obtained by the laser did not respond to our needs because the integrated camera was not with high definition and the overlap of the images was not ideal for the various exposures of light dictated by geometry and setting environments. Furthermore photogrammetry has allowed us to obtain an exact texture point by point because it reports pixel by pixel color information, which does not happen in the project images that show the color information on the detected points, but instead take into account regions of space in the vicinity of the point considered.
On the other hand photogrammetric survey was quite difficult because the computers at our disposal were not in accordance with the image processing. In fact we are still working to get all the interior elevations of the observed environments and to complete the mapping of deterioration.
The integration of the techniques is crucial, especially in relation to the resources and to the desire to achieve goals that with the use of only one of the techniques we would not have got, also according to our knowledge and experience in the use of the aforementioned ones.
The recovery of the environments that we analyzed, as in most cases present in the Sassi of Matera, is crucial for the development of a World Heritage Site such this one and it is for this reason that, in our opinion, it is necessary to consider all the possible alternatives analysis in order to achieve consistent considerations.
The degradation factors mainly concern the micro-climatic conditions to which the environments are subjected . The absence of closures makes the internal microclimate particularly influenced by the external one. The mechanisms of alteration of the material are also favored by the porous and tender nature which constitutes the calcareous sandstone. These factors have resulted in the indoor environments degradation phenomena such as:
- stain: localized color variation of the surface, related to the presence of certain natural components of the material (concentration of pyrite in the marbles) and to extraneous material (water, oxidation products of metallic materials, organic substances);
- chromatic alteration: it manifests itself through a variation of one or more parameters that define the color, with different morphologies by referring to large or localized areas;
- biological patina: thin and homogeneous layer caused by the presence of water, mainly consisting of microorganisms, variable to texture, color and adhesion to the substrate;
- exfoliation: formation of one or more laminar portions, of very small thickness and sub-parallel to each other, said layers. It is primarily caused by moisture.
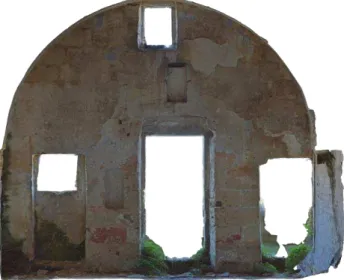
Figure 10. Orthophoto of the interior
Figure 11. Orthophoto of the interior
Figure 12. Degradations mapping
After analyzing the present pathologies (Fig. 12), we moved to the study of the possible recovery interventions. Considering the morphology of the places and respecting the construction techniques, the renovation aims at a cleaning based on the removal of the products of alteration and deposit affecting the surface of the stone. The cleaning will be made with sorghum brush that will not go to affect the surfaces of good consistency. We will proceed with a whitewash, technique of painting or coloring, semi-one coat of lime milk used frequently in the past to protect surfaces. A key aspect to be taken into account are the closures of the environments, the absence of which results in a complete accessibility which obviously creates environmental and human dangers (Fig. 13). In the restoration project were provided suitable closures which also guarantee an improvement of the internal microclimate and are encouraging the protection of the environments. With regard to the coverage of built environments, having been reconstructed in an intervention of the Seventies, does not present big problems of infiltration. The only points where there is the possibility of infiltration are in correspondence of the graft with the masonry realized only with fittings in mortar. Furthermore, the discrete rainfall, the sunshine and the presence of earthy deposits and dust carried by the wind as the result of processes of de-cohesion of the materials, have favored the growth of natural vegetation on the roofs. Indeed terracotta elements of the mantle are hydrophilic in nature and tend to absorb water and encourage the phenomena of delamination of the material. Due to the degradation conditions of the coverage, we are planned interventions aimed at revision of the mantle, reposition and fixation of dispersed elements, removal of vegetation after application of biocide and liberation of the outlets of drain pipes. The interventions take into account the fact that the covering layer rests on a fill in flakes of stone, tiles and earth which ensures breathability but not watertight seal. From the analysis of the elevation we have highlighted the presence of iron elements for the support of the downpipes for the disposal of rainwater coming from the shell. Therefore it is expected the reintroduction of these ones in correspondence to the channels at valley.
Finally we are thinking to work on these areas in order to make them usable, but for this purpose we should increase the size of the project so as not to forget what has been the housing tradition and culture of the Sassi.
Figure 13. The elevation and the absence of the closures
3. RESULTS AND DISCUSSION/CONCLUSIONS
The review and reinterpretation of the reading keys of the historic built, thank to traditional and innovative techniques, according to its original and founding energy-environment capacities allows you to return fully to the buildings the quality that has always distinguished them and to rethink, in a sustainable environment, to intervention, rehabilitation and refurbishment procedures.
REFERENCES
Bagavathiappan S. et al. 2013. Infrared thermography for condition monitoring. A review. Infrared Physics & Technology, 60, pp.35–55.
Barba S., Mage M. A. 2014. Evaluación ex-ante y ex-post de la precisión de un proyecto fotogramétrico. In: EGraFIA 2014
Rosario (ARGENTINA), CUES Vol.I, pp.548-557.
Bixio A., 2010. Il disegno grafico. Dalla rappresentazione Raster al disegno del Logotipo. Edizioni CUES, Salerno.
Cardinale T., Valva R., Lucarelli M., Advanced representation technologies applied to the temple of neptune, the sphinx and the metope in the archaeological park of Paestum, in: International Archives of the Photogrammetry, Remote Sensing and Spatial
Information Sciences, Volume XL-5/W1, 2013 3D-ARCH
2013, pp.35-41.
Fiorillo F., Remondino F., Barba S., Santoriello A., De Vita C. B., Casellato A., 2013. 3D digitization and mapping of heritage monuments and comparison with historical drawings.
International Archives of the Photogrammetry, Remote Sensing
and Spatial Information Sciences. Vol. II-5/W1, pp.133-138.
González-Aguilera D., Rodriguez-Gonzalvez P., Armesto J., Lagüela S. 2012. Novel approach to 3D thermography and energy efficiency evaluation. Energy and Building, 54, pp. 436-443.
Guidi G., Russo M., Beraldin J., 2010. Acquisizione 3D e modellazione poligonale. McGraw-Hill, Milano.
Kordatos E.Z. et al. 2013. Infrared thermographic inspection of murals and characterization of degradation in historic monuments. Construction and Building Materials, 48, pp. 1261-1265.
Kraus K., 2004. Photogrammetry. Geometry from Images and Laser Scan. De Gruyter, Berlin.
Moropoulou A. et al. 2013. Non-destructive techniques as a tool for the protection of built cultural heritage. Construction and
Building Materials, 48, pp. 1222-1239.
Remondino, F., Del Pizzo, S., Kersten, T., Troisi, S., 2012. Low-cost and open-source solutions for automated image orientation – A critical overview. In: EuroMed 2012 Conference, M. Ioannides et al. (Eds.), LNCS 7616, pp. 40-54. Springer, Heidelberg.
Tombari, F., Remondino, F., F., 2013. Feature-based automatic 3D registration for cultural heritage applications. In: IEEE
Conference Digital Heritage 2013, Vol. 1, pp. 55-62.