ADVANCES IN MULTI-SENSOR SCANNING AND VISUALIZATION OF COMPLEX
PLANTS: THE UTMOST CASE OF A REACTOR BUILDING
J.-F. Hullo a, *, G. Thibault a, C. Boucheny a
a
EDF R&D, EDF Lab
1 avenue du Général de Gaulle, 92141 Clamart, France ([email protected], [email protected], [email protected])
Commission V, WG V/4
KEY WORDS: 3D as-built reconstruction, multi-source data, terrestrial laser scanner, panoramic images, 2D and 3D CAD models, virtual mock-up, complex scenes visualization
ABSTRACT:
In a context of increased maintenance operations and workers generational renewal, a nuclear owner and operator like Electricité de France (EDF) is interested in the scaling up of tools and methods of “as-built virtual reality” for larger buildings and wider audiences. However, acquisition and sharing of as-built data on a large scale (large and complex multi-floored buildings) challenge current scientific and technical capacities.
In this paper, we first present a state of the art of scanning tools and methods for industrial plants with very complex architecture. Then, we introduce the inner characteristics of the multi-sensor scanning and visualization of the interior of the most complex building of a power plant: a nuclear reactor building. We introduce several developments that made possible a first complete survey of such a large building, from acquisition, processing and fusion of multiple data sources (3D laser scans, total-station survey, RGB panoramic, 2D floor plans, 3D CAD as-built models). In addition, we present the concepts of a smart application developed for the painless exploration of the whole dataset. The goal of this application is to help professionals, unfamiliar with the manipulation of such datasets, to take into account spatial constraints induced by the building complexity while preparing maintenance operations. Finally, we discuss the main feedbacks of this large experiment, the remaining issues for the generalization of such large scale surveys and the future technical and scientific challenges in the field of industrial “virtual reality”.
* Corresponding author.
1. INTRODUCTION
Dense scanning methods are used for more than 20 years in the industry for different specific needs related to maintenance to describe the actual shape of a facility, with its obstacles and free spaces, to help handling, storage, replacement or change of important components of the plant.
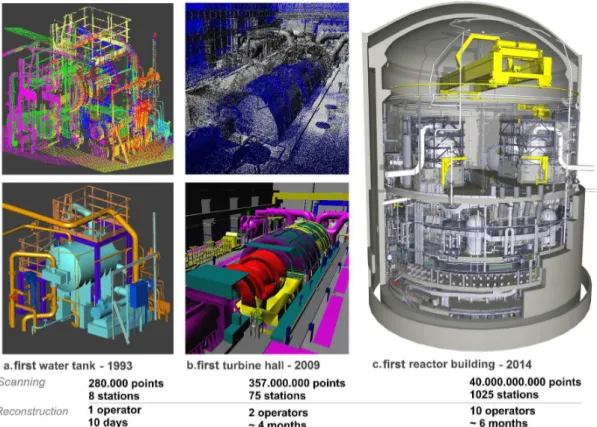
Figure 1
illustrates the history of challenges in acquisition of as-built data at EDF in the last twenty years (1993-2014).The contributions of this paper are the following:
A state of the art of tools and methods for acquisition and processing of as-built data in complex indoor facilities, based on a twenty years experience of as-built data production within our company,
Results and analysis of a large scale experiment: a first dense multi-sensor scanning survey of a whole nuclear reactor building (1000+ stations),
Recommendations and examples for developing dedicated applications of virtual visits of complex architectures using multiple data types,
Listing of the remaining bottlenecks and challenges for the perspective of a generalization of large and dense multi-sensor scanning surveys.
2. STATE-OF-THE-ART OF RECONSTRUCTION
AND VISUALIZATION OF COMPLEX INDUSTRIAL SCENES
2.1 Specific aspects of the scanning of industrial indoors
The characteristics of industrial environments, in their shapes (congested, with a huge number of objects, whose manufactured geometries correspond to a set of 3D primitives like cylinders, boxes, etc.), their surfaces (objects sometimes very reflective or with very dark albedos) and accessibility (on-site restricted access time, difficult conditions of temperature and vibrations) have led to the development of dedicated tools for acquisition and processing, such as Terrestrial Laser Scanning in the 1990’s, cf. [Pot et al., 1997] and Figure 1.a.
Unfortunately, and because of the specificities of industrial environments, many developments intended for the scan of non-industrial scenes (natural, outdoor, less congested or unstructured environments) have not provided answers for all bottlenecks for dense scanning of large-scale industrial scenes: accuracy of the raw points for a large spectrum of albedos, accuracy of registration and referencing as well as productivity of 3D reconstruction.
2.2 State of the art of large scale dense scanning surveys
Recent breakthroughs allowed the perspective of a first very large-scale and multi-sensor scanning, from acquisition and procession to data integration in a dedicated application.
Regarding the acquisition, photogrammetric and lasergrammetric tools and methods have significantly increased in quality and speed of acquisition in the past few years. Motorized heads with full frame DLSR can generate panoramas of half-billion of pixels in 5 minutes [Kopf et al., 2007] with a high automation rate in stitching and HDR rendering. Phase based laser scanners can capture roughly the same time a 50 million point cloud of mid-range measurements (< 1 m to 50 m). On most objects surfaces, depth measurements in this range are under 1 cm in that range, [Barras et al., 2013]. However, surfaces of some industrial objects do not correspond to the calibration standard ranges (albedo, reflectance and incidence angle) and leads to significant measurement errors [Voegtle and Wakaluk, 2009]. A part of these errors can be filtered automatically (comet-tailed effect, outliers) though another, sometimes non negligible part, can only be removed through manual segmentation (multi-reflections on specular surfaces in particular).
Regarding registration of data, indoor passive geolocation systems do not offer centimetric accuracy for portable devices. Today, best lightweight sensors can lead to a 1 % tolerance of the trajectory, which is still not accurate enough for laser scans and need to be frequently reset on known positions to reduce shift error (though this step can be done automatically using existing maps and checkpoints : doors, ladders, stairs). However, these sensors can be used either for a first approximation of position and orientation of laser scans, either for positioning roughly the panoramic images.
Fine registration of laser dataset is an open and active research topic. For complex buildings, cloud to cloud approaches such as ICP and variants, that have a great automation rate, cannot be used for several reasons. First, due to the proximity of objects, a small relative change in scanner position induces strong differences on point clouds. Thus cloud to cloud constraints cannot, by definition, lead to accurate and confident results. Secondly, these approaches cannot take into account datum constraints for data referencing without a great loss of automation. Finally, these approaches are nor efficient neither robust for very large datasets (dozens of hundreds of stations). Currently, only the target-based registration and referencing, paired with a total station survey for datum constraints, allow the fine registration of hundreds of laser scans (3σ = +/- 2 cm) at the scale of a 10-floors building.
Finally, recent improvements in semi-automatic tools for 3D reconstruction from large point clouds (dozens of billions) have made possible the ‘as-built’ reconstruction of a full mock-up. Without recent out-of-core algorithms, processing billions of 3D points would be impossible [Elseberg and al., 2013]. But since high density can be used, semi-automatic algorithm (region-growing, RANSAC) for primitive fitting performs better in a reasonable time. These algorithms are also valuable in quality monitoring thanks to their statistics (standard deviation of fitting, number of points used, etc.) and are generraly preferred to more manual reconstruction tools (free adjustment or point snapping).
Despite these improvements, the review of the state of the art for complex indoor dense scanning surveys and reconstruction leads to the statement that both current tools and methods available today have not been designed for very large dataset; that’s why scaling up still remains a great challenge.
Figure 1: Review of 3 breakthroughs projects (1993-2014) of as-built reconstruction from laser scanning data of industrial facilities at EDF.
2.3 Challenges in the acquisition and visualization of multi-sensors, multi-users, multi-sources and multi-epochs dataset
But scaling-up the size of scanning survey is not the only challenge for the industry: the increasing number and profiles of end-users of as-built data is another one. Indeed, the set of data (floor plans, 3D models, panoramic photographs, laser scans) required to truthfully represent the complexity of an industrial facility is too large and complex to be shared without care to non-expert professionals. Consolidation of all these data in a sole “database” requires a lot of semi-automatic processes, smart enough to ensure consistency as well as to detect differences between epochs. Once the data is consolidated, the development of user interfaces might be carried out with respect to the experience of different end-users, profiles and needs (users have heterogeneous skills for visualization and exploration of 2D/3D topographic representations of a complex environment).
This statement led to the design of dedicated software tools (see § 5) to help professional users explore and exploit these data, with annotations, distance measurements, specific rendering, path finding, etc.
3. THE MOST COMPLEX BUILDING OF A 1300 MW POWER PLANT AS AN UTMOST CASE STUDY:
THE REACTOR BUILDING
3.1 Context of the experiment
In the wake of several research projects that contributed to the development of tools and methods of dense scanning [Girardeau-Montaut et al., 2005], [Bey et al., 2011] or [Hullo et al., 2012] as well as tools for the visualization of complex dataset [Boucheny, 2009], EDF carried out a first very large-scale experiment in the most complex building of a 1300 MW nuclear power plant: a reactor building.
The goal was to assess the effective performance (quality, costs and speed) of current tools and best-practices through an important research project launched in 2013, in order to state on the generalization of multi-sensor scanning of power plants and underline remaining bottlenecks. Another goal was to maximize the benefit of this dataset for the company, especially by sharing it to as many users as possible to help them in their daily work.
Thus, to meet the needs of many jobs of maintenance and operations, a dense multi-sensor survey (total stations, laser scanning and panoramic RGB) was carried out during summer 2013.
3.2 Description of the building architecture
That reactor building, whose shape is cylindrical, consists in 11 floors with complementary ground heights in each of them. Moreover, the main part of the 100+ rooms of the building is particularly congested and many are also only accessible through ladders.
Regarding the environmental conditions, exploring and scanning such environments is constrained by poor lightning, restrictions of access and congestion due to the equipments of the plant itself. Key numbers of the multi-sensor scanning survey are shown in Figure 2.
Figure 2 : Key numbers of the multi-sensor scanning survey of a nuclear reactor building; the main order of magnitude that may be highlighted is number of stations: more than 1000 stations (for more details see [Hullo and Thibault, 2014]).
As detailed in [Hullo and Thibault, 2014], thanks to some specific evolutions and developments of the tools and methods to take into account the scaling up, and with an important number of operators (5 laser scanning surveyors and 3 photographers) this acquisition phase has shown the feasibility of such surveys. This experiment also underlined some brakes on the generalization of current post-processing tools and methods in terms of qualities, times or costs (fine registration of large laser scanner dataset, quality monitoring and validation tools, issues in formats, storage and data sharing).
To illustrate the complexity of fine registration of laser scans in complex architectures, we show in Figure 3 a view of the 3D network used in the adjustment. This experiment has also underlined the lack of robustness of weighted least squares in such large blocks and the need to work with 3D topographic networks instead of 2.5D. Unfortunately, though at the state of the art, the registration tool we have used implements a basic version of least squares algorithm and lacks of tools for blunder detection, error propagation and quality monitoring.
Figure 3 : 3D network used in the adjustment phase of the registration of laser scans, composed of scan stations (red), measurement of registration spheres from these stations (blue lines) and datum spheres for referencing (green).
4. IMPROVING PRODUCTIVITY OF THE AS-BUILT CAD RECONSTRUCTION: QUALITIES, TIMES, COSTS
As shown in bottom of Figure 2, the CAD reconstruction still represents the main budget in the production process of as-built data and
4.1 Impact of building size in task definition and planning for 3D reconstruction
A large dataset of 40 billions of 3D points was used to reconstruct an as-built 3D CAD model of the plant (see Figure 4). In order to fulfil the many needs of end-users, the quality levels of produced 3D data had to be defined in accordance with their intended uses: maintenance tasks planning (including the associated logistics: easements access, scaffolds, handling areas), workers safety, virtual tour for low accessibility rooms by inexperienced professionals.
The consequences of this multiplicity of needs led to a detail specification for reconstruction task depending on object type: fitting tolerances, naming, methods (cloud least-square fitting, region growing cloud-shape fitting, cloud snapping, copies). Tolerances for reconstruction vary from +/- 2 cm on door edges to +4 cm / -50 cm on shapes representing obstacles on pathways (+ outside / - inside maximum error in the reconstructed shape).
The use of panoramic RGB images was very valuable for the reconstruction process to help understanding complex areas.
In order to face the huge amount of work and to reduce time of data delivery, the 3D CAD reconstruction had to be split and parallelized by sectors, and then allocated to a semi-dozen of CAD operators for several months. To reach and certify the quality of reconstructed as-built model, a level-2 check procedure was carried out by two independent operators and led to iterations and re-work. This validation was performed thanks to mesh-cloud distance computations, for example using a software originally implemented by EDF R&D and Telecom ParisTech (CloudCompare, [Girardeau-Montaut et al., 2005]) and by using ‘out-of-core’ technologies to display a maximum amount of points for the visual inspection, guided by the analysis of a SQL database storing the standard deviations of each reconstructed geometry (~60.000 objects).
4.2 A level-2 procedure for quality control of large datasets
We mentioned the use of a procedure for quality control of large as-built dataset (laser scans, RGB panoramic or 3D CAD model). These level-2 procedures are a standard for quality monitoring and to detect non-conforming materials. Our experiment has shown their usefulness. In several breakpoints, we have thus implemented it in the following manner:
Level 1: data creator checks 100 % of the dataset and document it
Level 2: project management performs spot checks both on areas of interest and randomly on the whole dataset.
Due to the important rate of human actions in the processes and the size of the dataset, at least 2 iterations are generally needed to reach quality levels.
4.3 2D maps update and analysis as a “graph database” of the plant
A global model of the plant is a key data for designing the structure of the dataset, unify the names of the objects and perform analysis on it. By constructing a graph of the various objects and some relationships (adjacency, verticality, inclusion, etc.), it makes possible to answer questions like these:
What are the panoramic images taken in the rooms adjacent to a specific one?
Can I access to a specific location in the building without taking ladders?
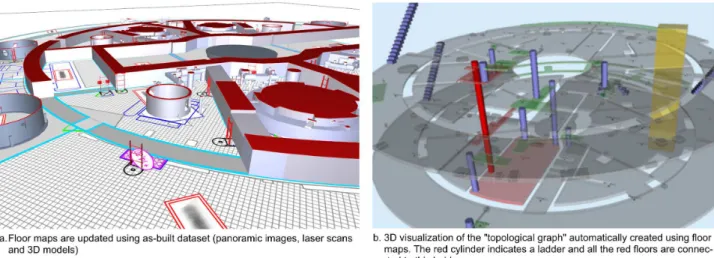
This entire graph database was built by using 2D floor plans, updated using the 3D dataset: walls, grounds, ladders, stairs and many others, see Figure 5.a. These as-built floor plans were then automatically processed to extract all the required information and build a “topological graph” describing several properties of the installation (shape, location, names, types, navigation and access, etc.) as well as render dedicated basemaps. A previous example of this kind of approach can be seen in [Whiting, 2006]. This graph is then used within the applications to answer queries on the semantic, geometric or topological properties of the buildings and its components, cf. Figure 5.b.
Figure 4: Dense data sources used for as-built reconstruction of the nuclear reactor building from point clouds. Each type of 3D object is reconstructed with specific rules (fitting tolerances and naming codification).
Figure 5: 2D as-built floor maps (a.) updated using the 3D as-built dataset and (b.) processed to create a semantic, geometric and topological representation of the building.
4.4 Recommendations and remaining bottlenecks
Even for a company with over 20 years experience in the field of as-built documentation, a multi sensor and dense scanning survey at the size of a whole 10-floors building remains a challenges for which tools and methods have not been designed for.
In addition to the several recommendations and choices that were exposed in the previous paragraphs, our experiment highlighted some specific aspects of large and multi-sensor scanning surveys of complex architectures. For these projects that answers the growing need of as-built data for professionals, we recommend to:
Specify in detail the needs, requirements and constraints. At the scale of a building, every misunderstanding or fuzzy specification may have a strong impact on costs, qualities or durations. Document every step of the process and perform
quality monitoring from the beginning to both help fixing non-conformal data and enrich the dataset for future use.
Parallelize as much as possible the tasks (acquisition and post-processing). When the data production lengthens, the number of non-qualities increases greatly.
Regarding remaining bottlenecks, we have mentioned several technical brakes to generalization of current tools and methods for large and complex buildings. We have also discussed the 3 axis of the 3D reconstruction: costs, durations and qualities. Actually, only the third one is a goal: the first two only are an answer to the third. By performing rigorous quality monitoring and control, each dataset can be produced with a great level of confidence.
Indeed, the main drawback for reaching expected quality levels is the difficult inter-validation of data sources. To perform such a control procedure, the dataset needs to be merged and visualised all together. But due to current tools and formats limitations, this fusion and exhaustive check of multi-sources dataset remain very complex with poor automation and loss rates in conversions.
5. HELPING THE GREATEST NUMBER OF
WORKERS BY SMART MULTI-DATA VISUALIZATION
In the previous sections, we have detailed the challenges for the production of data representing a complex building. Due to that complexity and the intended uses, multiple types of data are required: high resolution panoramic RGB, laser scans, 3D as-built CAD model and 2D floor plans. Once the dataset is completed, issues remain in the visualization and exploration, taking into account that users may not be familiar with this various data types.
5.1 State-of-the art of multi-data visualization for complex architectures
By nature, each data source represents only one aspect of the reality of the plant and fulfills some needs among many. The co-visualization of the multiple data sources is therefore required to assist and help workers finding answers to their daily jobs. Over the past years, several solutions have been proposed for the problem of multi-source as-built data visualization:
virtual tours with floor plans and panoramic RGB [Koehl et al., 2013],
navigation through several laser spherical views, navigation and path calculation in 3D environment,
for instance in 3D videogames or 2.5D cartography services such as Google Maps indoor.
However, none of these solutions integrates all the data sources required to represent some complex buildings such as a nuclear reactor building and easily navigate across the large dataset. Indeed, apart from the constraints of technical integration, the complexity of the plant itself is an issue for virtual navigation (multiple levels with multiple floors) and requires a specific interaction design to handle it.
5.2 Rules for the development of virtual visits of a complex plant
Our goal is to develop an application which can be valuable to many people working in nuclear plants, taking into account that
the targeted building is rarely accessible. Potential values include the following scenarios:
Improvement of the efficiency of maintenance operations via a consolidated preparation stage that takes into account the spatial constraints of the environment; this requires the collaboration of different teams around a shared representation of the environment (e.g. mechanical workers defining their needs in scaffoldings).
Improvement of the accuracy and reduction time in engineering studies to prepare modifications of the plant, with limited needs for the teams to go into the facility.
Ability for many recently hired workers to be familiarized more rapidly with their working environment through dedicated training sessions, including tutoring stages.
These few scenarios illustrate the variety of user profiles that should be considered for the common visualization we wish to design. Many of them are not familiar with the handling of complex datasets, and their use of the tool may be very occasional, which enforces the need for user friendly and simple interfaces.
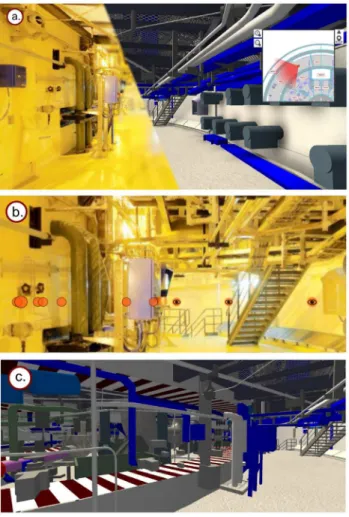
Figure 6: Multi-source data exploration and navigation in a complex building: example of key principles for the development of an application
To address this problem, several principles have been selected for the development of the navigation interface within our application (as illustrated in the Figure 6):
Multi-view synchronization across multi-source dataset, with the possibility at any time to move from one view to another without losing user position/orientation (shared, unique position of the user in the environment).
Ability to explore the building in its vertical dimension, which is required by tasks such as the handling of heavy equipments.
Fine processing and registration of 2D-3D data sources for high legibility and fluent user experience, with ensuring the consistency of the various sources.
For instance, we estimate that in the synchronized muti-view experience the spherical photographs need to be positioned in the virtual environment with a tolerance of 50 cm and 5°. This range of accuracy seems sufficient to help users focusing on their task, by not being disturbed by some inaccuracies of the transitions when switching between views. Furthermore, the verticality of the panoramic images must be known with an error under 5° otherwise the navigation becomes very uncomfortable.
In addition to the navigation features, we provide specific interactions with the dataset to the users. Each feature has been designed accordingly to the user’s needs. To implement them, we carried out several iterations with the users to overcome the technical feasibility and genuinely create powerful and smart tools. Among these, we can mention distance measurements on 3D CAD models (perpendicularly to the normals, vertical constrained or free), annotations and snapshots in every dataview, interactive section of walls or project management. In all these developments, a large number of feedbacks have been collected in a dynamic development process to reach an optimal user benefit.
6. CONCLUSION & FUTURE WORK
Professional uses of as-built documentation have recently increased in a significant manner, inducing two major challenges: scaling up dense and multi-sensors scanning surveys to a whole building and share this dataset to a very large audience.
In this paper, we have presented a large scale experiment in a 10+ floors 1300 MW nuclear reactor building. From acquisition of 1000+ co-stations (RGB panoramic and laser scans) to 3D as-built reconstruction, the project has involved many contributors for almost a year and a half. In every step, quality requirements have stressed out tools and methods. A first application has been developed to help many professionals in their daily job by helping them exploring virtually the plant through many data types.
We can summarize the contributions of our work in 3 points: Assessing the feasibility, as well as underlining the
current complexity, of scaling-up state-of-the art tools for multi-sensor scanning of industrial environments (1000+ stations). Best practices still need to be improved to carry out the survey of a whole nuclear reactor building with a great level of confidence in the quality, costs and duration of such surveys.
Highlighting weak steps in the production workflow: registration and processing of large laser scanner datasets, quality monitoring, quality control and inter-validation of multiple data sources.
Sharing our feedback on the development of multi-source data visualization and navigation applications in complex buildings with recommendations for general principles applied to virtual tours.
On the base of these findings, future work is planned in order to reduce the remaining issues:
Improving data registration/referencing procedures and algorithms to ensure a confident level of quality, for both laser scans and HD panoramic images. Developing new tools for data validation and
consistency across a large multi-source dataset. Collect user feedbacks on our first prototypes of
applications and still better use consistency of dataset to enrich user experience.
However, some serious bottlenecks remain and seem farther away from the current state of the art:
How could we increase significantly (benefit >50% of current cost) productivity of 3D as-built CAD models from very large point clouds (hundreds of billions ? ) Which procedures and resources should be employed
to update a large multi-sensor dataset and detect errors or inconsistencies between two epochs?
References
Barras V., Delley N. and Chapotte G. (2013) Analyses aux limites des scanners laser terrestres. Revue de l’Assiocation Française de Topographie, XYZ number 137, pages 19-26.
Bey A., Chaine R., Marc R., Thibault G., Akkouche S. (2011) Reconstruction of consistent 3D CAD models from point cloud data using a priori CAD models. Proceedings of the ISPRS Laser Scanning 2011, Calgary, Canada.
Boucheny, C. (2009). Interactive scientific visualization of large datasets: towards a perceptive-based approach. PhD Thesis, Université Joseph Fourier (in French only).
Girardeau-Montaut D., Roux M., Marc R., and Thibault G. (2005). Change detection on points cloud data acquired with a ground laser scanner. International Archives of the Photogrammetry, Remote Sensing and Spatial Information Sciences, 36, 30–35.
Elseberg J., Borrmann D. and Nüchter A. (2013) One billion points in the cloud – an octree for efficient processing of 3D laser scans. ISPRS Journal of Photogrammetry and Remote Sensing. Volume 76, February 2013, Pages 76–88.
Hullo J.-F. And Thibault, G. (2014). Scaling up close-range surveys: a challenge for the generalization of as-built data in industrial applications - The International Archives of the Photogrammetry, Remote Sensing and Spatial Information Sciences, ISPRS Technical Commission V Symposium , Riva del Garda, Italy.
Hullo J.-F., Grussenmeyer P., Landes T. and Thibault G. (2012). Probabilistic Feature Matching Applied to Primitive based Registration of TLS Data. XXII ISPRS Congress - ISPRS Annals of the Photogrammetry, Remote Sensing and Spatial Information Sciences, Volume I-3, Melbourne, Australy, August 25 - September 1st 2012.
Kopf J., Uyttendaele M., Deussen O. and Cohen M. (2007). Capturing and viewing gigapixel images. ACM Transactions on Graphics (Proceedings of SIGGRAPH 2007), volume 26 issue 3, article 93.
Koehl M., Scheider A., Fritsch E., Fritsch F., Rachebi A. and Guillemin S. (2013) Documentation of historical building via virtual tour: the complex building of baths in Strasbourg. ISPRS Archives, Volume XL-5/W2, XXIV International CIPA Symposium, pages 385-390.
Pot J., Thibault G., & Levesque P. (1997). Techniques for CAD reconstruction of 'as-built' environments and application to preparing for dismantling of plants. Nuclear Engineering and Design, Issue I, 135-143.
Thibault, G., Pasqualotto, A., Vidal, M., Droulez, J., & Berthoz, A. (2013). How does horizontal and vertical navigation influence spatial memory of multifloored environments? Attention, Perception & Psychophsics, 75, 10-15.
Voegtle T. and Wakaluk S. (2009) Effects on the measurements of the terrestrial laser scanner HDS 6000 (Leica) caused by different object materials. Laser scanning 2009, IAPRS, Vol. XXXVIII, Part 3/W8 – Paris, France, September 1-2, 2009.
Whiting E. (2006). Geometric, topological & semantic analysis of multi-building floor plan data, Thesis (S.M.)--Massachusetts Institute of Technology, Dept. of Architecture, 2006.
![Figure 2 : Key numbers of the multi-sensor scanning survey of a nuclear reactor building; the main order of magnitude that may be highlighted is number of stations: more than 1000 stations (for more details see [Hullo and Thibault, 2014])](https://thumb-eu.123doks.com/thumbv2/123dok_br/17160380.240655/3.892.463.780.125.409/figure-scanning-building-magnitude-highlighted-stations-stations-thibault.webp)