OptiCal inveStigatiOnS Of la
0.7Ca
0.3-xK
xMnO
3(x = 0.00, 0.05 and 0.10) prObed by SpeCtrOSCOpiC
ellipSOMetry
#n. Sdiri, a. bOuKhaCheM*, e. dhahri
Laboratoire de Physique Appliquée, Faculté des Sciences de Sfax, Tunisia *Unité de physique des dispositifs à semi-conducteurs,
Faculté des sciences de Tunis, Université de Tunis El Manar, 2092 Tunis, Tunisia
#e-mail: [email protected]
Submitted June 11, 2011; accepted March 15, 2012
Keywords: K doped manganites, Spectroscopic ellipsometry, Complex index, dispersion, phase transition
Using spectroscopic ellipsometry, we have studied the optical properties of doped manganites at the paramagnetic state in polycrystalline La0.7Ca0.3-xKxMnO3 samples for (x = 0.00, 0.05 and 0.10) in the energy range of 3.2-5.5 eV at room temperature. The surface morphology of the samples was obtained by using atomic force microscopy (AFM). Refractive indices, extinction coeficients, the transmission ellipsometric parameters Ψ and Δ are investigated at different wavelengths. The study of the optical conductivity σ reveals that optical behaviour and the activated transport in the paramagnetic state of these materials are consistent with Jahn-Teller small polaron. In addition, the spectrum of the complex dielectric constant ε reveals peaks for all samples, the results may be explained by the presence of space charges from the strongly dipole-allowed O(2p)−Mn(3d) transition.
intrOduCtiOn
Since the discovery of the extraordinary high mag-netoresistance effect in the ilms of la0.7ba0.3MnO3 by
helmolt et al [1], properties of doped manganites have been focal point of the research in correlated electronic systems. divalent cation doping induces a change from Mn3+ to Mn4+. the induced holes in the e
g level create
a mixed-valence system. Optical spectroscopy, in both single crystals and thin ilms, has contributed to unravel the complex physics and provided insight into the importance of electron-phonon coupling arising from Jahn-teller (Jt) distortions for modelling the optical conductivity in the manganites [2, 3]. the Jt lattice distortion, in particular, is thought to be larger in the paramagnetic (pM) phase (above the Curie tempera- ture tC). thus, the MnO6 octahedra are highly distorted
for t > tC [4, 5]. this effect can be explained by changing
the average of the atom at the a and/or b site.
the spectroscopic ellipsometry (Se) is a very po-werful and non-destructive technique to investigate optical properties of the both bulk materials and thin ilms. in this paper by using the (Se), we’ve studied the effect of monovalent K+ ion substitution for divalent
Ca2+ ion on the optical properties of polycrystalline
la0.7Ca0.3-xKxMnO3 compounds, at room temperature for
the (pM) semiconductor phase. results of investigations of magnetic and electric properties of these compounds have been reported in recent papers [6, 7].
ellipsometers relect polarized light from a thin ilm, multilayer, or bulk material and detect the change in polarization introduced by the sample. the measurement is expressed as yand, d which are related to the fresnel relection coeficients by: [8-10]
(1) where rp is the ratio of the e-ield amplitudes after
and before relection of light with e-ield in the plane of incidence. and rs is the same, but for light with the
e-ield perpendicular to the plane of incidence.
in addition, Δ is related to the relative phase shift of the parallel and perpendicular polarization compo-nents of light on relection and Ψ is related to the change of the amplitude ratio of the two components. the angles Ψ and Δ are such as (0 ≤ y ≤ π/2, 0 ≤ d≤ 2π).
first, ellipsometric measurements for the single crystalline laMnO3 samples were performed by
losh-kareva et al [11] at room temperature and for the spectral range 1.0-5.0ev. later on, the ellipsometric measurements were performed for an untwined crystal of laMnO3 by Kovaleva et al. [12] in a wide
temperatu-re range. the authors have ptemperatu-resented a detailed quanti-tative analysis of the pronounced redistribution of the spectral weight (SW) near the néel temperature. they concluded that the low-energy optical transition around 2 ev consists of three distinct bands all assigned to inter- site d-d transitions, and that laMnO3 is Mott-hubbard
~
ɶ ɶɶ ρ =rp
rather than a charge transfer p-d insulator as argued earlier [13]. a similar interpretation of spectral features near 2 ev observed in multiferroic tbMnO3 has been
reported very recently by bastjan et al [14]. in addition g. J. babonas el al [15] have studied electronic tran-sitions and optical features in erMnO3 sample with
ellipsometric method.
experiMental prOCedureS and theOretiCal eStiMatiOnS
powder samples of la0.7Ca0.3-xKxMnO3 (x = 0.00,
0.05 and 0.10) were synthesized using the standard solid-state reaction method at high temperature, by mixing la2O3, CaCO3, K2CO3 and MnO2 up to 99% purity in
the desired proportions, the starting materials were intimately mixed and heated in air at 1273 K for 72 hours. the obtained powders were pressed into pellets, under 4 tonnes/cm2 of (7-8mm in diameter, 1mm thickness)
and sintered at 1373 K in air for 60 hours with interme-diate regrinding and repelling. finally, these pellets were rapidly quenched to room temperature in air in order to freeze the structure at the annealed temperature.
the polycrystalline la0.7Ca0.3-xKxMnO3 compounds
were characterised by x-ray diffraction (xrd) at room temperature. the xrd results are discussed and pre-sented in our previous work [6]. We have found that for x = 0.00 and 0.05, compounds present an orthorhombic structure with pnma space group. this structure becomes rhombohedral with r3¯ c space group for x = 0.10 [6].
an atomic force microscope (afM) was used at room temperature to resolve the characteristics of the surface.
Spectroscopic ellipsometery measurements on the samples were performed at room temperature using an automatic ellipsometer SOpra geS 5e. the system uses a 75 W xenon lamp (185-2000nm), a rotating polari-zer, an auto tracking analypolari-zer, a double monochhromator, and a single-photon-counting photomultiplier detector. data were collected in a spectral range of 225.6-387.8 nm (3.2-5.5 ev) at an angle of 70°. Most surfaces are not perfectly smooth at amicroscopic level. the surface roughness has a great inluence on the measured data and one might wonder: how is the angle of incidence deined for a rough surface?
to estimate the error on ρ~ it is possible to calculate the relative error ∂Δ/∂θ and ∂Ψ/∂θ on a digital computer.
for that, if ρ is known, Ψ and Δ can be determined by separating equation (1) into its real and imaginary parts, i.e.,
re(ρ) + jim(ρ) = tanΨ cosΔ + j tanΨ sinΔ (2) where re(ρ) and im(ρ) are the real and imaginary parts of ρ, respectively.
for a clean isotropic surface, the ratio of the ref-lection coeficients is given by [16].
(3) where ñ0 = n0 + ik0 is the complex refractive index of
the medium in which the specimen is immersed, and ñ = n + ik is the complex refractive index of the specimen.
taking the partial derivative of equation (3) with respect to θ, we obtain:
(4)
the error of ρ due to changes of the angle of in-cidence was estimated on a level of 1%.
the calculation of the real and imaginary parts of ρ~ is easily performed on a digital computer.
the optical constants of clean surfaces are derived from absolute values of the ellipsometric parameters Δ and Ψ.
from ellipsometric measurements one can deter-mine the index of refraction n and the extinction coefi-cient k which represent the real and imaginary part of the complex refractive index ñ(ν) = n(ν) + ik(ν) [17,19] where ν is the frequency of the incident light.
reSultS and diSCuSSiOn afM measurements
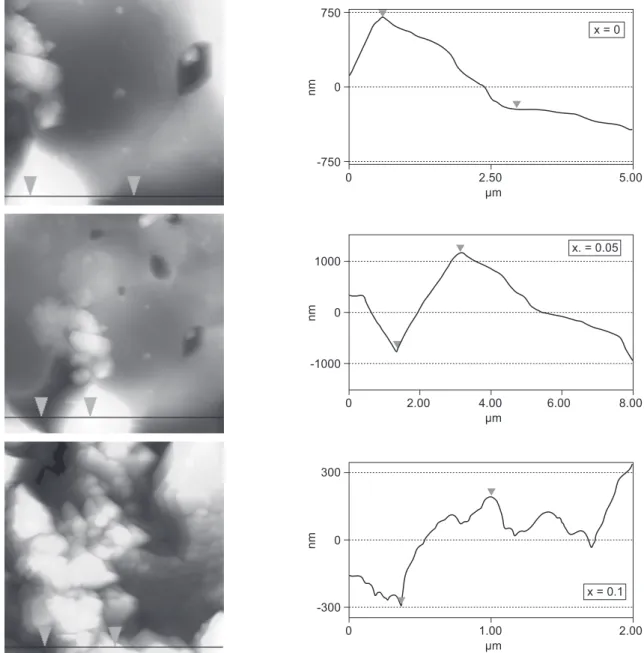
the afM images in figure 1 show cross-sections of representative samples (la0.7Ca0.3-xKxMnO3 (x = 0.00,
0.05 and 0.10). We have observed smaller grain sizes in samples with higher x. Moreover, the cross-sections through the samples show that the root mean square (rMS) values are 2300 nm, 2000 nm, and 667 nm and the average peak-to-valley distance (apvd) is 756 nm, 750 nm, and 725 nm for (x = 0.00, 0.05 and 0.10) re-spectively. therefore, the results show that rMS and apvd decrease with increasing K content.
Complex refractive indices
the complex refractive index determined from ellipsometric measurements ñ = n + ik of la0.7Ca0.3-xKx
MnO3 (x = 0.00, 0.05 and 0.10) is plotted versus energy
e in figures 2a-c.
Comparing the optical constants of three samples of la0.7Ca0.3-xKxMnO3 (x = 0.00, 0.05 and 0.10) for any
energy, we can ind that the refractive index n increases due to increased K doping. Simultaneously, a maximum value of n shifts to higher energy. the absorption edges of the samples determined from the spectra of the extinction coeficient in figure 2 slightly shift to higher energies. these curves show that the transparent range changes with K doping, but the absorption edges do not almost
ɶ
ρ = [sin
θ tang θ – (ñ2 – ñ 0 2
sin2θ)½]
[sin θ tang θ + (ñ2 – ñ 0 2
sin2θ)½]
= 2sin θ
ɶ
∂ρ ∂θ
tan2θ (ñ2 – ñ 0 2 ) + 2ñ2
(ñ2 – ñ 0 2
vary. this feature is probably due to the increasing of the Mn−O bond distance and the Mn−O−Mn bond angle with K doping [6].
these results are in good agreement with those of other abO3-type perovskite compounds. because of
the similar bO6 (for this work MnO6) octahedron unit
structure, they have analogous energy band structure determining the refractive indices [18-21].
Spectral dependence of the refractive index in fi-gure 2 also reveal peaks in uv band of photon energy.
the spectra of the refractive-index in figure 2 show that the refractive-index dispersion in the samples is not monotone. the different form of the curve in figure 2c can be explained structural transition to the rhombohedral phase [6].
Complex dielectric constant
the complex dielectric constant ε~ is given by:
ε~ = ε1 + iε2 = (ñ)2 = (ñ + ik)2 [17, 19]
ε1 = n2 – k2 (5)
from which arise,
ε1 = 2nk (6)
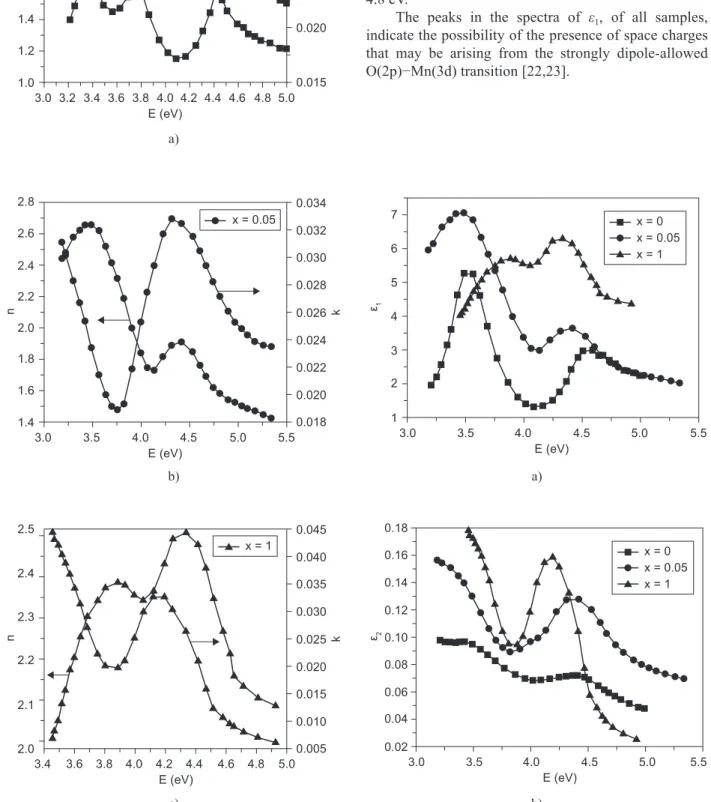
figure 3 shows photon energy dependencies of the real and imaginary parts of the dielectric function,, extracted from our ellipsometric data.
from figure 3 one can see that the spectra of ε~ have globally the same variation as the complex refractive index that complex index ñ. the curves in figure 3 show similar features as those published elsewhere [11], [12].
figure 1. afM cross-sectional scans of la0.7Ca0.3-xKxMnO3 (x = 0.00, 0.05 and 0.10), at room temperature. 0
-750 0 750
2.50 µm
x = 0
n
m
5.00
0 -1000
0 1000
4.00 µm
n
m
8.00
2.00 6.00
x. = 0.05
0 -300
0 300
1.00 µm
n
m
2.00 x = 0.1
the data in figure 3a reveal that the dispersion phenomenonfor the sample x = 0.1 is different form those measured for the samples x = 0.05 and 0.1.this result is explained by the structural transition to the rhombohedral phase [6].
the curves in figure 3b displays that the absorption increases for the low-energy optical band around 3.5 ev. however, it also decreases at a high energy range around 4.8 ev.
the peaks in the spectra of ε1, of all samples,
indicate the possibility of the presence of space charges that may be arising from the strongly dipole-allowed O(2p)−Mn(3d) transition [22,23].
b) a)
c) b)
a)
figure 2. Complex refractive index of ñ = n + ik versus energy e, for bulk la0.7Ca0.3-xKxMnO3 (x = 0.00, 0.05 and 0.10).
figure 3. real ε1 and imaginary ε2 parts of the complex
dielec-tric function constant for bulk la0.7Ca0.3-xKxMnO3 (x = 0.00,
0.05 and 0.10). 3.0
1.6 2.0 2.4 2.6 2.8
1.4 1.8 2.2
E (eV)
n 0.026
0.030 0.034
0.018 0.022 0.024 0.028 0.032
0.020
k
5.0
3.5 4.0 4.5 5.5
x = 0.05 x = 0
x = 0.05 x = 1
3.0 2 4 6 7
1 3 5
E (eV) ε1
5.0
3.5 4.0 4.5 5.5
3.8
E (eV)
4.6 4.8
3.4 3.6 4.0 4.2 4.4 5.0
2.0 2.2 2.3 2.5
2.4
2.1
n 0.025
0.035 0.045
0.005 0.015 0.020 0.030 0.040
0.010
k
x = 1 x = 0
x = 0.05 x = 1
3.0
E (eV)
ε2
5.0
3.5 4.0 4.5 5.5
0.04 0.08 0.12 0.14 0.16 0.18
0.02 0.06 0.10
3.0
1.2
1.6
2.0 2.2 2.4
1.0 1.4 1.8
3.8 E (eV)
n 0.025
0.030 0.035
0.015 0.020
k
4.6 4.8 3.4 3.6 4.2 4.4 3.2
x = 0
the ellipsometric angles y and d
in this work, the values of the angles y and d are calculated from the following equations: [24, 25]
(7) where q is the angle of incidence that is 70° in this work.
the equation (7):
(8) from equation (8) it is possible to obtain both parameters only by using equation (2). however, they can be obtained directly from equation (2) and measured data, or in some ellipsometres they are output of mea-surements.
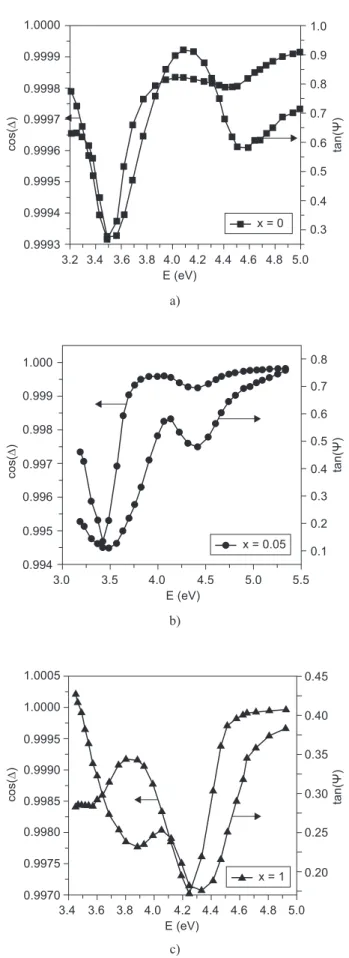
tan (y) and cos(d) for la0.7Ca0.3-xKxMnO3(x=0.00,
0.05 and 0.10), are shown in figure 4.
the spectra for all samples exhibit oscillations. it is remarkable that curve maxima in figures 2-4 exhibit a shift, as K content (x) increases, indicating that the band gap energy (eg) changes with the change of x.
the oscillations form in the rhombohedral sample (x = 0.10) are different from the orthorhombic samples (x = 0.00, x = 0.05).
light scattering can be described as the redirection of light that takes place when an electromagnetic (eM) wave (i.e. an incident light ray) encounters an obstacle or non homogeneity (different grains size). as eM wave interacts with discrete particles, the electron orbits within the particle’s constituent molecules are perturbed periodically with the same frequency as the electric ield of the incident wave. the oscillation or perturbation of the electron cloud results in a periodic separation of charge within the molecule, which called an induced dipole moment. the oscillating induced dipole moment is considered as a source of eM radiation, thereby resulting in scattered light.
to determine whether a surface is smooth or rough from the point of view of its interaction with light is somewhat arbitrary. nevertheless, two main criteria can be found to deine a smooth surface, namely the rayleigh and the frauenhofer criteria, respectively. Considering a plane monochromatic wave striking the rough surface at angle θ (figure 5), one can calculate the phase difference Δφ between two rays scattered from separate points on the surface:
(9) where h is the standard deviation of the roughness height related to a reference height (rMS roughness value), and θ is the local incident angle.
the rayleigh criterion states that if the phase difference Δφ between scattered waves is less than π/2 radians, than the surface may be considered as smooth, and is deined by [26].
ε = (n + ik)2 = sin2 (θ) 1 + tan2 (θ)· 1+ρɶ
1–ρɶ ɶ
ɶ
ρ = sin
2 (θ)[1 + tan2 (θ)] – ε
sin2 (θ)[-1 + tan2 (θ)] + ε
ɶ ɶ
4̟h
λ sin θ
Δφ =
b)
c) a)
figure 4. the spectra of the ellipsometric parameters tan(Ψ) and cos(Δ) as functions of photon energy for the solids samples, la0.7Ca0.3-xKxMnO3 (x = 0.00, 0.05 and 0.10).
3.0 0.995 0.997 0.999 1.000 0.994 0.996 0.998 E (eV) c o s (∆ ) 0.5 0.7 0.1 0.3 0.4 0.6 0.8 0.2 ta n (Ψ ) 5.0
3.5 4.0 4.5 5.5
x = 0.05
3.8
E (eV)
4.6 4.8
3.4 3.6 4.0 4.2 4.4 5.0
0.9975 0.9985 0.9995 1.0000 1.0005 0.9970 0.9980 0.9990 c o s (∆ ) 0.35 0.45 0.25 0.30 0.40 0.20 ta n (Ψ )
x = 1
0.9994 0.9996 0.9998 0.9999 1.0000 0.9993 0.9995 0.9997 3.8 E (eV) c o s (∆ ) 0.6 0.8 1.0 0.4 0.7 0.9 0.3 0.5 ta n (Ψ ) 4.6 4.8
3.4 3.6 4.2 4.4
3.2
x = 0
(10) according to the rayleigh criterion, in our works part of the light scattering is due to surfaces roughness of our samples. indeed, all rMS values are more than hc where θ = 70° and λ ≈ 600 nm. in addition, the
rhombohedral phase ( x= 0.10) has the smallest difference between rMS and hc.
Optical conductivity
the real optical conductivity s relates to imaginary parts complex constant e2 and is given by: [27-29]
(11) where, ω(2πν) is the angular frequency and e0 is the
permittivity of vacuum.
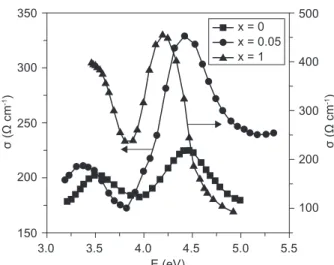
data in figure 6 display the photon energy-depen-dent s curves for la0.7Ca0.3-xKxMnO3 (x = 0.00, 0.05 and
0.10) samples at room temperature and paramagnetic semiconductor phase.
from fig. 6 one can conclude that optical conduc-tivity increases with K doping. the result may be ex-plained by increasing of ac conductivity sac with K content
similarly as in our previous work [7]. furthermore, for all samples the curves reveals two peaks and minimum values.
the results presented in figure 6 can be interpreted as follows: [30-36]
● the peaks at 3.3-3.5 ev for the samples x = 0.00 and x = 0.05 respectively, are the result of a hopping transition between Jt-split eg levels within the parallel
spin manifold, that due to the strong hybridization between the Mn( eg) and O-2p bands, and the strong
local distortion of the Mn−O octahedra.
● the minimum in the 3.8-4ev range are due to eg-eg
transitions, i.e from a Mn3+ ion to either another Mn3+
ion or to a Mn4+ ion. in both cases, the promoted
electron can end up being parallel or antiparallel to the t2g core spin.
● the second peak centred at 4.4 ev (x = 0.00), 4.4 ev (x = 0.05) and 4.25 ev(x = 0.10) is attributed to the Mn(3d eg)−O(2p) transition.
in addition, the increase of the optical conductivity with K doping is explained by the decreasing of the three gaps indicated above.
COnCluSiOnS
We have investigated optical properties of la0.7
Ca0.3-xKxMnO3 (x = 0.00, 0.05 and 0.10) powder samples
at room temperature and in paramagnetic semiconductor phase. it has been found that K substitution in la0.7
Ca0.3MnO3 induces a structural transition from
ortho-rhombic (pnma) to rhombohedral (r3¯ c) phase. the optical complex constants of the polycrystalline have been obtained by spectroscopic ellipsometry in the uv spectral band. after doping with K, the refractive index n increases and the maximum of n shifts to higher energies. however, the absorption edges of K-modiied samples do not differ remarkably. the dependence of the complex refractive index or complex dielectric constant on energy reveals oscillations.
We have found that K substitution leads to an increase in the real part of the optical conductivity. the optical conductivity is dominated by three transitions: ● transition between different eg levels in the same site.
● interatomic eg → eg transitions.
● Charge transfer transitions, O-2p → eg.
furthermore, the transitions gaps are decreased by K substitution.
h < h
c where hc =
λ 8 sin θ
σ = ε
0ωε2 4̟
figure 5. diagram for determining the phase difference between two parallel waves scattered from different points on a rough surface.
figure 6. photon energy dependence of the real part of the optical conductivity for la0.7Ca0.3-xKxMnO3 (x = 0.00, 0.05 and
0.10) samples at room temperature.
h
0 0
3.0
200
300 350
150 250
E (eV)
σ
(
Ω
c
m
-1)
σ
(
Ω
c
m
-1)
500
200
300 400
100 5.0
3.5 4.0 4.5 5.5
references
1. von helmolt r., Wecker J., holzapfel b., Schultz l., Samwer K.: phys. rev. let. 71, 2331 (1993).
2. Okimoto y., tokura y. : J. Supercond. 13, 271 (2000). 3. emin. d. : phys. rev.. b 48, 13691 (1993).
4. Millis a.J., littelwood p.b., Shraiman b.i.: phys. rev. lett. 74, 5144 (1995).
5. Sdiri n., bejar M., dhahri e. : J. Magn. Magn. Matter. 311, 512 (2007).
6. bejar M., dhahri e., hlil e.K., hentiti S. : J. alloys Compd. 440, 36 (2007).
7. Sdiri n., Jemai r., bejar M., hussein M., Khirouni K., dhahri e., Mazen S. : Solid State Commun. 148, 577 (2008).
8. trolier-Mikinstry S., Koh J.: thin Solid films 313, 389 (1998).
9. trolier-Mikinstry S., Chindaudan p., vedam K., hiremath b.v.: J. am. Ceram. Soc. 78, 2412 (1995).
10. brews J. r.: phys. rev. lett. 18, 662 (1967).
11. loshkareva n.n., Sukhorukov yu.p., Mostovshchikova e.v., nomerovannaya l.v., Makhnev a.a., naumov S.v., gan’shina e.a., rodin i.K., Moskvin a.S., balbashov a.M.: J. exper. theor. phys. 94, 350 (2002).
12. Kovaleva n.n., boris a.v., bernhard C., Kulakov a., pimenov a., balbashov a.M., Khaliullin g., Keimer b.: phys. rev. lett. 93, 147204 (2004).
13. a.S. Moskvin, phys. rev. b 65, 205113 (2002).
14. bastjan M., Cooper S.l., rubhausen M.: phys. rev. b 77, 193105 (2008).
15. babonas g.J., grivel J.C., reza a., girkantaite r.: lithua-nian Journal of physics 47, 309 (2007).
16. heavens O.S.: Optical Properties of Thin Solid Films. dover press, new york, 1965.
17. J. Maring, J. physique 41 971-979 (1980).
18. didomenico M., Wemple S.h.: J. appl. phys. 40, 720 (1969).
19. Wemple S.h., didomenico M.: J. appl. phys. 40, 735 (1969).
20. Wemple S.h., didomenico M.: phys. b 3, 1338 (1971). 21. thacher p.d.: applied Optics 16, 3210 (1977).
22. Kovaleva n.n., Oles a.M., ballashov a.M., Maljuk a., argyriou d.n., Khaliullin g., Keimer b.: Cond-mat. Str-el 0907 5098 (2009).
23. pohl a., Westin g., Jansson K.: Chem. Mater 14, 1981 (2002).
24. Kumari n., Krupanidhi S.b., varma K.b.r.: Materials research bulletin 45, 465 (2010).
25. aspnes d.e.: J. Opt. Soc. am. 70, 1275 (1980).
26. Moreno-baez a., Miramontes-de leon g., Sifuentes-gallardo C., garcia-dominguez e., huerta-ruelas J.a.: int. J. phys. Sci 6, 7857 (2011).
27. ras g.S., rao C., fenaro J.: appl. Spectroscopy 24, 436 (1970).
28. arima t., tokura y.: J. phys. Soc. Japan 64, 2488 (1995). 29. Kim K.h., Jung J.h, noh t.W.: phys. rev. lett. 81, 1517
(1998).
30. Kovaleva n.n., boris a.v., bernhard C., Kulakov a., pimenov a., balbashov a.M., Khaliullin g., Keimer b.: phys. rev. lett. 93, 147204 (2004).
31. Zhou J.S., goodenough J.b.: phys. rev. lett. 96, 247202 (2006).
32. arima t., tokura y., torrance J.: phys. rev b 48, 17006 (1993).
33. takenaka t., iida K., Sawaki y., Sugai S., Moritomo y., nakamma a.: J. phys. Soc. Jpn 68, 1828 (1999)
34. Qian M., dong J., Zheng Q.: phys. lett. a 270, 96 (2000). 35. Medvedeva J.e., anismov v.i., Korotin M.a., Mryasov
O.n., freeman a.J.: J. phys. Cond. Matter 12, 4947 (2000). 36. degenhart C., fiebig M., frohlich d., lottermoser th.,