D.P.M. METHOD - A PERFORMANCE ANALYSIS INSTRUMENT OF A STRATEGIC BUSINESS UNIT
Ionescu Florin Tudor
Bucharest Academy of Economic Studies Marketing Faculty
Considering the uncertain economic conditions, the market dynamics, the fundamental changes in the attitudes and aspirations of the consumers along with the strong growth of the political role and interventions in the economy, currently characterizing both Romania and other countries of the world, it can be said that the need for strategic planning was never so acute as now. The strategic planning process is an ongoing organizational activity by which managers can make decisions about their present and future position. A number of analytical portfolio tools exist to aid managers in the formulation of the strategy. The use of these tools within the broader context of the overall strategic planning process allows managers to determine the obstacles and opportunities existing in the company’s environment and to define and pursue appropriate strategies for growth and profitability. The present paper aims to highlight from a theoretical standpoint the D.P.M. method, its strategic consequences, advantages and disadvantages. After conducting this analysis I have found that restricting the business portfolio analysis to the D.P.M. matrix is not a very wise decision. The D.P.M. matrix among with other marketing tools of business portfolio analysis have some advantages and disadvantages and is trying to provide, at a time, a specific diagnosis of a company’s business portfolio. Therefore, the recommendation for the Romanian managers consists in a combined use of a wide range of tools and techniques for business portfolio analysis. This leads to a better understanding of the whole mix of product markets, included in portfolio analysis, the strategic position held by each business within a market, the performance potential of business portfolio and the financial aspects related to the resource allocation process for the businesses within the portfolio. It should also be noted that the tools and techniques specific to business portfolio analysis do not give accurate answers, despite the appearances created by the analysis stage, where the businesses are plotted rigorously. However, their main virtue is simplicity, as these highlight the managers’ need for further investigations.
Keywords: matrix, strategic business unit, portfolio, profitability, competitive position, strategic directions
JEL classification: M31
Introduction
At the beginning of strategic business planning, almost all companies put emphasis on diversification. Over time, due to changes in the marketing environment, generated by the tightening competition, technological, social and political pressures and not only, it became obvious that a company can no longer solve the problems brought by these changes, simply by action of diversification of the business portfolio, leading to the company's business portfolio to grow quantitatively. As a result of this approach in the '70s the companies’ attention switched from the actions of diversification to the optimization of the entire businesses portfolio.
Over time, a series of methods have been created with a view to support the strategy assessment and the selection process of the strategic business units within a business portfolio. Of these, the methods corresponding to business portfolio analysis stands out.
Business portfolio analysis is an analytical approach, whereby a company manager can view the company as a sum of strategic business units that must be managed in a profitable manner. The business portfolio analysis must become routine activity undertaken by the company, through its carrying out on a regular basis, so that decisions of earmarking of financial resources may be monitored, updated and modified with a view to accomplishing corporate objectives, correlated to the process of generation thereof carried out in an efficient way by each product (Armstrong and Brodie 1994: 2).
The D.P.M. method
Within the list of significant contributions to the business portfolio analysis domain, must be disclosed the one made by S.J. Robinson, R.E. Hichens and D.P. Wade. These management consultants developed in 1975, for the Shell International Chemicals, a method in order to analyze the competitive position within the market of the company’s divisions. First, it was built to be used only in the petrochemical industry. Later was modified and reconfigured in order to be used in a large number of industries (Robinson and Hichens and Wade 1978: 8).
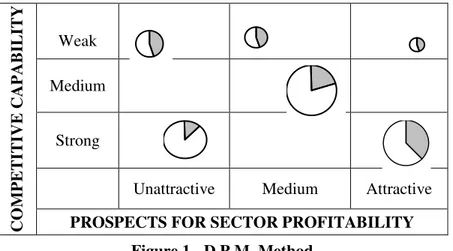
Figure 1.- D.P.M. Method
Source: Hussey, David (1999), Strategy and Planning – A Manager’s Guide, John Wiley and Sons Ltd, pag. 153.
Regarding its structure, the D.P.M. method has two main axes and consists of 9 squares, being a 3x3 type matrix. This matrix is illustrated in Fig. 1. The horizontal axis measures the profitability of the economic sector (industry attractiveness) and the vertical axis measures the competitive position of the company (Thompson and Martin 2005: 427).
Thus the method examines if the market opportunities worth to be considered or not and also measures the success degree of the company in those markets (Hussey 1999: 150).
The D.P.M matrix uses a scoring method based on two indicators, which reaches a maximum of 12 points. However, other companies have adapted the scoring method, according to their needs. The scoring system used by the present matrix manages well enough to differentiate the strategic business units within an enterprise (Hussey 1999: 150).
Looking at Figure 1, it can be seen the presence of some fictive strategic business units, represented as circles of different sizes. The size of the circles represents the size of the market within the strategic business units activate and the shaded portions inside the circles represent the market share held by the strategic business units. Also, the managers must not overlook the fact that the lines of the nine quadrants can be considered flexible. This should be considered when one or more strategic business units are located very close to the edges of the nine quadrants. In practice, this should not raise problems to managers, since the matrix does not claim to be
C
O
M
P
E
T
IT
IV
E
C
A
P
A
B
IL
IT
Y
Weak
Medium
Strong
Unattractive Medium Attractive
considered a method that provides specific answers but rather a way for managers to shape a strategic perspective and to take strategic decisions.
The two indicators of the Ox and Oy axes are taking into consideration a complex set of factors. Thus, the Ox axis is based on three factors, which are: market growth rate, quality and market profitability and market supply (Hussey 1978: 2).
Regarding the market growth rate, it must be said that this is an important factor in determining the market forecasts. Also it is relevant during the decision making process regarding the investment decisions for the enterprise. Therefore, for an enterprise is more appropriate to make investments in growing markets than markets experiencing slower growth.
The second factor, of the Ox axis considered for analysis is the quality and the profitability of the market. Thus, for the analysis of this factor is recommended to give answer to the following questions: What levels of economic profitability of the industry occurred in the past?; There are many consumers and few producers or there are many producers and few consumers?; There are alternative products on the market and which is the risk for the enterprise? ; How restrictive is the technology?; There are in the market place enterprises offering post-sale products or services that complement the sales of another enterprise?
The answers to these questions will vary from company to company, depending on the particularities of their businesses. However, some of them might not be important for some companies, because there are other vital factors in the market to be included in the analysis. The last factor to be analyzed is the supply ability owned by the suppliers within the market place, correlated with the market growth. This is not only a capacity analysis, but also an analysis of the availability of components and raw materials.
The Oy axis is based on the following factors: the position held within the market place, the production capacity and product research and development (Hussey 1978: 2).
The factor "market position" is somehow related with the market share indicator. Using this indicator the managers are trying to assess the position held by the company within the market place, in terms of its ability to lead in prices. Basically, the market position can be classified as follows: leadership, major producer, viable producer, minor manufacturer, insignificant producer (Hussey 1999: 152).
The second factor of the Oy axis refers to the company's ability to sustain their own resources, necessary in the production process and not depending on raw material suppliers. The last factor of the Oy axis covers the enterprises capability to sustain the research and product development, the distribution, the after sales service and other necessary items.
After completing the analysis of all influencing factors specific to the Ox and Oy axes, the managers can move to the next step which establishes the position held by the strategic business units, within the D.P.M. matrix. Following the graphical representation within the D.P.M. matrix, the managers start to identify the strategic options for each strategic business unit, included in the company’s business portfolio. This last stage of the company's business portfolio analysis is discussed in detail in the following section which presents the implications of strategic nature.
Strategic implications of the D.P.M. method
After the process of establishing the position of the strategic business units within the D.P.M. matrix, the next step regards the identification and selection of strategic directions.
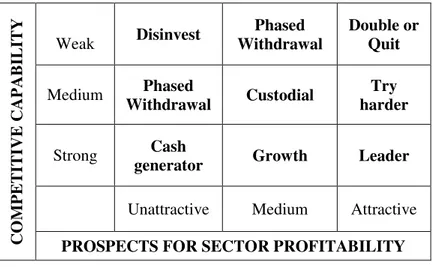
In figure 2 there are presented the strategic choices specific to each of the nine quadrants of the D.P.M. matrix.
The eight categories identified, were based on some combination of the company’s strengths and the prospects offered by the respective economic domain and are ranked according to degree of importance as follows:
recommended strategy is to maintain this position. It should be noted that, initially, these types of units may need an infusion of cash from other sources of income, in order to develop. However, managers should give them high priority;
Figure 2 - D.P.M. strategies
Source: Drummond, Graeme and Ensor, John (2001), Strategic Marketing – Planning and Control, 2nd Edition, Butterworth Heinemann, Oxford, p. 102
Try harder – this quadrant corresponds to strategic business units, which have the potential to improve their position held within the market place, but this can only be achieved through judicious allocation of resources. As such, the company should strive to push the product in the position of "leader";
Double or Quit - this quadrant includes those strategic business units that have the potential to become the flagship of the company. As such, managers should carefully assess the market attractiveness, and then select those strategic business units, to be abandoned and those units to be supported and developed. Thus, the strategy required in this situation is to abandon their development;
Growth – the strategic business units that lie in this position are characterized by high production capacity and also high capacity for research and product development. Most times, these kind of strategic business units generate sufficient financial resources which are necessary to their development and self-financing. As such, the strategy recommended in this case is to enable the strategic business units to develop in the same rhythm with the market;
Custodial – the strategic business units within this quadrant activate on markets in which there are some strong competitors. The strategy that should be applied in this case is to maintain their position, but not to allocate additional financial resources;
Cash generator - in this quadrant lays the strategic business units with a slow growth and an unattractive economic context. Also, these strategic business units are approaching the last stage of their life cycle and there will be replaced by new ones. As such, they should not receive additional financial resources for expansion, although normally they would have to hold capital to maintain its current position within the market. However, as long as they are profitable, they should be used as a source of financial resources for other businesses within the company’s portfolio. So, the recommended strategy for this situation is to maximize profits and cash flow; Phased withdrawal – the strategic business units within this quadrant are characterized by a small market share held within a market in stagnation or decline phase. Because they are not able to generate reasonable cash flow they should be "milked". Further, the financial resources collected must be invested in other businesses which are more profitable. So the strategy
C O M P E T IT IV E C A P A B IL IT Y
Weak Disinvest
Phased Withdrawal
Double or Quit
Medium Phased
Withdrawal Custodial
Try harder
Strong Cash
generator Growth Leader
Unattractive Medium Attractive
indicated in this situation is phased withdrawal, correlated with the evaluation of the strategic business unit’s assets, in order to redirect the available resources to other business;
Disinvest – the companies holding strategic business units within this category must immediately withdraw them from the market because they represent real financial traps. More specifically, they consume resources allocated by the company without generating measurable results. The strategy recommended in this situation is undoubtedly to reduce investment to that business in order to be eliminated from the company’s portfolio.
If the portfolio is composed predominantly of mature strategic business units which are generating financial resources, the company must identify new business opportunities.
In an opposite situation, if the company has strategic business units that need cash infusions, it must find a balance between this kind of units and the cash generators units (Robinson and Hichens and Wade 1978: 15).
Advantages and disadvantages of the D.P.M. method
The D.P.M. matrix can raise some problems to managers arising from their inability to assess the competitor’s moves. In other words, the accurate information about competitors is of major importance in order to determine the position occupied by the company's strategic business units within the D.P.M. matrix.
Also, the managers must define the economic domain and the market of the strategic business units in which they operate. The accuracy with which managers conduct this process may affect the place of the company within the market place and the strategies that it adopts. The measurement of influence factors, individually, adds more accuracy to the evaluation process of various aspects specific to the internal and external environment of the company (Robinson and Hichens and Wade 1978: 15).
However, it should be remembered that the measurement of influence factors is largely based on subjective assessments of managers (Drummond and Ensor 2001: 101). Also, this process depends on the access degree of managers to information and on a variety of factors, which may be mentioned: the limits of the budget, the short-term objectives and the internal policies of the company.
Given the disadvantages mentioned above, I must consider a number of strengths offered by the D.P.M. method.
As I mentioned earlier, the present method was developed in order to be used within the petrochemical industry. Thus, the adoption of this method by companies operating in completely different industries, involves the change of all evaluation factors and their measurement system. Even so, the method shows a high level of flexibility because it can be adapted to reflect the priorities and specific characteristics of any type of enterprise (Newton 1981: 52).
The D.P.M. method is an analytical financial instrument and therefore is not dependent on the boundaries of the company's financial reporting procedures.
The results of the analysis can be easily interpreted and the manager can also identify a number of meanings. Even if the conclusions are general, without going into detail, they can be used to indicate the positive and the negative directions. Thus, the D.P.M. method gives managers the opportunity to make a diagnostic analysis, both of the company and of the products.
Given the advantages and disadvantages of the D.P.M. method, in conclusion I can say that this is a challenge for managers because it urges them to focus on strategic thinking by which they can measure the potential of the strategic business units, in order to correctly allocate resources.
Conclusions
Finally based on the theoretical analysis I consider appropriate to insert some comments in the form of recommendation that managers can consider in the future. Thus, according to the information mentioned above, it must be highlighted that limiting the portfolio analysis to the D.P.M. method is not a very wise decision.
The tools of business portfolio analysis facilitate discussion and shape the competitive position of a company, generating at the same time questions related to the contribution of the current allocation of resources to the success and long-term vitality. However, besides the fact that these tools help managers to control the allocation of resources and to suggest realistic goals for each strategic business unit, they also offer the possibility of using strategic units, as vital resources within the process of fulfilling the objectives established at corporate level.
Therefore, the recommendation for the managers consists in a combined use of a wide range of tools for business portfolio analysis. This affirmation is strengthened by the results of a study undertaken in 2001, that highlights the fact that companies that rely only on financial instruments fail to build strong business portfolios and the companies that combine the financial instruments with the marketing and management methods obtain in the end much more competitive product portfolios in the markets (Cooper 2001).
In conclusion, I recommend the combination of the financial and strategic instruments because the top managers will better understand the whole mix of strategic business units, the strategic position held by every strategic business unit within a marketplace, the performance potential of the whole strategic business units portfolio and the financial aspects of the resource allocation process for the strategic business units of the company. It should also be noted that the tools specific to business portfolio analysis do not give accurate answers, despite the appearances created by the analysis stage, where the strategic business units are plotted rigorously. However, their main virtue is simplicity, as these highlight the managers’ need for further investigations.
References
Ackoff, R. (1970), “A concept of corporate planning”, Long Range Planning, Volume 3, Issue 1,
September.
Armstrong, J. S. and Brodie, R.J. (1994), “Effects of Portfolio Planning Methods on Decision
Making: Experimental Results”, International Journal of Research in Marketing, Vol. 11, 73-84;
Barbu, A. (2011), “Marketing Strategic Planning: Contributing Factor to Public Sector
Performance”, Proceedings of the International Academy of Business and Economics 2011 -
Barcelona-Summer Conference, Volume 9, Number 1, pp. 86-90.
Cooper, R.G. (2001), Winning at new products: accelerating the process from idea to launch, 3rd
Edition, Basic Books, New York.
Drummond, G. and Ensor, J. (2001), Strategic Marketing – Planning and Control, 2nd Edition,
Butterworth Heinemann, Oxford.
Hussey, D. (1999), Strategy and Planning – A Manager’s Guide, John Wiley and Sons Ltd.
Hussey, D.E. (1978), “Portfolio Analysis: Practical Experience with the Directional Policy
Matrix”, Long Range Planning, London, Vol. 11, Iss. 4.
Newton, J. K. (1981), “Acquisitions: A Directional Policy Matrix Approach”, Long Range Planning, Vol. 14, No. 6.
Robinson, S. J. Q. and Hichens, R. E. and Wade, D. P. (1978),”The Directional Policy Matrix -
Thompson, J. and Martin, F. (2005), Strategic management: awareness and change, 5th Edition, Thomson Publishing, London.
Acknowledgement