www.atmos-meas-tech.net/6/3271/2013/ doi:10.5194/amt-6-3271-2013
© Author(s) 2013. CC Attribution 3.0 License.
Atmospheric
Measurement
Techniques
Characterization of an aerodynamic lens for transmitting particles
greater than 1 micrometer in diameter into the Aerodyne aerosol
mass spectrometer
L. R. Williams1, L. A. Gonzalez2, J. Peck1, D. Trimborn3, J. McInnis4, M. R. Farrar5, K. D. Moore6, J. T. Jayne1, W. A. Robinson1, D. K. Lewis1,7, T. B. Onasch1, M. R. Canagaratna1, A. Trimborn3, M. T. Timko1,8, G. Magoon1, R. Deng9, D. Tang10, E. de la Rosa Blanco1, A. S. H. Prévôt11, K. A. Smith12, and D. R. Worsnop1
1Aerodyne Research, Inc., Billerica, MA, USA 2CoolChip Technologies, Boston, MA, USA 3AeroMegt, Hilden, Germany
4Department of Chemistry, Northwestern University, Evanston, IL, USA 5Cambridge Rindge and Latin High School, Cambridge, MA, USA
6Space Dynamics Laboratory, Utah State University Research Foundation, North Logan, UT, USA 7Department of Chemistry, Connecticut College, New London, CT, USA
8Department of Chemical Engineering, Worcester Polytechnic Institute, Worcester, MA, USA 9Institute of Bioengineering and Nanotechnology, Singapore
10Dynamic Engineering Inc., Houston, TX, USA 11Paul Scherrer Institute, Villigen, Switzerland
12Department of Chemical Engineering, Massachusetts Institute of Technology, Cambridge, MA, USA
Correspondence to:L. R. Williams ([email protected])
Received: 3 March 2013 – Published in Atmos. Meas. Tech. Discuss.: 7 June 2013 Revised: 22 October 2013 – Accepted: 28 October 2013 – Published: 28 November 2013
Abstract.We have designed and characterized a new inlet and aerodynamic lens for the Aerodyne aerosol mass spec-trometer (AMS) that transmits particles between 80 nm and more than 3 µm in vacuum aerodynamic diameter. The de-sign of the inlet and lens was optimized with computational fluid dynamics (CFD) modeling of particle trajectories. Ma-jor changes include a redesigned critical orifice holder and valve assembly, addition of a relaxation chamber behind the critical orifice, and a higher lens operating pressure. The transmission efficiency of the new inlet and lens was char-acterized experimentally with size-selected particles. Exper-imental measurements are in good agreement with the calcu-lated transmission efficiency.
1 Introduction
collection efficiency due to particle bounce off the vaporizer, andESrepresents reduced collection efficiency due to parti-cle beam spreading for very small or very non-spherical par-ticles (Huffman et al., 2005).
The aerodynamic lens currently used in the AMS, referred to as the standard lens, is based on a design described by Liu et al. (1995a, b), as modified in Zhang et al. (2002, 2004). The transmission efficiency of the standard lens is 1 between approximately 90 nm and 700 nm in vacuum aerodynamic diameter (dva)and decreases to 0.3 at 1000 nm (Liu et al., 2007). The aerodynamic lens consists of a series of apertures that decrease in diameter. At each aperture, the gas stream-lines are forced to the axial center line. After each aperture, the gas expands; however inertia tends to keep the particles near the center axis. Particles above a certain size are not fo-cused effectively because their inertia is greater than the drag and they do not follow the gas streamlines to the center axis. Particles below a certain size are not focused because they either follow the gas streamlines or diffuse away from the center axis due to Brownian motion.
Several previous studies have addressed broadening the transmission size range of aerodynamic lenses. Wang and McMurry (2006) proposed using helium as the carrier gas to improve the transmission of small particles. Lee et al. (2009) invented a converging–diverging orifice to stabi-lize the fluid flow and transmit 5–50 nm particles better in air. The same group also developed an orifice configura-tion with descending–ascending diameters to achieve better transmission of large particles (Lee et al., 2013). Schreiner et al. (1999) experimentally demonstrated that a seven-stage high-pressure lens could focus micrometer-sized particles.
This paper presents the design and characterization of a new aerodynamic lens and inlet for the AMS that transmits particles up to several microns in diameter. Transmission of larger particles is achieved by increasing the pressure inside the aerodynamic lens from 173 Pa (1.3 Torr) in the standard lens to about 1840 Pa (13.8 Torr), following the concept de-scribed by Schreiner et al. (1999). The higher pressure in-creases the aerodynamic drag on the particles and allows larger particles to be focused to the center axis of the lens. Accordingly, the new lens design is referred to as the high-pressure lens (HPL). In addition to the HPL, changes to the inlet, particularly the introduction of a relaxation chamber between the critical orifice and the aerodynamic lens (Wang and McMurry, 2006), increase the transmission of large par-ticles. This inlet and lens will be useful for measuring am-bient PM2.5 (particulate matter less than 2.5 µm in diame-ter), detecting biological particles, characterizing drug deliv-ery aerosols, and sampling high-density metal nanoparticles.
2 Modeling of high-pressure lens and inlet
Particle beam focusing relies on aerodynamic drag and the difference between the inertia of aerosol particles and the carrier gas. The Stokes number is the ratio of the particle stopping distance to a characteristic dimension of an obsta-cle (Hinds, 1999), or
St=ρpd
2 pCcu 18µda
, (1)
whereρp(kg m−3)is the particle density,dp(m) the parti-cle diameter,Cc the Cunningham slip factor,u(m s−1)the average fluid velocity at the lens aperture, µ (kg m−1s−1)
the fluid viscosity, andda(m) the diameter of the lens aper-ture. Physically, St is interpreted as the particle’s ability to respond to changes in the gas flow as the flow contracts and expands through each lens aperture. When St≪1, particles will tend to follow the carrier gas streamlines. Conversely, when St≫1, inertia will tend to force particle trajectories to deviate from the carrier gas streamlines when the flow under-goes abrupt changes in direction. When St∼1, particles tend to focus into a particle beam near the axis of the lens when the flow contracts and expands as it passes each aerodynamic lens aperture.
The concept of the high-pressure lens (HPL) is based on the loss of large particles due to their large inertia compared with the drag force exerted on them by the carrier flow. Large particles “slip” from the fluid streamlines, over-expand to im-pact the lens walls, and are lost. By increasing the pressure in each lens aperture, the Cunningham slip factorCcdecreases, which leads to an increase in drag force. As a result, large particles slip less at higher pressures and are transmitted through the lens with higher efficiencies (that is, St∼1 for larger particles). Smaller particles can still be transmitted at higher pressures at relatively high efficiencies by increasing the number of lens apertures. Detailed analysis of the effect of pressure on particle focusing and transmission has been discussed in the literature (Wang and McMurry, 2006) and is the subject of a separate manuscript in preparation (Peck et al., 2013).
Fig. 1.Schematic of the lens system, including critical orifice assembly, relaxation chamber, valve and aerodynamic lens, and flight region to the vaporizer/target for the high-pressure lens in an aerosol mass spectrometer (not to scale).
diameter sets the mass flow rate, the nozzle diameter sets the pressure immediately upstream of the nozzle, and the seven lens orifices account for most of the pressure drop through the lens system.
After solving the 2-D axisymmetric flow profile, particles were injected upstream of the critical orifice into the gas flow field, and their trajectories were calculated. On the basis of their low concentration, particle–particle interactions were considered negligible and the potential influence of the par-ticles on the gas flow was neglected. To obtain meaningful statistics, a total of 250 particle trajectories were calculated for each particle size, with all of the particles entering at the same axial position. Since the flow solution is axisymmetric and the flow profile at the injection site is not uniform, the inlet radial distribution of particlesf (r)was taken to be pro-portional to the local fluid velocity (Poiseuille flow) times the radiusr, or
f (r)∼r
1−
r
R
2
, (2)
wherer (m) is the radial position of the particle andR (m) is the radius of the tube. This radial position distribution ac-counts for the non-uniform fluid velocity profile as well as particles entering at different angular positions at a given radius. Particle drag forces and Brownian motion were cal-culated using the slip model proposed by Liu e al. (2007). Brownian motion in the lens system decreases the transmis-sion of particles less than 100 nm in diameter, due to im-paction loss in the lens system and due to broadening of the particle beam at the lens exit.
One change in the CFD modeling since the results in Liu et al. (2007) is the model of the vacuum chamber. When the flow exits the cone-shaped nozzle, the fluid undergoes a su-personic expansion into the vacuum chamber, and within a few nozzle diameters downstream, the pressure drops to less than 0.1 Pa (1×10⁻³Torr). Under these conditions, the mean free path of the gas molecules becomes comparable to the length scales in the vacuum chamber, and the continuum as-sumptions implicit in the CFD software are not valid. The approach in Liu et al. (2007) and Zhang et al. (2004) was
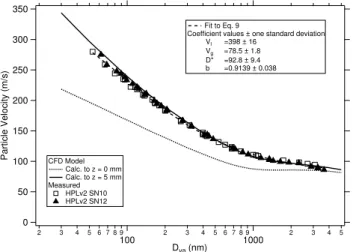
to calculate particle trajectories with Fluent into the vacuum chamber and to use the beam broadening model in the vac-uum chamber from Liu et al. (1995a) to correct for Brow-nian effects, assuming the pressure is 0.1 Pa (1×10⁻³Torr) throughout the vacuum chamber. In reality, the AMS vacuum chamber has a narrow channel (skimmer) located 18 mm past the lens exit. After the skimmer, the pressure drops to 0.001 Pa (1×10⁻⁵Torr). In the current model, the Fluent par-ticle dynamics calculation (including Brownian motion) was truncated halfway between the lens exit nozzle and the skim-mer. After this point, the particles were assumed to travel ballistically. The Fluent calculation was not terminated at the exit nozzle because there is still drag over the first few mil-limeters downstream of the nozzle while the flow transitions from the continuum to the kinetic regime. Ending the Flu-ent calculation atz=0, wherezis the axial distance from the exit nozzle into the vacuum chamber, underestimates the particle velocity for particles less than 2 µm in diameter (see Fig. 2). Particles reach their terminal velocities after travel-ing about 5 mm into the vacuum chamber, and the Fluent so-lution terminated at 5 mm after the exit nozzle offers a good match with the experimentally measured particle velocities, as shown in Fig. 2. Terminating the Fluent solution 5 mm downstream of the nozzle provides the best tradeoff between capturing particle physics downstream of the nozzle and not using the CFD results at pressures where the continuum as-sumptions are invalid.
The axial and radial velocities at 5 mm were then used to calculate the trajectory of the particles towards the target. The lens transmission efficiency as a function of particle diame-ter,EL(dp), between 30 nm and 20 µm was calculated as the fraction of particles that pass through the lens system and im-pact the target, in this case representing the AMS vaporizer (3.8 mm diameter) located 350 mm from the lens exit (see Fig. 1). Spherical particles with unit density were used for the calculations.
Table 1.Nominal diameters of apertures. Apertures A through G are 0.2 mm thick. Aperture H is a conical nozzle.
Nominal Aperture ID (mm)
A 2.25
B 2.02
C 1.80
D 1.57
E 1.35
F 1.12
G 1.01
H (exit nozzle) 0.90
rate into the lens is fixed by the 100 µm diameter critical ori-fice. Higher pressure in the lens enhances the transmission of larger particles, and is achieved by decreasing the diame-ter of the exit nozzle. The smaller the exit nozzle, the more difficult it is to machine (see Sect. 4). In addition, higher lens pressure shifts the cutoff on the small particle side to larger particle diameters, detrimental for measuring ambi-ent aerosol particle size distributions. The optimal configu-ration was determined to be a lens inlet pressure of around 1840 Pa (13.8 Torr), and an exit nozzle diameter of 0.9 mm. The calculated pressure at the lens entrance and the calcu-lated mass flow rate (1.35 cm3s−1)are in good agreement with the experimentally measured values of 1730 to 1800 Pa (13 to 13.5 Torr) and 1.36 cm3s−1, respectively.
The remaining aperture diameters were then determined by varying the ratio of lens apertures to the 0.9 mm exit noz-zle to obtain the largest range of transmitted particle diam-eters. The nominal diameters of all the lens apertures in the final design are given in Table 1. The shape of the exit nozzle was also explored with CFD modeling. A cone-shaped noz-zle with an entrance twice the diameter of the exit gave the best transmission for particles less than 150 nm in diameter.
Previous modeling work on the standard lens showed that the overall transmission of the lens system depends on the structures upstream of the aerodynamic lens (Liu et al., 2007). Accordingly, changes were made to each compo-nent in order to decrease particle losses. The critical orifice holder was redesigned to remove several step changes in in-ternal diameter (ID) immediately downstream of the criti-cal orifice; these steps were shown to be impaction sites in Liu et al. (2007). The new critical orifice holder expands to 10.2 mm ID at an angle of 80 degrees. The valve was re-designed to have a constant bore of 4.4 mm and consists of a custom valve body and a commercial valve stem. Similar to the critical orifice holder, CFD modeling showed that step changes of the ID around the commercially available valve used in the standard AMS lens system served as impaction sites. The constant bore valve improves the transmission ef-ficiency for particles between 500 nm and 2 µm in diameter.
350
300
250
200
150
100
50
0
Particle Velocity (m/s)
2 3 4 5 6 7 8 9
100 2 3 4 5 6 7 8 91000 2 3 4 5 Dva (nm)
CFD Model Calc. to z = 0 mm Calc. to z = 5 mm Measured
HPLv2 SN10 HPLv2 SN12
Fit to Eq. 9
Coefficient values ± one standard deviation Vl =398 ± 16
Vg =78.5 ± 1.8
D* =92.8 ± 9.4 b =0.9139 ± 0.038
Fig. 2.Velocity as a function of particle diameter from CFD model with calculation ending at exit nozzle (z=0, dotted line) and cal-culation continuing 5 mm past exit nozzle (z=5, solid line). Ex-perimentally determined particle velocity for two different high-pressure lenses (SN10, squares and SN12, triangles) and fit to Eq. (9) (dashed line). The fit parameters are defined in the text.
CFD simulations on the HPL with the constant bore valve predicted that an eddy would form downstream of the critical orifice holder and that this eddy could increase particle loss by impaction on the low-pressure side of the critical orifice or on the walls. Experimental observation of particle deposi-tion on the back of the critical orifice was consistent with this loss mechanism. A relaxation chamber was therefore intro-duced between the critical orifice and the valve as suggested by Wang and McMurry (2006). The purpose of the relaxation chamber is to slow the larger particles and allow them to be entrained in the gas flow eddy behind the critical orifice. The optimal ID and length of the relaxation chamber were deter-mined by examining calculated particle trajectories; the ID and length were increased until less than 5 % of the parti-cle trajectories impacted the back of the critical orifice or the walls of the relaxation chamber. A larger than necessary relaxation chamber is not desirable because it increases the residence time for particles in the lens system, possibly in-creasing evaporation of volatile components. The relaxation chamber in the current design increases the residence time in the lens system by roughly 50 %, from on the order of 0.04 s to 0.06 s. Experimentally, minimal deposition of particles on the back of the critical orifice was observed with the relax-ation chamber.
1.2
1.0
0.8
0.6
0.4
0.2
0.0
Transmission Efficiency (E
L
)
2 3 4 5 6 7 102
2 3 4 5 6 7 103
2 3 4 5 6 7 104
2
Dva (nm) With Relaxation Chamber, Calc. to z = 5mm Without Relaxation Chamber, Calc. to z = 5mm With Relaxation Chamber, Calc. to z = 0mm
Fig. 3.Transmission efficiency (EL)calculated by the CFD model
as a function of particle size with the relaxation chamber, calcu-lated to 5 mm past exit nozzle (z=5, solid line), without the re-laxation chamber, calculated to 5 mm past the exit nozzle (z=5, dashed line), and with the relaxation chamber, calculated to the exit nozzle (z=0, dash-dotted line).
vacuum aerodynamic diameter is improved when the relax-ation chamber is present. Comparing cases 1 (z=5 mm, solid line) and 3 (z=0, dash-dotted line) shows that accurate modeling of the radial component of the drag force immedi-ately downstream of the lens exit nozzle is important for pre-dicting particle transmission in the 30–100 nm particle-size range. Extending the CFD calculation into the vacuum cham-ber increases the predicted transmission efficiency for parti-cles between 60 and 100 nm and is in better agreement with the experimental measurements ofEL(see next section). The calculatedELwith the relaxation chamber and calculated to
z=5 mm are given in Table 2.
3 Experimental measurements
3.1 Transmission efficiency
3.1.1 Methods
Experimental measurements of the transmission efficiency of the high-pressure lens and inlet were made at Aerodyne Re-search, Inc. using a quadrupole aerosol mass spectrometer (Q-AMS, Aerodyne Research, Inc., serial number, SN, 215-058) equipped with a light scattering (LS) module (Jayne et al., 2000; Cross et al., 2007). The AMS operates in two modes: mass spectrum (MS) mode and particle time-of-flight (pToF) mode (Jiménez et al., 2003; Canagaratna et al., 2007). In pToF mode, transmission of the particle beam to the detec-tor is modulated with a mechanical chopper rotating at 100– 150 Hz. The vacuum aerodynamic diameter (dva(nm)) is cal-culated from the time delay between the chopper slit opening and the signal at the detector using a separately determined
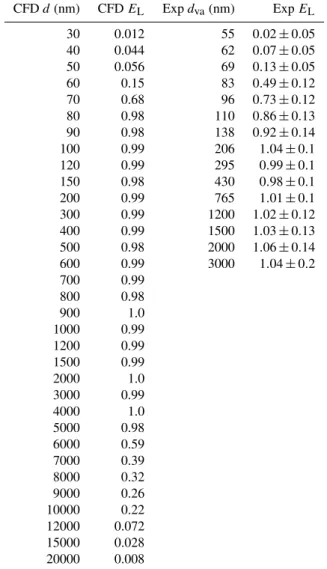
Table 2.Calculated and experimental transmission efficiency,EL,
for the high-pressure lens.
CFDd(nm) CFDEL Expdva(nm) ExpEL
30 0.012 55 0.02±0.05 40 0.044 62 0.07±0.05 50 0.056 69 0.13±0.05 60 0.15 83 0.49±0.12 70 0.68 96 0.73±0.12 80 0.98 110 0.86±0.13 90 0.98 138 0.92±0.14 100 0.99 206 1.04±0.1 120 0.99 295 0.99±0.1 150 0.98 430 0.98±0.1 200 0.99 765 1.01±0.1 300 0.99 1200 1.02±0.12 400 0.99 1500 1.03±0.13 500 0.98 2000 1.06±0.14 600 0.99 3000 1.04±0.2 700 0.99
800 0.98 900 1.0 1000 0.99 1200 0.99 1500 0.99 2000 1.0 3000 0.99 4000 1.0 5000 0.98 6000 0.59 7000 0.39 8000 0.32 9000 0.26 10000 0.22 12000 0.072 15000 0.028 20000 0.008
velocity calibration (Sect. 3.2), where
dva=ρpρ0×dm×S, (3)
andρp(g cm−3)is the material density,ρ0(g cm−3)unit den-sity,dm(nm) the mobility diameter andSthe empirically de-termined Jayne shape factor, which incorporates the effective particle density (Jayne et al., 2000; DeCarlo et al., 2004). For the transmission efficiency measurements presented here, all measurements were made in pToF mode with the quadrupole mass spectrometer set to a single mass.
particle counter (OPC, Grimm Model 1.109). For particles withdmob<250 nm, the size distribution was measured with a scanning mobility particle sizer (SMPS, TSI Model 3936). Two methods were used to experimentally determineEL in the AMS with size-selected particles (Jayne et al., 2000; Liu et al., 2007). The first method was the single particle counting method. In pToF mode, particles that enter the AMS can be counted individually in two ways. First, individual particles can be counted with the mass spectrometer. Each vaporized particle produces a burst of ions at the monitored
m/z. For NH4NO3particles detected atm/z46 (or NaNO3 particles detected atm/z30), the ion signal for particles with
dm> 100 nm will cross a threshold set just above the back-ground noise and will be counted as individual particles. Sec-ond, single particles withdm> 250 nm can also be counted individually with the scattered light pulses in the LS module. The ratio of AMS counted particles (by MS or LS, in parti-cles cm−3)to CPC counts (particles cm−3)givesE
Lfor that size:
EL(dva)=
CountsAMS(dva) CountsCPC(dva)
. (4)
The second method was the mass comparison method. Smaller particles (dm< 100 nm) do not create a sufficiently large ion signal to be counted individually with the mass spectrometer. However, the total particle mass for the ensem-ble can be accurately obtained by signal averaging (Jayne et al., 2000). In the mass method, the mass measured with the AMS is compared to the mass calculated for the number of particles counted by the CPC for a givendva.
EL(dva)=
MassAMS(dva) MassCPC(dva)
(5) The CPC counts the total number of particles entering the AMS and was corrected for doubly and triply charged par-ticles based on the SMPS scan. MassCPC(dva) (µg m−3) is calculated from the number of singly charged particles (CountsCPC, particles cm−3),d
m(nm) selected by the DMA, the material density (ρp, g cm−3) and the Jayne shape factor (S)for the particle composition:
MassCPC(dva)=10−9CountsCPC
π
6 hdmi 3ρ
pS, (6)
where the factor of 10−9accounts for unit conversion. When doubly or triply charged particles pass through the DMA, the pToF mode is used to separate the different size modes in the AMS signal. An effective mass to ion ratio (EMI, µg m−3Hz−1)was used to convert the AMS ion signal at a single fragmentm/zto total particle mass for the singly charged particles. The EMI for NH4NO3atm/z= 46 was ob-tained atdm=300 nm, where the AMS and CPC count rates matched (i.e.,EL=1)
EMI=MassCPC(300 nm)
AMSi(300 nm)
, (7)
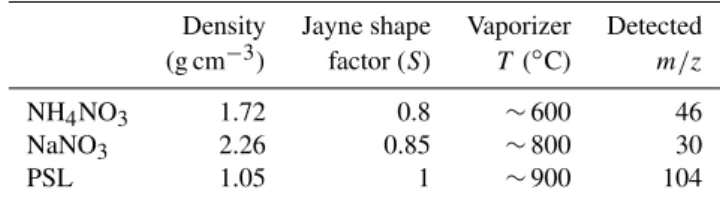
Table 3.Properties of materials used for the transmission efficiency experiments.
Density Jayne shape Vaporizer Detected (g cm−3) factor (S) T (◦C) m/z NH4NO3 1.72 0.8 ∼600 46
NaNO3 2.26 0.85 ∼800 30
PSL 1.05 1 ∼900 104
where AMSi(Hz or ions s−1)is the ion signal atm/z=46. The transmission efficiency,EL(dva), using the mass com-parison method was determined by making simultaneous AMS, CPC and SMPS measurements of DMA size-selected particles and using the equation for the mass of singly charged particles atdva:
EL(dva)=
MassAMS(dva) MassCPC(dva)
=EMI×AMSi(dva)
MassCPC(dva)
, (8)
where MassCPCis defined in Eq. (6).
Using the mass comparison method to measure EL as-sumes that the bounce (EB) and particle beam spreading (ES)contributions to AMS collection efficiency are negli-gible. For the sizes of NH4NO3 particles used (dva= 50 to 300 nm),EB=1 and, therefore, particle bounce does not de-crease the collection efficiency. Aerodynamic lenses focus larger particles more tightly than smaller particles. For very small particles (i.e., withdva<70 nm), the particle beam di-ameter can be larger than the vaporizer didi-ameter, causing a decrease in collection efficiency (ES<1). We have not applied a correction for ES to the data presented here be-cause the CE for particles smaller than 70 nm is already small (<0.2) and the correction is probably less than 20 % and not well-quantified. The CFD model results indicated that parti-cle beam spreading decreases CE for partiparti-cle sizes smaller than 60 or 70 nm by 10 to 20 %. In addition, experimental results for 40 nm particles with a similar standard lens in Liu et al. (1995b) suggest a 10 % decrease in CE for the AMS detector geometry (Huffman et al., 2005).
All particle concentrations were well above the AMS de-tection limit. For example, for NH4NO3particles withdm= 55 nm, the number of particles used would provide a signal-to-noise ratio (SNR) of ∼70 over 1 min of averaging. For larger sizes, the concentration required for a SNR of 2 falls quickly to∼1 cm−3, and the concentrations used were well above this. This estimate provides a check to show that if particles were not detected, it was due toELrather than the detection sensitivity of the mass spectrometer.
3.1.2 Results
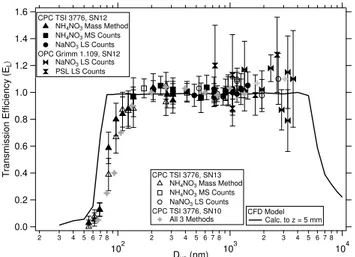
in good agreement with one another. Betweendva=130 nm and 1400 nm, the count method was used with NH4NO3and NaNO3particles. Particles were counted with a CPC at the entrance to the AMS and counted with both the mass spec-trometer and light scattering after passing through the lens system. Under some conditions, particles have been observed to bounce off the vaporizer in the AMS (Quinn et al., 2006; Matthew et al., 2008), thus decreasing the MS counts relative to the LS counts. In these experiments, good agreement be-tween mass spectrometer particle counts and light scattering particle counts for NH4NO3indicates that particle bounce off the vaporizer was minimal, and only MS counts are shown in Fig. 4 (closed squares SN12, open squares SN13). For NaNO3, MS counts were typically 10 to 20 percent lower than LS counts, indicating some particle bounce. Since the goal is to measure the lens transmission efficiency, only the data for LS counting of NaNO3particles are shown in Fig. 4 (closed circles SN12, open circles SN13). Similar transmis-sion efficiencies (EL> 50 % for dva between 100 nm and 3 µm) were measured for a third high-pressure lens (SN10) and are shown in Fig. 4 without error bars and with a single symbol for all three methods (grey stars) in order to simplify the figure.
For particles withdva> 1400 nm, the CPC undercounted particles and the undercounting increased with increasing particle size. Presumably, particles in this size range are lost inside the CPC due to impaction. For this size range and SN12, we instead used a Grimm OPC to count the particles entering the AMS. The Grimm OPC is designed to count particles between 250 nm and 32 µm in diameter. We split the flow from the DMA with a wye between the OPC (200 cm3min−1) and the AMS (85 cm3min−1) and added filtered makeup air to bring the OPC inlet flow to 1.2 L min−1. We used a Brechtel DMA because it can se-lect particles with larger mobility diameters than the TSI DMA. PSL particles were measured without passing through a DMA and were counted only with light scattering in the AMS due to significant bouncing from the vaporizer. The small surfactant particles associated with generating PSLs in an atomizer were discriminated against by size in both the AMS and the OPC. Note that the data points for SN10 and SN13 fordva> 1400 nm were measured using a CPC. These points have been corrected for the CPC undercounting with a correction factor determined by comparing CPC counts and OPC counts for particles in this size range.
The error bars on the experimental points determined by the mass method are estimated from the uncertainty in EMI (±15 %), CPC counts (±5 %), and dm (±5 nm). The error due to ion counting statistics in the mass spectrometer was negligible. The error bars in the count method are deter-mined from the standard deviation in the CPC and AMS par-ticle counts for 1 min averages, typically ±5 % and±8 %, respectively. At least 2000 particles were counted for each point. The error bars are much larger when counting with the OPC because particle concentrations were low (∼50 to
1.6
1.4
1.2
1.0
0.8
0.6
0.4
0.2
0.0
Transmission Efficiency (E
L
)
2 3 4 5 6 7 8 102
2 3 4 5 6 7 8 103
2 3 4 5 6 7 8 104 Dva (nm)
CPC TSI 3776, SN12 NH4NO3 Mass Method
NH4NO3 MS Counts
NaNO3 LS Counts
OPC Grimm 1.109, SN12 NaNO3 LS Counts
PSL LS Counts
CFD Model Calc. to z = 5 mm CPC TSI 3776, SN13
NH4NO3 Mass Method
NH4NO3 MS Counts
NaNO3 LS Counts
CPC TSI 3776, SN10 All 3 Methods
Fig. 4.Experimentally determined transmission efficiency (EL)as
a function of particle size for three examples of the HPL (SN10, SN12 and SN13), using the mass method (triangles) and the count method (other symbols). Particles entering the AMS were counted with a CPC or an OPC, and particles transmitted by the lens system were measured with the mass spectrometer or with light scattering signals. The CFD calculation (extending toz=5 mm past the exit nozzle) is shown with the solid line.
100 p cm−3)for these large sizes and each point corresponds to a total of 200 to 300 particles.
Figure 4 shows that the lens transmission efficiencies measured for three different examples of the HPL (SN10, SN12 and SN13) are in good agreement and demon-strate EL> 50 % between approximately dva=80 nm and
dva> 3 µm. The experimentalELpoints are given in Table 2 as averages in size bins centered on thedvain the table.
3.2 Particle velocity
Particle velocities were determined experimentally from the particle time of flight divided by the path length between the chopper and the vaporizer. Particle time of flight was measured at the peak of the time-resolved mass signal at
m/z=46 for NH4NO3and atm/z=30 for NaNO3. Results for two different HPLs (SN10 and SN12) are in good agree-ment with each other and with the CFD model calculations as shown in Fig. 2. The particle velocity,v (m s−1), in the AMS is fit with an empirical equation (Allan et al., 2003):
v=vl+(vg−vl)/(1+(dva/d∗)b), (9)
wherevl (m s−1)represents the gas velocity in the lens, vg (m s−1)the gas velocity at the lens exit, andd∗ (nm) andb
Table 4.Measured and calculated particle beam widths.
BWP-HPL Calculated Standard
σ σ lensσ∗
102 nm PSL 0.4±0.1 0.35 0.3 300 nm NH4NO3 0.2±0.1 0.11 0.18 500 nm NH4NO3 0.1±0.05 0.1
∗Huffman et al. (2005).
3.3 Particle beam width
Particle beam widths were measured at three particle sizes using a beam width probe (BWP) (Huffman et al., 2005). The BWP passes a vertical, 0.5 mm wide wire through the particle beam, stopping at fixed horizontal locations. The at-tenuation in particle signal was recorded as a function of wire position, and the particle beam width was determined using the model in Huffman et al. (2005). Particle beam widths, re-ported asσfor a one-dimensional Gaussian, are given in Ta-ble 4 for 100 nm PSL particles, and size-selecteddm=300 and 500 nm NH4NO3particles. The measured values are in good agreement with the beamwidth determined from the CFD model by calculating the arrival positions at the target (vaporizer) of 100 particles at each size. The particle beam widths are similar to those measured for the standard lens for 100 nm PSLs anddm=300 nm NH4NO3particles (Huffman et al., 2005).
4 Machining the high-pressure lens
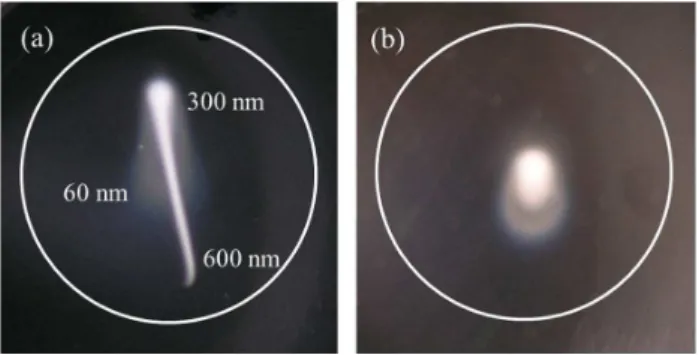
The small aperture sizes in the HPL are difficult to machine. If the apertures are not centered on the lens axis or are not perfectly round, they can distort the gas flow field and there-fore the particle trajectories. We tested the quality of the lens apertures by observing the deposition of polydisperse NH4NO3particles that have been transmitted by the lens sys-tem and impact the end of an acrylic rod that has been posi-tioned in the AMS vacuum chamber in place of the heated tungsten vaporizer. The deposition pattern for HPL SN10 is a long streak (Fig. 5a), indicating that different size parti-cles are focusing to different downstream radial positions, while the pattern for HPL SN12 is circular (Fig. 5b), indi-cating that different size particles are focused along the cen-terline of the lens. From deposition patterns of size-selected particles, we have determined that the diffuse region corre-sponds to approximately 60 to 70 nm particles, the brightest part to 300 nm particles and the narrow tail to 600 nm, as indicated by the numbers in Fig. 5a. Particle concentrations for sizes greater than 600 nm were too low to observe in the deposition patterns for polydisperse distributions shown in Fig. 5. Visual inspection of the apertures under a microscope showed defects along the edges of the SN10 apertures and nozzle that are likely the sources of the poor focusing.
Fig. 5.Deposition patterns of polydisperse NH4NO3transmitted by the lens system for(a)HPL SN10 and(b)HPL SN12. The white circle represents the size of the vaporizer. The numbers are approxi-mate particle sizes for different parts of the deposition pattern based on measurements with size-selected particles.
Traditional machining techniques, such as drilling the aperture holes, were unsuccessful in making apertures that could focus a broad range of particle sizes into a narrow beam. Electrical discharge machining (EDM) for the aper-tures was more successful. For example, in a set of five lenses machined using EDM, two gave compact deposition patterns like Fig. 5b, two gave dispersed deposition patterns like Fig. 5a, and one gave an intermediate deposition pat-tern. We have experimented with using aluminum instead of stainless steel for the apertures and lens tube and found a sim-ilar success rate. The straightness of the lens tube into which the apertures are inserted is also important. We used heat-treating and annealing of the aluminum lens tubes to improve straightness. We continue to refine the machining specifica-tions so that we can consistently obtain deposition patterns like the one for SN12.
Imperfections in the machining of the lens apertures are also likely the source of the disagreement in EL below
EL for SN10 for larger particles (200 nm to 3 µm) was the same as SN12 as long as the lens was re-aimed twice (at
dva=700 nm anddva=1.5 µm) so that the particles reached the detector.
5 Comparison with other high-pressure lens measurements
Schreiner et al. (1999) have published transmission effi-ciency measurements for two aerodynamic lenses that op-erate at pressures from 1333 to 20 000 Pa (10 to 150 Torr). They reported transmission efficiencies > 90 % for the size range 340 nm to 3 µm with the detector located 100 mm from the lens exit. The Schreiner et al. (1999) results are consis-tent with the transmission efficiencies reported here for this high-pressure lens. The Schreiner lens is not, however, use-ful for the AMS because the particle beam divergence is too high. If the Schreiner lens particle beam traveled the 350 mm to the AMS detector, the particle beam width would be much larger than the diameter of the vaporizer for most particle sizes (Schreiner et al., 1999). In addition, the Schreiner lens focuses different particle sizes to different radial locations (Schreiner et al., 1999), much like SN10 shown in Fig. 5a, and is not compatible with the detection geometry in the AMS.
The aerosol time-of-flight mass spectrometer (ATOFMS, previously marketed by TSI) used an aerodynamic focusing inlet to transmit particles between 100 nm and 3 µm in diam-eter with close to 100 % efficiency, according to the prod-uct literature (TSI, 2004). A detailed characterization of the transmission efficiency of this inlet over its full size range has not been published.
6 Conclusions
A newly designed and characterized lens system for the AMS transmits particles between 80 nm and at least 3 µm in di-ameter. Relative to the standard lens in common use in cur-rent AMS instruments, major design changes include (1) re-designing the critical orifice holder and valve to remove paction sites, (2) introducing a relaxation chamber that im-proves the transmission of large particles, and (3) increasing the operating pressure of the lens to improve the focusing of large particles. The increased lens pressure was the pri-mary cause of increased transmission for particles larger than 1 µm in diameter, while the relaxation chamber increased the transmission of particles larger than 2 µm in diameter. The design was optimized with CFD model calculations, and the lens was characterized experimentally with size-selected par-ticles. The new lens will enable ambient PM2.5 measure-ments by the AMS and will open new areas of application such as drug delivery aerosols and biological particles. The new lens will also be useful for other instruments that require a focused particle beam.
Acknowledgements. This project was supported by the NSF Small Business Innovation Research Program, contract #0216220, the EPA Small Business Innovation Research Program, contract #EP-D-05-057, the DOE Small Business Innovation Research Program, contract #DE-SC0001673, and the NASA Small Business Innovation Research Program, contract #NNX10CA32C. K. Moore and J. McInnis were supported by the US DOE GCEP SURE program. M. Farrar was supported by the NSF RET program. The Aerodyne authors thank W. Guenther at the Paul Scherrer Institute, Switzerland, for assistance with the machining details.
Edited by: P. Herckes
References
Allan, J. D., Coe, H. N., Bower, K., Williams, P. I., Gallagher, M. W., Alfarra, M. R., Jiménez, J. L., Worsnop, D. R., Jayne, J. T., Canagaratna, M. R., Nemitz, E., and McDonald, A. G.: Quanti-tative sampling using an Aerodyne aerosol mass spectrometer 1. Techniques of data interpretation and error analysis, J. Geophys. Res., 108, 4090, doi:4010.1029/2002JD002358, 2003.
ANSYS Fluent: available at: http://www.ansys.com/ (last access: 6 June 2012), 2012.
Canagaratna, M. R., Jayne, J. T., Jiménez, J. L., Allan, J. D., Al-farra, M. R., Zhang, Q., Onasch, T. B., Drewnick, F., Coe, H., Middlebrook, A., Delia, A., Williams, L. R., Trimborn, A. M., Northway, M. J., DeCarlo, P. F., Kolb, C. E., Davidovits, P., and Worsnop, D. R.: Chemical and Microphysical Characterization of Ambient Aerosols with the Aerodyne Aerosol Mass Spec-trometer, Mass. Spectrom. Rev., 26, 185–222, 2007.
Cross, E. S., Slowik, J. G., Davidovits, P., Allan, J. D., Worsnop, D. R., Jayne, J. T., Lewis, D. K., Canagaratna, M., and Onasch, T. B.: Laboratory and ambient particle den-sity determinations using light scattering in conjunction with aerosol mass spectrometry, Aerosol Sci. Tech., 41, 343–359, doi:10.1080/02786820701199736, 2007.
DeCarlo, P., Slowik, J. G., Worsnop, D. R., Davidovits, P., and Jiménez, J. L.: Particle Morphology and Density Characteriza-tion by Combined Mobility and Aerodynamic Diameter Mea-surements. Part 1: Theory, Aerosol Sci. Tech., 38, 1185–1205, doi:10.1080/027868290903907, 2004.
Hinds, W. C.: Aerosol Technology: Properties, Behavior, and Mea-surements of Airborne Particles, John Wiley & Sons, Inc., New York, 1999.
Huffman, J. A., Jayne, J. T., Drewnick, F., Aiken, A. C., Onasch, T., Worsnop, D. R., and Jiménez, J. L.: Design, Modeling, Optimiza-tion, and Experimental Tests of a Particle Beam Width Probe for the Aerodyne Aerosol Mass Spectrometer, Aerosol Sci. Tech., 39, 1143–1163, doi:10.1080/02786820500423782, 2005. Jayne, J. T., Leard, D. C., Zhang, X., Davidovits, P., Smith, K. A.,
Kolb, C. E., and Worsnop, D. R.: Development of an Aerosol Mass Spectrometer for Size and Composition Analysis of Sub-micron Particles, Aerosol Sci. Tech., 33, 49–70, 2000.
Lee, K.-S., Kim, S., and Lee, D.: Aerodynamic focusing of 5–50 nm nanoparticles in air, J. Aerosol Sci., 40, 1010–1018, 2009. Lee, K.-S., Hwang, T.-H., Kim, S.-W., Kim, S. H., and Lee, D.:
Nu-merical Simulations on Aerodynamic Focusing of Particles in a Wide Size Range of 30 nm–10 µm, Aerosol Sci. Tech., 47, 1001– 1008, 2013.
Liu, P., Ziemann, P. J., Kittleson, D. B., and McMurry, P. H.: Gen-erating particle beams of controlled dimensions and divergence: I. Theory of particle motion in aerodynamic lenses and nozzle expansions, Aerosol Sci. Tech., 22, 293–313, 1995a.
Liu, P., Ziemann, P. J., Kittleson, D. B., and McMurry, P. H.: Gen-erating particle beams of controlled dimensions and divergence: II. Experimental Evaluation of Particle Motion in Aerodynamic Lenses and Nozzle Expansions, Aerosol Sci. Tech. , 22, 314–324, 1995b.
Liu, P. S. K., Deng, R., Smith, K. A., Jayne, J. T., Williams, L. R., Canagaratna, M. R., Moore, K., Onasch, T. B., Worsnop, D. R., and Deshler, T.: Transmission Efficiency of an Aerodynamic Focusing Lens System: Comparison of Model Calculations and Laboratory Measurements for the Aerodyne Aerosol Mass Spec-trometer, Aerosol Sci. Tech., 41, 721–733, 2007.
Matthew, B. M., Middlebrook, A. M., and Onasch, T. B.: Collec-tion Efficiencies in an Aerodyne Aerosol Mass Spectrometer as a Function of Particle Phase for Laboratory Generated Aerosols, Aerosol Sci. Tech., 42, 884–898, 2008.
Onasch, T. B., Trimborn, A., Fortner, E. C., Jayne, J. T., Kok, G. L., Williams, L. R., Davidovits, P., and Worsnop, D.: Soot Particle Aerosol Mass Spectrometer: Development, Valida-tion, and Initial ApplicaValida-tion, Aerosol Sci. Tech., 46, 804–817, doi:10.1080/02786826.2012.663948, 2012.
Peck, J., Gonzalez, L., Williams, L., Worsnop, D. R., Miake-Lye, R. C., Smith, K. A., and Timko, M. T.: Development of an Aerosol Mass Spectrometer Lens System for PM2.5, Aerosol Sci. Tech-nol., in preparation, 2013.
Quinn, P. K., Bates, T. S., Coffman, D., Onasch, T. B., Worsnop, D., Baynard, T., de Gouw, J. A., Goldan, P. D., Kuster, W. C., Williams, E., Roberts, J. M., Lerner, B., Stohl, A., Pet-tersson, A., and Lovejoy, E. R.: Impacts of sources and aging on submicrometer aerosol properties in the marine boundary layer across the Gulf of Maine, J. Geophys. Res., 111, D23S36, doi:10.1029/2006JD007582, 2006.
Schreiner, J., Schild, U., Voigt, C., and Mauersberger, K.: Focusing of Aerosols into a Particle Beam at Pressures from 10 to 150 Torr, Aerosol Sci. Tech., 31, 373–382, 1999.
TSI: Series 3800 Aerosol Time-of-Flight Mass Spectrometers with Aerodynamic Focusing Lens Technology, available at: www.tsi. com (last access: 10 February 2013), 2004.
Wang, X. and McMurry, P. H.: A Design Tool for Aerodynamic Lens Systems, Aerosol Sci. Tech., 40, 320–334, 2006.
Zhang, X., Smith, K. A., Worsnop, D. R., Jiménez, J., Jayne, J. T., and Kolb, C. E.: A Numerical Characterization of Particle Beam Collimation by an Aerodynamic Lens-Nozzle System. Part 1, An Individual Lens or Nozzle, Aerosol Sci. Tech., 36, 617–631, 2002.