www.atmos-chem-phys.net/14/2887/2014/ doi:10.5194/acp-14-2887-2014
© Author(s) 2014. CC Attribution 3.0 License.
Atmospheric
Chemistry
and Physics
Characterization of submicron aerosols during a month of serious
pollution in Beijing, 2013
J. K. Zhang1,2, Y. Sun1, Z. R. Liu1, D. S. Ji1, B. Hu1, Q. Liu1, and Y. S. Wang1
1State Key Laboratory of Atmospheric Boundary Layer Physics and Atmospheric Chemistry (LAPC), Institute of
Atmospheric Physics, Chinese Academy of Sciences, Beijing 100029, China
2University of Chinese Academy of Sciences, Beijing 100049, China
Correspondence to:Y. S. Wang ([email protected])
Received: 23 May 2013 – Published in Atmos. Chem. Phys. Discuss.: 16 July 2013 Revised: 24 January 2014 – Accepted: 7 February 2014 – Published: 20 March 2014
Abstract.In January 2013, Beijing experienced several se-rious haze events. To achieve a better understanding of the characteristics, sources and processes of aerosols during this month, an Aerodyne high-resolution time-of-flight aerosol mass spectrometer (HR-ToF-AMS) was deployed at an ur-ban site between 1 January and 1 February 2013 to obtain the size-resolved chemical composition of non-refractory submi-cron particles (NR-PM1). During this period, the mean
mea-sured NR-PM1mass concentration was 89.3±85.6 µg m−3,
and it peaked at 423 µg m−3. Positive matrix factorization
(PMF) differentiated the organic aerosol into five compo-nents, including a highly oxidized, low-volatility oxygenated organic aerosol (LV-OOA), a less oxidized, semi-volatile oxygenated OA (SV-OOA), a coal combustion OA (CCOA), a cooking-related OA (COA), and a hydrocarbon-like OA (HOA), which on average accounted for 28 %, 26 %, 15 %, 20 % and 11 % of the total organic mass, respectively.
A detailed comparison between the polluted days and un-polluted days found many interesting results. First, the or-ganic fraction was the most important NR-PM1species
dur-ing the unpolluted days (58 %), while inorganic species were dominant on polluted days (59 %). The OA composition also experienced a significant change; it was dominated by pri-mary OA (POA), including COA, HOA and CCOA, on un-polluted days. The contribution of secondary OA (SOA) in-creased from 35 % to 63 % between unpolluted and polluted days. Second, meteorological effects played an important role in the heavy pollution in this month and differed signif-icantly between the two types of days. The temperature and relative humidity (RH) were all increased on polluted days and the wind speed and air pressure were decreased. Third,
the diurnal variation trend in NR-PM1species and OA
com-ponents showed some differences between the two types of days, and the OA was more highly oxidized on polluted days. Fourth, the effects of air masses were significantly different between the two types of days; air was mainly transported from contaminated areas on the polluted days. The compar-ison also found that the aerosol was more acidic on polluted days. Additionally, the variation trends of the mass concen-tration and mass fractions of NR-PM1species and OA
com-ponents were more dramatic when the NR-PM1mass loading
was at a higher level. The serious pollution observed in this month can be attributed to the synergy of unfavorable me-teorological factors, the transport of air masses from high-pollution areas, emission by local sources, and other factors.
1 Introduction
Beijing is one of the most economically developed regions in China, with a population of more than 20 million and a vehicle fleet of approximately 5 million (Beijing Munici-pal Bureau of Statistics). The rapid development of a variety of industries, including power generation, industrial produc-tion, and transportaproduc-tion, have resulted increased emission of particulate matter (PM). The most serious PM pollution of this century appeared in January 2013, when the highest in-stantaneous concentration of PM2.5reached 1000 µg m−3in
lung, leading to adverse effects on human health. These parti-cles also have important effects on visibility, climate forcing, and the deposition of acids and nutrients to ecosystems and crops (Ulbrich et al., 2009). However, the submicron parti-cles affecting China are still poorly understood because their heterogeneous distribution and short atmospheric lifetimes make it difficult to characterize their chemical and physical properties (Mohr et al., 2011).
In addition to inherent difficulties posed by the nature of fine particles, our level of understanding of the na-ture, sources, processes and effects of fine particles is cur-rently limited by the available instrumentation. Most previ-ous aerosol studies have been based on filter samplings fol-lowed by laboratory analyses. However, this analysis method has many drawbacks: its resolution is lower, the experiments are limited by the small amount of material collected, and organic aerosols cannot be analysis in-depth. (Hildebrandt et al., 2010; Huang et al., 2010; Ge et al., 2012a). Aerosol mass spectrometers (AMS) have been widely applied in recent years because they allow for chemical speciation and for the sizing and mass detection of submicron non-refractory PM1
at a high time resolution (Canagaratna et al., 2007; Mohr et al., 2012). The application of high-resolution time-of-flight aerosol mass spectrometer (HR-ToF-AMS) for ambient stud-ies is relatively new; it has been used only in recent years (DeCarlo et al., 2006). The use of HR-ToF-AMS provides significantly improved chemical resolution and sensitivity. In particular, the highm/zresolution of the HR-ToF-AMS al-lows for most ion fragments to be resolved and for their nom-inal elemental compositions to be determined (Aiken et al., 2008; Sun et al., 2011b).
Over the last decade, many aerosol studies have revealed that organic aerosol (OA) is the most abundant component of fine particles and that it makes up a large fraction (20 to 90 %) of the submicron particulate mass (Murphy et al., 2006; Zhang et al., 2007). OA is the sum of multiple pri-mary and secondary sources that can evolve due to aging processes. Correctly apportioning organic aerosols into their sources and components is a critical step towards enabling ef-ficient control strategies and model representations (Ulbrich et al., 2009). Recently, AMS data have been combined with positive matrix factorization (PMF) to study OA in depth, which has led to new insights into the sources contributing to OA (Lanz et al., 2007; Ulbrich et al., 2009; Mohr et al., 2012). Based on the AMS measurements, hydrocarbon-like OA (HOA) from traffic, biomass burning OA (BBOA), and oxygenated OA (OOA) have been distinguished in many data sets where secondary organic aerosol (SOA) is assumed to be the main contributor to OOA (Jimenez et al., 2009; Lanz et al., 2010). In addition, some studies further separated the OOA into a low volatility fraction (LV-OOA) and a semi-volatile fraction (SV-OOA) (Lanz et al., 2007; Aiken et al., 2008; Huang et al., 2010, 2011; Mohr et al., 2012).
Although it is the capital of China and experiences some of the worst air pollution in the world, there are currently
only a handful of reports focused on AMS studies of sub-micron particles in Beijing. In 2006, Sun et al. (2010) first used a Q-AMS to study non-refractory submicron particles (NR-PM1)in Beijing in the summer. They found that the
mean mass concentration was approximately 80 µg m−3and three OA components were first determined based on AMS organic spectra. In 2008, the first study to use a HR-ToF-AMS found that there was a significant decrease in NR-PM1
since the previous study; the mean mass concentration was found to be 61.1 µg m−3, and OA was differentiated into four components: hydrocarbon-like OA (HOA), cooking-related OA (COA), and two oxygenated OA (OOA-1 and OOA-2). Sun et al. (2012, 2013b) used an Aerodyne aerosol chemi-cal speciation monitor (ACSM) to study NR-PM1 in
sum-mer and winter in Beijing; they found that the composition of NR-PM1, the diurnal behaviors of NR-PM1species, and the
sources of OA were quite different between summer and win-ter. However, the ACSM could not provide information on the particle size distribution, and its resolution is lower than that of the AMS. The only study based on HR-ToF-AMS conducted in winter in Beijing focused exclusively on OA. Meanwhile, the AMS was only operated under V mode, another useful mode, W mode, was not utilized (Liu et al., 2012). Therefore, further HR-ToF-AMS studies of submi-cron particles in winter in Beijing are needed.
For this study, we deployed a high-resolution time-of-flight aerosol mass spectrometer (for the sake of simplicity, we will refer to this instrument as AMS in the following dis-cussion), manufactured by Aerodyne Research Inc. (Biller-ica, MA, USA), in urban Beijing to measure airborne sub-micron particles with a high time resolution during a month of serious pollution. The main findings include (1) the mass concentrations, size distributions, chemical composition, and temporal and diurnal variations of NR-PM1species; (2) the
characteristics and dynamic variations of the OA components as determined via positive matrix factorization (PMF) of the high-resolution mass spectra (HRMS); and (3) an analysis and comparison of the characteristics, sources and impact factors of NR-PM1and OA components during unpolluted
and polluted days.
2 Experimental methods
2.1 Sampling site description
Online AMS measurements of the chemical composition and size distribution of the NR-PM1 aerosol components were
West Road running east–west to its north. Ambient air was sampled at approximately 15 m above the ground.
Simultaneously, an automatic meteorological observation instrument (Milos520, Vaisala, Finland) was located at the 8 m level and was used to observe key meteorological pa-rameters, including temperature, humidity, air pressure, and the speed and direction of wind in the atmosphere at ground level. Data on NOxwere acquired from the Beijing–Tianjin–
Hebei Atmospheric Environment Monitoring Network (a long-term observation network). These data were measured using an NO-NO2-NOxchemiluminescence analyzer (Model
42i, Thermo-Fisher Scientific (TE), USA). Data were col-lected every 5 min. Ambient air was sampled at approxi-mately 8 m above ground. The distance between the sam-ple inlets of HR-ToF-AMS and the NOxdetection instrument
was approximately 20 m.
2.2 HR-ToF-AMS measurement and data processing
2.2.1 HR-ToF-AMS operation
A detailed description of the instrument can be found in De-Carlo et al. (2006). During this campaign, the AMS was op-erated under both the “V” and “W” ion optical modes, alter-nating every 7.5 min. The V-mode is more sensitive, whereas the W-mode has a higher mass resolution. Under V-mode op-eration, the AMS cycled through the mass spectrum (MS) mode and the particle time-of-flight (PToF) mode every 45 s, spending 22.5 s and 22.5 s in its open and closed status under the MS mode, respectively. No PToF data were sampled in W-mode due to its limited signal-to-noise (S / N) ratio. How-ever, the high mass resolution (∼5000–6000) of W-mode al-lowed for the determination of the ion-specific mass spectra and thus the elemental compositions of OA (DeCarlo et al., 2006; Aiken et al., 2008).
The AMS was calibrated for inlet flow, ionization effi-ciency (IE), and particle sizing at the beginning, middle and end of the campaign following standard protocols (Jayne et al., 2000; Jimenez, et al., 2003; Drewnick et al., 2005). IE calibration was conducted using size-selected pure ammo-nium nitrate particles, and particle size calibration was con-ducted using mono-disperse polystyrene latex spheres. The detection limit (DL) of each individual species was taken to be three times the standard deviation of the corresponding signal in particle-free air (DeCarlo et al., 2006; Sun et al., 2009). As a result, the 5 min DLs of organics, sulfate, nitrate, ammonium, and chloride were 0.056, 0.006, 0.008, 0.04 and 0.014 µg m−3, respectively.
2.2.2 HR-ToF-AMS data analysis
The mass concentrations and size distributions of the species measured with the AMS were calculated using methods outlined in DeCarlo et al. (2006). The standard ToF-AMS data analysis software packages SQUIRREL version
1.50 and PIKA version 1.09, both downloaded from the ToF-AMS-Resources web page (http://cires.colorado.edu/ jimenez-group/ToFAMSResources), were used to generate unit and high-resolution mass spectra from the V-mode and W-mode data, respectively (Huang et al., 2010; He et al., 2011). The V-mode and PToF data were processed using SQUIRREL to determine the mass concentrations and size distributions of the NR-PM1 species, and the W-mode data
were processed using PIKA to obtain high-resolution mass spectra and identify the elemental compositions of the or-ganic species.
A collection efficiency (CE) was introduced to account for the incomplete transmission and detection of particles by the HR-ToF-AMS during this study. Middlebrook et al. (2012) evaluated the dependency of CE on aerosol composition and concluded that the CE of acidic particles or particles with a high nitrate fraction (e.g., NH4NO3 40 % of PM1)may
in-crease, whereas the CE of dry particles does not show sig-nificant change with the organic fractions. In this study, to reduce the uncertainty in CE due to particle-phase water, a silica gel diffusion dryer was introduced to keep the relative humidity in the sampling line below 40 %. In addition, as presented in Fig. S2, the mass fraction of ammonium nitrate (ANMF) in this study was normally below 0.4. Ammonium nitrate is thus expected to have only a minor effect on CE. Therefore, the CE is mainly driven by aerosol acidity, and the relationship between CE and aerosol acidity can be param-eterized as CEdry=max (0.45, 1.0–0.73(NH4/ NH4,predict))
(Middlebrook et al., 2012). Because high-acidity aerosol was observed in this study (Sect. 3.5.3), variable CEs that were calculated using the equation above were applied. The rela-tive ionization efficiency (RIE) values used in this study were 4.0 for ammonium, 1.2 for sulfate, 1.1 for nitrate, 1.3 for chloride and 1.4 for organics (Jimenez et al., 2003).
Positive matrix factorization (PMF) (Paatero and Tap-per, 1994) analyses were performed on the HRMS (i.e., the ion-speciated W-mode spectra) using the PMF Evaluation Toolkit (PET) v2.05 (Ulbrich et al., 2009). The HRMS data and error matrices were generated as outlined in DeCarlo et al. (2010). Data and error matrices were first generated in PIKA. We considered only ions up to m/z120, given that larger ions had a low signal-to-noise ratio and were more biased because of an insufficient mass resolution. Isotopes were systematically constrained in PIKA, but they were then removed from the data and error matrices because their pres-ence would have given excess weight to the parent ions in the PMF analysis (Setyan et al., 2012). Ions with an S / N ratio < 0.2 were removed from the HRMS data and error ma-trices before the PMF analysis. The “weak” ions with S / N between 0.2 and 2 were downweighted by increasing their errors by a factor of 2 (Paatero and Hopke, 2003; Ulbrich et al., 2009). More technical details on the PMF analysis can be found in other recent publications (Ulbrich et al., 2009).
Detailed information can be found in the supplementary in-formation (discussion S1 and Fig. S3). Finally, the 5-factor, FPEAK= −0.1, seed=0 solution was chosen as the optimal solution for this analysis.
An elemental analysis of the HRMS data for C, H, O, and N time series and ratios was performed using the APES v1.05 software within Igor Pro 6.21A.
3 Results and discussion
3.1 Submicron aerosol characteristics
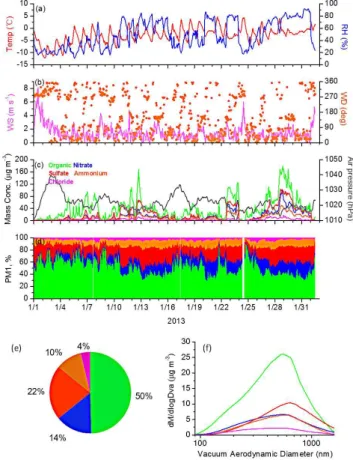
Figure 1 presents the time-resolved variation of organic, ni-trate, sulfate, ammonium, and chloride mass concentrations measured with the AMS and of the meteorological parame-ters (e.g., temperature, RH, wind speed and direction) from 1 January to 1 February 2013.
The meteorological conditions during the campaign are presented in Fig. 1a and b. The temperature had clear diur-nal cycles, with higher values observed during the daytime. Relative humidity showed peak values during the night. Dur-ing the campaign, the temperature varied from−12.1◦C to 4.6◦C, with an average of−2.8±3.1◦C. Relative humidity was in the range of 11 % to 92 %, averaging 49±23 %. Wind speed varied from 0 m s−1to 8.1 m s−1, with an average of 1.5±1.1 m s−1during the sampling period.
Figure 1c and d present the time series for the NR-PM1
species mass concentration and NR-PM1components during
the campaign, respectively. Several serious pollution events occurred during the month of the campaign. Therefore, the range of NR-PM1 mass concentrations was broad; values
ranging from 3.3 to 423 µg m−3were observed, and the mean
mass concentration was 89.3±85.6 µg m−3. These values are much higher than those observed in developed countries, such as the concentration of 11.0 µg m−3 observed in New York City in 2009 (Sun et al., 2011b) and the concentration of 14.8 µg m−3observed in Pittsburgh in 2002 (Zhang et al., 2005a). In addition, these values are higher than the other re-sults measured in Beijing in 2006 (80.0 µg m−3)by Sun et al. (2010) and in 2008 (61.1 µg m−3)by Huang et al. (2010). Similar to the total mass, the mass concentration of all the individual species also varied significantly. Organics, for ex-ample, sometimes reached concentrations over 180 µg m−3 and sometimes dropped to less than 2 µg m−3.
Figure S4 shows the time series for the NR-PM1
concen-trations measured using AMS and a tapered element oscillat-ing microbalance (TEOM, Rupprecht & Patashnick Co., Inc, model 1400A, Albany, New York) that was equipped with a Nafion diffusion dryer sample equilibration system (SES) along with a PM2.5inlet and sampled at 50◦C. The two
mea-surements are highly correlated, with a linear correlation co-efficient (R2)of 0.88 and a slope of 0.68 (Fig. S5).
As shown in Fig. 1e, organics were the most abundant NR-PM1species on average, accounting for 50 % of the
to-Fig. 1. Chemical compositions and size distributions of the NR-PM1during the campaign: time series of(a)ambient temperature and relative humidity;(b)wind direction and wind speed;(c) NR-PM1species concentrations and air pressure;(d)NR-PM1percent composition;(e)NR-PM1chemical composition; and(f)the aver-age size distributions of the AMS species.
emissions from coal combustion during the heating season (Sun et al., 2012).
Figure 1f presents the average mass-size distributions of each species determined by the AMS during the cam-paign. Generally, all species showed an apparent accumu-lation mode peaking at a relatively large size (600 nm), which is indicative of an aged regional aerosol (Zhang et al., 2005b). In addition, organics and nitrate showed an addi-tional mass distribution at smaller sizes (200 nm). The small size mode of the organics is most likely associated with mary emissions from vehicles, coal burning or other pri-mary sources (Canagaratna et al., 2004; Huang et al., 2010). Xiao et al. (2009) suggested that combustion-related emis-sions (e.g., traffic emisemis-sions) are likely the main source of the smaller mode. An enrichment of organics at smaller sizes was also observed in other urban AMS measurements (Aiken et al., 2009; Huang et al., 2010). The smaller mode of ni-trate may suggest that nini-trate’s formation pathways are more complex than are those of other inorganic species. Atmo-spheric nitrate formation pathways mainly include the het-erogeneous hydrolysis of N2O5during the night and the
gas-phase photochemical production of HNO3 during the
day-time. The ambient nitrate concentration is also driven by the gas-to-particle partitioning of ammonium nitrate and bound-ary layer dynamics (Sun et al., 2013a). The broader size dis-tribution of nitrate was also observed in 2006 in Canada (Sun et al., 2009). The complex formation pathways of nitrate have been discussed in many studies (Sun et al., 2011a).
3.2 Elemental composition of organic aerosol
The HRMS obtained in this study enabled the investiga-tion of the molecular ratios of C, H, O and N in the or-ganic aerosol. Figure 2a and b show the variations in the atomic ratios of H / C, N / C and O / C and the mass ratios of the OM / OC of OA during this campaign. The H / C ra-tio varied within a range of 1.33–1.68, with a mean value of 1.44±0.05, whereas the O / C ratio varied within a range of 0.14–0.58, with a mean value of 0.34±0.08. The O / C atomic ratio has been considered a good reference for the oxidation state and photochemical age of OA (Jimenez et al., 2009; Ng et al., 2010). This value is lower than that ob-served at Kaiping (0.47), a rural site downwind of the cen-tral Pearl River Delta area that receives pollutants through regional transport (Huang et al., 2011). This difference indi-cates that the pollutants emitted in an urban area age during the transport process, and the value reported here is fairly similar to other observed in Beijing (0.33) (Huang et al., 2010), Shenzhen (0.30) (He et al., 2011), Mexico City (0.38) (Aiken et al., 2009) and New York City (0.36) (Sun et al., 2011b). The N / C ratio varied between 0.005 and 0.026, with a mean value of 0.015±0.004.
The OM / OC ratio varied between 1.33 and 1.92 during this campaign, with an average of 1.60±0.11. The OM / OC mass ratio has been used extensively to convert the organic
carbon mass to the organic matter mass in filter-based aerosol chemistry studies. The OM / OC ratio correlated well with the O / C ratio (R2=0.99, Fig. S6). The mean OM / OC value in Beijing measured in this study is consistent with the pre-viously reported value of 1.60 (±0.2) for an urban aerosol (Turpin and Lim, 2001), and the results are similar to those measured in Shenzhen (1.57) (He et al., 2011) and New York City (1.62) (Sun et al., 2011b).
Figure 2c and d present the average diurnal variations of the H / C, N / C, O / C and OM / OC ratios. Because these ra-tios are influenced by relative organic constitutions rather than absolute organic concentrations, their diurnal patterns can be predominantly attributed to the diurnal variations in the relative importance of different sources (Huang et al., 2011). Both the O / C and OM / OC ratios reached peaks at 15:00–16:00 LT (note that all times throughout the text are in local time), which is when the photochemical production of secondary organic aerosols (SOA) with high O / C ratios is greatest. Similar results were obtained from the Pearl River Delta of China (He et al., 2011) and New York City (Sun et al., 2011b). However, this study detected an additional, significantly reduced at 12:00 that was not reported in other studies. This phenomenon may have been caused by the rel-ative contribution of the cooking source, which is a primary source of organic aerosol with a lower O / C ratio and is more prevalent in Beijing. The H / C ratio showed a diurnal pat-tern opposite to those observed for O / C and OM / OC, as expected. However, the N / C diurnal pattern was generally consistent with the pattern observed for O / C and OM / OC.
Figure 2e shows a Van Krevelen diagram (H / C vs. O / C) of OA using the data observed in Beijing. A significant anti-correlation (R2=0.43) with a slope of−0.43 was obtained. This slope is shallower than that observed in Shenzhen (ap-proximately−0.74) (He et al., 2011). As suggested by Heald et al. (2010), the shallower OA slope in the Van Krevelen dia-gram might reflect different aging mechanisms and/or the rel-ative mixing of fresh and aged air masses in Beijing (Heald et al., 2010). On average, C, H, O, and N contributed 73.6 %, 7.2 %, 16.5 % and 2.8 %, respectively, to the total organic mass (Fig. 2f).
3.3 Investigating OA components/sources with positive matrix factorization (PMF)
Fig. 2.The time series of(a)H / C and N / C ratios and(b)O / C and OM / OC ratios; and the average diurnal variations of(c)H / C and N / C ratios and(d)O / C and OM / OC ratios;(e)The Van Krevelen diagram; and(f)the average mass-based organic elemental compo-sition.
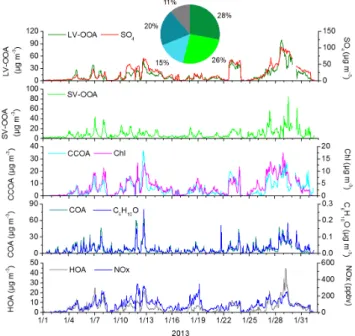
OOAs have been extensively identified in previous AMS studies (Sun et al., 2011b; Huang et al., 2011) and are gener-ally dominated by secondary organic aerosols that are formed in the atmosphere through the gas-to-particle conversion of the oxidation products of volatile organic compounds (Hal-lquist et al., 2009). The MS of LV-OOA and SV-OOA were similar; they had O / C ratios of 0.84 and 0.40, respectively. Both were characterized by prominent CxHyOz fragments,
especially CO+2 (m/z 44), suggesting the prevalence of ox-idized organic compounds. The MS of SV-OOA also dis-played a significant signal at the ion series CnH+2n+1 (m/z
29, 43, 57) and CnH+2n−1(m/z41, 55) from saturated
alka-nes, alkealka-nes, and cycloalkanes that was low in the MS of LV-OOA.
The O / C ratio of the LV-OOA identified in this cam-paign (0.84) was higher than the O / C ratio reported in stud-ies in other locations, including Kaiping (0.64) (Huang et al., 2011), Shenzhen (0.59) (He et al., 2011) and New York City (0.63) (Sun et al., 2011b), whereas the O / C ratio of SV-OOA (0.40) was close to that reported in those studies (0.39, 0.45 and 0.38, respectively). The LV-OOA time series showed a similar trend to the sulfate time series (R2=0.84) (Fig. 4), consistent with the relationship between LV-OOA
Fig. 3.The AMSm/zprofiles of the five OA components identified by PMF in this study.
and sulfate observed in other studies, for example, He et al. (2011) and DeCarlo et al. (2010). However, the correla-tion coefficient (R2)between SV-OOA and nitrate found in this study was 0.25, which is not as high as the values found in other studies, such as 0.65 and 0.66 for the Pearl River Delta region in South China (Huang et al., 2011; He et al., 2011). However, this value is higher than the results found in Barcelona (R2=0.22) (Mohr et al., 2012) and New York City (R2=0.05) (Sun et al., 2011b). The lower correlation can be explained by the more complex generation mecha-nisms of the two components in winter, especially the effect of aqueous-phase processing due to the fog process, as dis-cussed in Sect. 3.5. The two studies in the Pearl River Delta were conducted in summer.
Fig. 4.The average OA composition and time series of the OA com-ponents and other relevant species.
winter, when the temperature and oxidation state of the at-mosphere are lower than in summer.
Although coal has gradually been replaced with other fu-els, such as oil, natural gas and clean energy, in some coun-tries with higher economic development levels, coal remains the most important fuel in China due to an underdeveloped energy structure. Coal has been widely used in various in-dustries in China, including power generation, steel milling, and cement production. Moreover, coal is the primary fuel used for winter heating in northern China. In recent years, there have been more concerns about OA emissions from coal combustion due to their important impacts on climate changes and health effects (Zhang et al., 2008; Sun et al., 2013b). Zhang et al. (2012) found that coal combustion in China emits a large quantity of carbonaceous aerosols, contributing approximately 70 % of the total emitted PM2.5
(Zhang et al., 2012). As in Sun et al. (2013b) and Hu et al. (2013), CCOA was identified in this campaign. Overall, the MS for CCOA observed in this study is similar to those observed in their studies. Additionally CCOA’s MS in our study is also close to the BBOA MS in other studies, with a prominent contribution ofm/z60, which is a good tracer ion for biomass burning-emitted aerosols (Alfarra et al., 2007; Aiken et al., 2009). However, the contribution ofm/z73 ob-served in our study is less than that in the MS of BBOA. Wang et al. (2013) found that the similarity between organic signals from coal combustion and biomass burning measured by both AMS and ATOFMS may render some “biomass burning aerosol tracers” unreliable. Considering the energy structure in Beijing and the prevalence of coal combustion in winter, we thought it more reasonable to identify this OA
component as CCOA. The mass spectrum of CCOA is dom-inated by alkyl fragments (CnH+2n+1 and CnH
+
2n−1), which
is typical of primary organic aerosols derived from fossil fuel combustion. The H / C and O / C ratios for CCOA were 1.61 and 0.28, respectively, both of which are higher than the ratios for HOA (1.55 and 0.11). As the results measured in the winter in Beijing 2012, the CCOA showed a similar trend to the time series for chloride (R2=0.70) (Fig. 4). Al-though chloride has been used as a tracer for BBOA, Zhang et al. (2012) found that the contribution of chloride from coal combustion (0.64 %) was even higher than that from wood burning (0.45 %) (Zhang et al., 2012).
The average CCOA fraction of the total OA was approx-imately 15 % (Fig. 4). This value is higher than the results measured by Hu et al. (2013) (9 %). This is because they excluded some OA data corresponding to the periods most strongly influenced by coal combustion, so the contribution of coal combustion to organic aerosol concentrations should be larger than the value they reported. Sun et al. (2013b) found that CCOA was the most important primary source during wintertime, on average accounting for 33 % of OA and 17 % of NR-PM1, which is almost equivalent to the sum
of HOA and COA. CCOA accounts for a considerable frac-tion of OA and NR-PM1 throughout the day, ranging from
26–37 % and 12–22 %, respectively, indicating that coal has a sustained impact on PM pollution throughout the day (Sun et al., 2013b).
The COA MS extracted in this study had a low O / C ra-tio (0.11) and a unique diurnal pattern. The MS of the COA was characterized by CxH+y, especially CnH+2n−1, including
m/z 41 and m/z 55; the contributions of these two m/z were 9.1 % and 8.9 %, respectively (Fig. 3). This result in-dicates a significant presence of unsaturated organic com-pounds (e.g., unsaturated fatty acids) and is consistent with the MS characteristics measured for primary Chinese cook-ing emissions (He et al., 2010). In addition, COA showed significant correlations with a few CxHyO+1 ions, including
C6H10O+(Fig. 4), which are prominent peaks in the sources
spectra of cooking emissions; these ions could be used as spectral markers for COA (Sun et al., 2011b). Due to the uniqueness of Chinese cooking habits and culture, cooking emissions have been regarded as one of the major organic aerosol sources that in urban Chinese environments, and the cooking contribution to OA (20 %) is slightly higher than in some foreign cities such as in Barcelona (17.0 %) and New York City (16.0 %) (Sun et al., 2011b; Mohr et al., 2012). The contribution of COA reported in this study is close to that reported at a similar site in Beijing during the winter of 2012 (19 %) (Sun et al., 2013b).
HOA has been extensively identified in previous factor analyses of AMS ambient aerosol data sets (Huang et al., 2010; He et al., 2011; Mohr et al., 2012). This component can be distinguished by the ion series CnH+2n+1and CnH+2n−1
(1.55) detected during this campaign are consistent with the previous results observed for Beijing (Huang et al., 2010) and Shanghai (Huang et al., 2012). In addition, HOA corre-lates well with combustion tracers such as NOx(R2=0.61).
This finding indicates that the HOA is likely a surrogate for combustion POA, as concluded in other studies (Aiken et al., 2009; Ulbrich et al., 2009). In other studies in Beijing, HOA always was the lowest OA component, and it accounted for 11 % of the OA in our study. However, we should not ignore those POA components with lower contributions compared to SOA, because they are the important OA components dur-ing unpolluted days (Sect. 3.5).
3.4 Back trajectory clustering analysis
The hybrid single-particle Lagrangian integrated trajectory (HYSPLIT) model is a useful air trajectory model, especially for studying the long-range transport of air masses. It has been used in many cities, including Beijing (Huang et al., 2010; Sun et al., 2010), Shenzhen (He et al., 2011) and New York City (Sun et al., 2011b), to explore the influence of regional transport on PM1loading and composition at
sam-pling sites.
The analysis steps in this study are as follows: first, 48 h back trajectories starting at 200 m above ground level in Bei-jing (39.97◦, 116.37◦) were calculated every 6 h (at 0, 6, 12 and 18:00 local time (LT)) throughout the campaign. The tra-jectories were then clustered according to their similarity in a spatial distribution using the software HYSPLIT4. As a re-sult, a five-cluster solution was adopted because of its small total spatial variance (Fig. 5). Clusters 1–5 represent an in-crease in pollution from 26.1 µg m−3 during the relatively
clean cluster 1 to 123 µg m−3during the most polluted time
period during cluster 5. This is because the air masses in each cluster passed over different areas. Cluster 1 originated in the clean area in the north of Beijing and could thus carry clean air from this area. Although the directions of clusters 2 and 3 were similar, their NR-PM1mass concentrations were
signif-icantly different because their heights were different. Cluster 2 always maintained a higher altitude than did the others be-fore arriving in Beijing and thus did not carry much pollution from the areas it passed over. Cluster 3 was always lower than cluster 2, so it could carry larger amounts of pollutants from the same areas they both passed over. Cluster 4 passed over the Shanxi and Hebei provinces, the largest coal-producing and coal-consuming provinces in China, respectively. More-over, air masses in this cluster passed over some heavily pol-luting industrial areas outside of Beijing before arriving at the sampling site (Fig. S-7). These areas contained facto-ries that were moved out of Beijing in 2008 for the 29th Summer Olympic Games. The situation for cluster 5 was similar to that of cluster 4, but not identical. Cluster 5 also passed over the Shanxi and Hebei provinces, and some im-portant cities within these two provinces were located along the trajectory of this cluster, including Taiyuan and
Shiji-Fig. 5.Back trajectories for each of the identified clusters and cor-responding cluster average NR-PM1compositions during the cam-paign.
azhuang, the capital and the main coal consumption cities of these provinces. Therefore, cluster 5 had a mass concentra-tion of CCOA higher than that of cluster 4 (10.1 µg m−3and 7.7 µg m−3, respectively) and contained more pollutants that
are typically emitted from cities, such as nitrates. The main precursors of nitrates is NOx, which is mainly emitted from
the transportation in cities. Moreover, the air mass in cluster 5 was highly stagnant compared to the air mass in the other clusters, and the height of the air mass in this cluster was almost always lower than 500 m. The air mass in this clus-ter could thus carry large amounts of pollutants from heavy pollution areas, and these pollutants were not diluted during transport.
The composition of every species was different in the five clusters. Compared with the other cluster, cluster 1 had the greatest contribution from local, primary aerosol emissions such as CCOA, COA and HOA. In particular, the contribu-tion of COA reached 20 % in cluster 1. Along the series (clus-ter 1→cluster 2→cluster 3→cluster 4→cluster 5), the contribution of local, primary aerosol emissions decreased, while the contributions of some secondary, regional aerosol constituents gradually increased. For example, the contribu-tions of sulfate and nitrate were only 14 % and 9 % in cluster 1, respectively, while they reached 24 % and 17 %, respec-tively, in cluster 5. Therefore, the contributions of secondary species increased with that of NR-PM1 across the clusters.
The concentration of NR-PM1in cluster 1 was significantly
the light level may also be significant, and this effect should be studied in future research. Compared with other clusters, clusters 1 and 2 contained larger amounts of primary pol-lutants, and these pollutants were not oxidized due to their short transit time to the sampling site, especially that for clus-ter 1. Therefore, the contribution of primary species in these clusters were much higher than in the other clusters. Because the other three clusters originated in high-pollution areas and passed over industrial or/and urban areas, they all carried the pollutants emitted in these areas. In these three clusters, the pollutants had enough time in transit to transform into sec-ondary pollutants, and the POA in these clusters was oxi-dized in transit.
3.5 Comparison of different periods
According to the latest ambient air quality standards that were released in 2012 by the Ministry of Envi-ronmental Protection (MEP) of the People’s Republic of China (http://kjs.mep.gov.cn/hjbhbz/bzwb/dqhjbh/dqhjzlbz/ 201203/t20120302224165.htm), the first and second grades of the PM2.5daily average mass concentration are 35 µg m−3
and 75 µg m−3, respectively. The corresponding NR-PM1
concentrations are 25.9 µg m−3and 55.5 µg m−3(the conver-sion factor between PM2.5and NR-PM1is 0.74, Sun et al.,
2013b). The pollution in the month of the campaign was thus divided into three types, by day: days when the daily average mass concentration was lower than 25.9 µg m−3, days when it was between 25.9 µg m−3and 55.5 µg m−3, and days when it was higher than 55.5 µg m−3. To analyze the difference
be-tween unpolluted and polluted days, days with an NR-PM1
lower than 25.9 µg m−3 and higher than 55.5 µg m−3 were
compared in this section.
3.5.1 Submicron aerosol composition
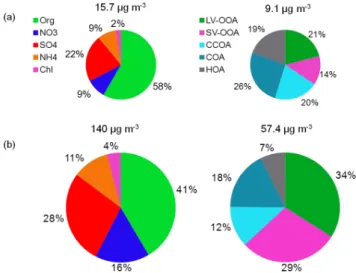
Figure 6 presents the average chemical composition of NR-PM1and OA on unpolluted (NR-PM1less than 25.9 µg m−3)
and polluted days (NR-PM1 higher than 55.5 µg m−3). The
average NR-PM1concentration was only 15.7 µg m−3on
un-polluted days, while it was approximately 9 times that on polluted days. The organic fraction was the dominant con-tributor to NR-PM1 in both two types of days, but its
con-tribution was significantly higher on unpolluted days (58 %) than on polluted days (41 %). The contributions of all inor-ganic species, especially the sulfate and nitrate, increased on polluted days. This increase in inorganic species can be ex-plained by the effect of aqueous-phase processing and gas-to-particle partitioning; aqueous-phase processing in particular often occurred during the polluted days due to higher humid-ity. Under very high RH conditions, water-rich particles and fog droplets are able to capture more soluble gases such as ammonia, nitric acid, NOxand SO2, leading to the more
effi-cient production of ammonium nitrate and sulfate (Ge et al., 2012b). Sun et al. (2013a) also found that at elevated RH
lev-Fig. 6.Average chemical composition of NR-PM1and OA for the
(a)unpolluted days and(b)polluted days.
els, aqueous-phase processing plays a more significant role and particularly affects sulfate. They estimated that the fog processing of SO2 was responsible for approximately 70 %
of sulfate production during wintertime in Beijing (Sun et al., 2013a).
Similar to NR-PM1species, the OA components differed
significantly between the types of days. The OA concen-tration was 6 times greater on polluted days than on un-polluted days. The OA composition also differed signifi-cantly. POA (CCOA + COA +HOA) dominated the OA composition during the unpolluted days, making up approx-imately 65 % of the OA, close to the result observed dur-ing clean periods in winter in Beijdur-ing in 2012 (60 %) (Sun et al., 2013b). COA was the most important contributor to OA (26 %) on unpolluted days, and other two POA types had similar contributions (19 % and 20 %, Fig. 6). On polluted days, the POA fraction was only 37 %, and SOA made up 63 % of the OA. The significant increase in SOA can be ex-plained by aqueous-phase processing. Ge et al. (2012b) sum-marized the mechanism of this phenomenon: the dissolution of water-soluble volatile organic compounds (VOCs) may be enhanced in fog drops and deliquesced particles and the aqueous-phase reactions of these compounds may generate low-volatility species that remain in the particle phases after water evaporates. In addition, aqueous-phase SOA produc-tion was observed based on single particle mass spectrometry in a fog event in London (Dall’Osto et al., 2009).
3.5.2 Diurnal variations in meteorological factors and NR-PM1species
added to the comparison as a reference (Fig. 7a). During the unpolluted days, temperature and humidity were lower than on polluted days; the average temperature on unpolluted and polluted days was−4.3◦C and−2.2◦C, respectively, and the average humidity was 25.5 % and 61.6 %, respectively. In particular, the higher humidity on polluted days caused the moisture content in the particles to increase, which subse-quently enhanced the absorption capacity of the particles for semi-volatile and volatile organic matter and ultimately led to elevated OA mass concentrations (Ge et al., 2012b). This is demonstrated in Fig. 1, which shows that the humidity re-mained at approximately 80 % during several serious pollu-tion events, such as from 22 January to 23 and from 25 Jan-uary to 28. The contribution of inorganic species increased rapidly during these periods. The wind speed and air pressure were lower on the polluted days (Fig. 7a). Our results show a consistent set of meteorological conditions on the polluted days: the wind speed was relatively low (1.1 m s−1), the
tem-perature increased and the air pressure remained low. In this case, a strong temperature inversion at low altitudes was of-ten accompanied by a highly stable atmospheric layer. This process made the ground convergence stronger, thus prevent-ing the diffusion of pollutants and causprevent-ing the atmospheric pollutants in the region surrounding to Beijing to converge towards the centre. This aggravated the degree of air pollu-tion in the city (Liu et al., 2012). In addipollu-tion, the wind di-rections also differed between the types of days. Here, we mainly considered the wind direction after 09:00 because the the wind speed was lower before 09:00. The wind direction on polluted days was from the south, allowing for the trans-port of large amounts of pollutants from the area south of Beijing. However, the wind direction on unpolluted days was unstable, including northwest and north winds that passed over some clean areas, and were likely conducive to the dilu-tion and removal of the pollutants in Beijing. This is consis-tent with the results of back trajectory clustering analysis.
Figure 7b shows the diurnal profiles of NR-PM1 species
and OA components on the two types of days and the entire period. In this study, the overall trends for organics on un-polluted days and un-polluted days were similar, with peaks at noon (12:00–14:00) and in the evening (18:00–24:00). For both, the second peak was much larger than the noon peak, and its duration was longer. The noon period and the pe-riod from 18:00–20:00 correspond to the peak dining peri-ods. Additionally, the height of the mixing layer is lower in the evening, a condition that is conducive to the accumula-tion of pollutants in the atmosphere. The combined effect of cooking emissions and a lower mixing layer resulted in the higher organic concentration and longer duration observed in the evening. This trend is consistent with other studies in Bei-jing (Sun et al., 2010; Huang et al., 2010) but differs from the trend observed in foreign urban locations, for example, Pitts-burgh (Zhang et al., 2005a) and New York City (Drewnick et al., 2004), where a morning peak of organics that corre-sponds to morning traffic is typically observed.
The diurnal profiles of the concentrations of major sec-ondary inorganic species (sulfate, nitrate, and ammonium) on unpolluted days were almost flat compared to those ob-served over the entire period and polluted days (Fig. 7b). For example, the daily concentration increment of sulfate on unpolluted days was only approximately 1.9 µg m−3, while the average increment over the entire period reached approx-imately 10 µg m−3. The lowest concentrations of sulfate, ni-trate, and ammonium over the entire period occurred from 07:00–08:00, and the corresponding concentrations were 15.4 µg m−3, 8.2 µg m−3, and 6.2 µg m−3, respectively. The concentrations of all three then increased gradually, reaching their peak values between 19:00 and 20:00, when the con-centrations were 23.6 µg m−3, 17.3 µg m−3, and 11.5 µg m−3, respectively. This result differs significantly from the re-sults obtained in summer in Beijing. For example, Huang et al. (2010) found that the concentration of sulfate and am-monium were relatively stable over a 24 h period in sum-mer, except for a slight, continuous increase in the afternoon. They also observed the lowest concentrations of nitrate in the afternoon. This seasonal difference is likely caused by the combined effect of gas-to-particle partitioning and aqueous-phase processing, which is facilitated by the relatively lower temperature and higher RH at night and the frequent occur-rence of nighttime fogs in winter in Beijing. A lower mixed layer depth and calm wind at night may have also contributed to the accumulation of these species (Ge et al., 2012b).
The observed diurnal profile of chloride had a large ampli-tude over the entire period; its concentration peaked around midnight and remained low during the daytime, unlike the other three inorganic species. The different diurnal cycles of chloride and nitrate observed in this study indicate that they have different sources and formation mechanisms. Di-rect emissions from coal combustion are a major source of chloride in winter, and therefore, the diurnal cycles of chlo-ride and coal combustion OA are very similar (discussed later), further supporting this conclusion.
Fig. 7.Diurnal profiles of(a)meteorological factors;(b)NR-PM1 species and OA components; and(c)O / C, H / C, N / C and OM / OC ratios for the polluted days, entire period, and unpolluted days.
the entire period, with the highest concentration appearing at 0:00 and the lowest appearing at 15:00. Overall, the concen-tration of HOA was higher at night than during the day. A similar result was found in 2012 for winter in Beijing (Sun et al., 2013b). This result suggests that the HOA concentration is driven by traffic emissions from heavy-duty diesel trucks (HDDT) and other heavy-duty vehicles (HDV) that are not allowed inside the city between 06:00 and 22:00.
Figure 7c shows the diurnal variations in the O / C, H / C, N / C and OM / OC ratios in different periods. The trends of the four ratios on the two types of days and over the entire period were similar. However, the difference in all of these ratios except the N / C ratio across the three periods was sig-nificant in the daytime. These ratios reflect the oxidation of the aerosol, which is mainly affected by daytime photochem-ical processes. The degree of oxidation of aerosol on pol-luted days was obviously higher than on unpolpol-luted days be-cause (1) the temperature on polluted days was higher and thus conducive to the oxidation of aerosols; (2) the weather conditions on these days were not conducive to the spread of pollutants and would keep them in the atmosphere longer, providing more time for the oxidation of aerosols; and (3) fog processing in the polluted days is conducive the oxi-dation of OA. This conclusion was also reached by Ge et al. (2012b), who observed that SOA produced in the aqueous phase was generally more oxygenated than SOA formed in
the gas phase, thereby producing a decrease in the average H / C ratio.
Figure 8 shows statistical results concerning the contribu-tion of each cluster on polluted and unpolluted days. Clean cluster 1 was the most important cluster during the unpol-luted days, accounting for 71 % of the total back trajectory (BT), followed by clusters 2 (19 %) and 3 (10 %). There was no contribution from clusters 4 and 5, which had higher NR-PM1mass concentrations, on unpolluted days. The opposite
phenomenon was observed during the polluted days. The contribution of cluster 1 was only 2 %, while clusters 3, 4, and 5 contributed 30 %, 28 % and 27 % to the total all BT, respectively.
3.5.3 Particle acidity
Understanding acidity in atmospheric particles is important because acidity is a key parameter that affects aerosol hygro-scopic growth, toxicity, and heterogeneous reactions (Sun et al., 2010). We evaluated the acidity of submicron aerosols using NH+4 meas / NH+4 pred, i.e., the ratio of the measured NH+4 concentration to the predicted NH+4 required to fully neutralize the measured SO24− , NO−3 , and Cl− (Zhang et
Fig. 8.The contribution of every cluster on polluted days and un-polluted days.
be “bulk neutralized” if the two values are similar (Zhang et al., 2005a).
The correlations between the measured and predicted NH+4 on polluted days, over the entire period, and on un-polluted days were very strong (R2=0.99, 0.99 and 0.99, respectively), with regression slopes of approximately 0.66, 0.68 and 0.74, respectively (Fig. 9), indicating that NR-PM1
in Beijing was acidic for both types of days and over the en-tire period. However, the acidity of NR-PM1on polluted days
was greater than that on unpolluted days. This difference was mainly caused by the uptake of SO2 and further
aqueous-phase oxidation on polluted days, both of which can increase aerosol particle acidity (Sun et al., 2013a). Sun et al. (2006) also found that the aerosol particles were acidic and could not be fully neutralized during an intense haze-fog episode in the winter of 2004 in Beijing. Similarly, approximately 60 % of the cloud water samples collected at Mountain Tai in the North China Plain had pH values between 3 and 5, which were largely due to rapid oxidation of high concentration of SO2in clouds (Shen et al., 2012).
The acidity over the entire period was much greater than it was in 2012 at a similar site because the contribution of sulfate in 2013 was much higher than that in 2012; the sul-fate contribution was 22 % in 2013 and 14 % in 2012 (Sun et la., 2013b). However, the contribution of ammonium in 2012 (13 %) was higher than it was in our study (10 %). This dif-ference in composition likely caused the change in aerosol acidity between these two years. Sun et al. (2010) found the regression slope between the measured and predicted NH+4 to be approximately 1.01 in summer in Beijing in 2006, im-plying that aerosol was bulk neutralized. This result could be different from ours because of the massive emission of SO2
from coal combustion in our study, whereas this source of SO2is greatly reduced in summer.
Fig. 9. Scatter plot that compares predicted NH+4 vs. measured NH+4 for(a)polluted days;(b)entire periods; and(c)unpolluted days.
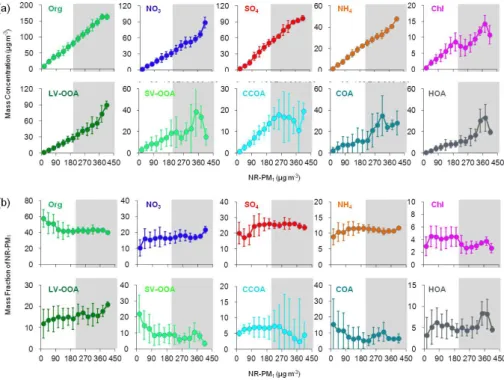
3.6 Chemically resolved PM pollution
Figure 10 shows the variations in the mass concentrations and mass fractions of NR-PM1species and OA components
as a function of NR-PM1mass. A similar analysis for data
obtained in winter in Beijing in 2012 was represented by Sun et al. (2013b), and the highest NR-PM1mass
concentra-tion reported in their study was approximately 210 µg m−3. Therefore, we divided the NR-PM1mass concentration into
two ranges: lower than 210 µg m−3 (the non-grey back-ground area in Fig. 10) and higher than 210 µg m−3(the grey background area in Fig. 10). We chose this division for two reasons: (1) to compare our data with the results from 2012 because the 2012 site was very close to ours and both stud-ies were conducted in winter and (2) to analyze the variation trends when the NR-PM1 level is higher than 210 µg m−3.
These two NR-PM1 mass ranges are referred to as “lower
NR-PM1 mass level” and “higher NR-PM1 mass level” to
facilitate comparison. The variation trends were more dra-matic at the higher NR-PM1mass level, which have not been
observed in 2012. Therefore, this division is not only bene-ficial for comparing the results from the two years but also conducive to the analysis of new trends.
Figure 10a shows that all aerosol species except COA and HOA showed a monotonic and almost linear increase with the increase of PM loading in the lower NR-PM1mass level,
consistent with the results observed in winter in Beijing 2012 (Sun et al., 2013b). The variation trends of several species were significant different at the higher NR-PM1mass level.
At the higher NR-PM1mass level, the variation trends of the
organics, LV-OOA and three inorganic species (sulfate, ni-trate and ammonium) were similar to those of the lower NR-PM1level. However, chloride and the other four OA
com-ponents (SV-OOA, CCOA, COA and HOA) showed a dra-matic difference with increased NR-PM1loading. This
find-ing indicates that the total organics and three important in-organic species (sulfate, nitrate and ammonium) will always increase with increased PM loading. The other components will monotonically and almost linearly increase with PM loading in the lower NR-PM1loading range, but their
vari-ation trends will be different in the higher NR-PM1loading
range.
Fig. 10.Variation of(a)mass concentration and(b)mass fractions of NR-PM1species and OA components as a function of NR-PM1mass loadings. The data were binned according to the total NR-PM1mass, and the vertical lines are the standard deviation.
loading, the contribution of organic and inorganic species to the total NR-PM1 mass did not show a significant
NR-PM1 mass loading dependency. This finding indicates that
the higher NR-PM1pollution in winter is a result of the
syn-ergistic effect of all pollutants, consistent with results ob-tained in 2012 (Sun et al., 2013b). Organics had the highest contribution (40–60 %) to NR-PM1 pollution across
differ-ent mass loadings levels, and the inorganic species, sulfate, nitrate, and ammonium, contributed 15–25 %, 10–20 %, and 8–12 % to the total NR-PM1mass, respectively. This is quite
different from results observed in summer, particularly for nitrate (Sun et al., 2012). In summer, the nitrate contribution increased significantly with NR-PM1 loading, highlighting
the important role of nitrate in NR-PM1 pollution. In
win-ter, however, nitrate displayed an approximately stable con-tribution as the NR-PM1 mass loading increased. This
dif-ference may be due to the different photochemical produc-tion rate, RH and temperature influences on gas-particle par-titioning (Ranjan et al., 2012), as well as on NH3 ambient
levels (Meng et al., 2011). The sulfate contribution is ele-vated but stable when NR-PM1is at the higher level,
indicat-ing that additional production of sulfate occurs durindicat-ing high PM episodes. The aqueous production of sulfate, for exam-ple, is an important source of sulfate in winter that may be increased in high-pollution periods (Ge et al., 2012b; Sun et al., 2013b).The contribution of chloride was found to be de-creased when the NR-PM1loading at the higher level,
con-sistent with the observed variation in chloride concentration with mass loading.
OA components vary widely with NR-PM1mass loading.
LV-OOA always maintained a stable, increasing trend with increased mass loading, and its contribution was significantly increased when the NR-PM1 was at the higher mass level.
The contribution of SV-OOA, however, decreased sharply when the NR-PM1loading was either lower than 120 µg m−3
or higher than 360 µg m−3. This finding suggests that the aerosol was increasingly aged with increased NR-PM1mass
loading. The contribution of CCOA was stable at the lower NR-PM1mass level, but it decreased at the higher NR-PM1
mass level, consistent with the observed trend of CCOA mass at the higher NR-PM1mass level. This variation is similar to
the trend observed for chloride, indicating that the contribu-tion of coal combuscontribu-tion was decreased when the NR-PM1
was at the higher mass level. The highest COA contribution occurred during the lowest NR-PM1 level, and it generally
decreased with increased NR-PM1loading, despite a small
increase at the higher NR-PM1mass level. The highest COA
contribution at the lowest NR-PM1 mass level was higher
4 Conclusions
Non-refractory submicron particles (NR-PM1) were
mea-sured in situ using a high-resolution time-of-flight aerosol mass spectrometer during a serious pollution month (January 2013) in an intensive field study in Beijing. On average, the contribution of organics to the total NR-PM1in winter was
higher than in summer; organics comprised 50 % of the total mass, followed by sulfate (22 %), nitrate (14 %), ammonium (10 %), and chloride (4 %). The average size distributions of all components were very similar and were characterized by a prominent accumulation mode peaking at 600 nm. The or-ganics and nitrate were also characterized by an additional smaller mode at approximately 200 nm. Calculations of the organic elemental composition indicated that, on average, C, H, O and N contributed 73.6 %, 7.2 %, 16.5 % and 2.8 % of the total atomic numbers of OA, respectively, corresponding to an OM / OC ratio of 1.60.
Positive matrix factorization (PMF) analyses of this high-resolution organic mass spectral data found that the two oxygenated organic aerosols (LV-OOA and SV-OOA) are the most important OA components, together accounting for 54 % of the total organic mass. Cooking-related OA (COA) is the most important primary OA component, with a contribu-tion of approximately 20 %. A coal combuscontribu-tion OA (CCOA) that was not observed in summer was identified in winter; this component is mainly derived from coal combustion. The other OA component was HOA, which is closely associated with primary combustion sources. Back trajectory clustering analysis indicated that the direction of air masses in winter was very different than that in summer. Air masses from the south were found to contain aerosols with a dominant frac-tion of secondary inorganic and organic species. However, air masses from the north were dominated by organic mate-rial, most of which was produced by primary CCOA, COA and HOA sources.
After an in-depth comparison, we found that some aerosol characteristics were different on polluted days compared to unpolluted days: (1) the diurnal variation of NR-PM1species
showed a different trend on polluted days, reaching higher values from afternoon to midnight; (2) the contribution of inorganic species and SOA components were all increased significantly on polluted days, most likely due to aqueous-phase processing and unfavorable meteorological factors; (3) the variation of every NR-PM1 species and all OA
com-ponents was more dramatic when the total NR-PM1 mass
concentration was at a higher level; and (4) aerosol acidity was greater and the air mass was transported mainly from high-pollution areas on polluted days. The serious pollu-tion in the study month can be attributed to the synergy of unfavorable meteorological factors, such as the lower wind speed, higher RH, and higher temperature, the transport of air masses from highly polluted areas, emissions from local sources, and other factors.
Supplementary material related to this article is available online at http://www.atmos-chem-phys.net/14/ 2887/2014/acp-14-2887-2014-supplement.pdf.
Acknowledgements. This study was supported by the “Strategic Priority Research Program” of the Chinese Academy of Sciences (XDA05100100 & XDB05020000) and the National Natural Science Foundation of China (no. 41230642, 41175107 and 41275139). We gratefully acknowledge this financial support.
Edited by: D. Covert
References
Aiken, A. C., DeCarlo, P. F., Kroll, J. H., Worsnop, D. R., Huff-man„ J. A., D., K. S., Ulbrich, I. M., Mohr, C., Kimmel„ J. R., S., D., Sun, Y., Zhang, Q., Trimborn, A., Northway„ M., Z., P. J., Canagaratna, M. R., Onasch, T. B., Alfarra„ M. R., P., A. S. H., Dommen, J., Duplissy, J., Metzger, A.„ and Baltensperger, U., and Jimenez, J. L.: O / C and OM / OC ratios of primary, secondary, and ambient organic aerosols with High-Resolution Time-of-Flight Aerosol Mass Spectrometry, Environ. Sci. Tech-nol., 42, 4478–4485, 2008.
Aiken, A. C., Salcedo, D., Cubison, M. J., Huffman, J. A., DeCarlo, P. F., Ulbrich, I. M., Docherty, K. S., Sueper, D., Kimmel, J. R., Worsnop, D. R., Trimborn, A., Northway, M., Stone, E. A., Schauer, J. J., Volkamer, R. M., Fortner, E., de Foy, B., Wang, J., Laskin, A., Shutthanandan, V., Zheng, J., Zhang, R., Gaffney, J., Marley, N. A., Paredes-Miranda, G., Arnott, W. P., Molina, L. T., Sosa, G., and Jimenez, J. L.: Mexico City aerosol analysis during MILAGRO using high resolution aerosol mass spectrom-etry at the urban supersite (T0) – Part 1: Fine particle composi-tion and organic source apporcomposi-tionment, Atmos. Chem. Phys., 9, 6633–6653, doi:10.5194/acp-9-6633-2009, 2009.
Alfarra, M. R., Prevot, A. S. H., Szidat, S., Sandradewi, J., Weimer, S., Lanz, V. A., Scheriber, D., Mohr, M., and Baltensperger, U.: Identification of the mass spectral signature of organic aerosols from wood burning emissions, Environ. Sci. Technol., 41, 5770– 5777, 2007.
Canagaratna, M. R., Jayne, J. T., Jimenez, J. L., Allan, J. D., Al-farra, M. R., Zhang, Q., Onasch, T. B., Drewnick, F., Coe, H., Middlebrook, A., Delia, A., Williams, L. R., Trimborn, A. M., Northway, M. J., DeCarlo, P. F., Kolb, C. E., Davidovits, P., and Worsnop, D. R.: Chemical and microphysical characterization of ambient aerosols with the aerodyne aerosol mass spectrome-ter, Mass Spectrom. Rev., 26, 185–222, doi:10.1002/mas.20115, 2007.
Dall’Osto, M., Harrison, R. M., Coe, H., and Williams, P.: Real-time secondary aerosol formation during a fog event in London, At-mos. Chem. Phys., 9, 2459–2469, doi:10.5194/acp-9-2459-2009, 2009.
DeCarlo, P. F., Ulbrich, I. M., Crounse, J., de Foy, B., Dunlea, E. J., Aiken, A. C., Knapp, D., Weinheimer, A. J., Campos, T., Wennberg, P. O., and Jimenez, J. L.: Investigation of the sources and processing of organic aerosol over the Central Mex-ican Plateau from aircraft measurements during MILAGRO, At-mos. Chem. Phys., 10, 5257–5280, doi:10.5194/acp-10-5257-2010, 2010.
Drewnick, F., Schwab, J. J., Jayne, J. T., Canagaratna, M., Worsnop, D. R., and Demerjian, K. L.: Measurement of Ambient Aerosol Composition During the PMTACS-NY 2001 Using an Aerosol Mass Spectrometer. Part I: Mass Concentrations Special Issue ofAerosol Science and Technologyon Findings from the Fine Particulate Matter Supersites Program, Aerosol Sci. Tech., 38, 92–103, 2004.
Drewnick, F., Hings, S. S., DeCarlo, P., Jayne, J. T., Gonin, M., Fuhrer, K., Weimer, S., Jimenez, J. L., Demerjian, K. L., Bor-rmann, S., and Worsnop, D. R.: A New Time-of-Flight Aerosol Mass Spectrometer (TOF-AMS) – Instrument Description and First Field Deployment, Aerosol Sci. Tech., 39, 637–658, 2005. Ge, X. L., Setyan, A., Sun, Y., and Zhang, Q.: Primary and
sec-ondary organic aerosols in Fresno, California during wintertime: results from high resolution aerosol mass spectrometry, J. Geo-phys. Res.-Atmos., 117, D19301, doi:10.1029/2012jd018026, 2012a.
Ge, X. L., Zhang, Q., Sun, Y. L., Ruehl, C. R., and Setyan, A.: Ef-fect of aqueous-phase processing on aerosol chemistry and size distributions in Fresno, California, during wintertime, Environ. Chem., 9, 221–235, doi:10.1071/EN11168, 2012b.
Hallquist, M., Wenger, J. C., Baltensperger, U., Rudich, Y., Simp-son, D., Claeys, M., Dommen, J., Donahue, N. M., George, C., Goldstein, A. H., Hamilton, J. F., Herrmann, H., Hoff-mann, T., Iinuma, Y., Jang, M., Jenkin, M. E., Jimenez, J. L., Kiendler-Scharr, A., Maenhaut, W., McFiggans, G., Mentel, Th. F., Monod, A., Prévôt, A. S. H., Seinfeld, J. H., Surratt, J. D., Szmigielski, R., and Wildt, J.: The formation, properties and im-pact of secondary organic aerosol: current and emerging issues, Atmos. Chem. Phys., 9, 5155–5236, doi:10.5194/acp-9-5155-2009, 2009.
He, L.-Y., Lin, Y., Huang, X.-F., Guo, S., Xue, L., Su, Q., Hu, M., Luan, S.-J., and Zhang, Y.-H.: Characterization of high-resolution aerosol mass spectra of primary organic aerosol emis-sions from Chinese cooking and biomass burning, Atmos. Chem. Phys., 10, 11535–11543, doi:10.5194/acp-10-11535-2010, 2010. He, L. Y., Huang, X. F., Xue, L., Hu, M., Lin, Y., Zheng, J., Zhang, R., and Zhang, Y. H.: Submicron aerosol analy-sis and organic source apportionment in an urban atmosphere in Pearl River Delta of China using high-resolution aerosol mass spectrometry, J. Geophys. Res.-Atmos., 116, D12304, doi:10.1029/2010jd014566, 2011.
Heald, C. L., Kroll, J. H., Jimenez, J. L., Docherty, K. S., DeCarlo, P. F., Aiken, A. C., Chen, Q., Martin, S. T., Farmer, D. K., and Artaxo, P.: A simplified description of the evolution of organic aerosol composition in the atmosphere, Geophys. Res. Lett., 37, L08803, doi:10.1029/2010gl042737, 2010.
Hildebrandt, L., Engelhart, G. J., Mohr, C., Kostenidou, E., Lanz, V. A., Bougiatioti, A., DeCarlo, P. F., Prevot, A. S. H., Bal-tensperger, U., Mihalopoulos, N., Donahue, N. M., and Pan-dis, S. N.: Aged organic aerosol in the Eastern Mediterranean: the Finokalia Aerosol Measurement Experiment – 2008, Atmos.
Chem. Phys., 10, 4167–4186, doi:10.5194/acp-10-4167-2010, 2010.
Hu, W. W., Hu, M., Yuan, B., Jimenez, J. L., Tang, Q., Peng, J. F., Hu, W., Shao, M., Wang, M., Zeng, L. M., Wu, Y. S., Gong, Z. H., Huang, X. F., and He, L. Y.: Insights on organic aerosol aging and the influence of coal combustion at a regional receptor site of central eastern China, Atmos. Chem. Phys., 13, 10095–10112, doi:10.5194/acp-13-10095-2013, 2013.
Huang, X.-F., He, L.-Y., Hu, M., Canagaratna, M. R., Sun, Y., Zhang, Q., Zhu, T., Xue, L., Zeng, L.-W., Liu, X.-G., Zhang, Y.-H., Jayne, J. T., Ng, N. L., and Worsnop, D. R.: Highly time-resolved chemical characterization of atmospheric submi-cron particles during 2008 Beijing Olympic Games using an Aerodyne High-Resolution Aerosol Mass Spectrometer, Atmos. Chem. Phys., 10, 8933–8945, doi:10.5194/acp-10-8933-2010, 2010.
Huang, X.-F., He, L.-Y., Hu, M., Canagaratna, M. R., Kroll, J. H., Ng, N. L., Zhang, Y.-H., Lin, Y., Xue, L., Sun, T.-L., Liu, X.-G., Shao, M., Jayne, J. T., and Worsnop, D. R.: Characterization of submicron aerosols at a rural site in Pearl River Delta of China using an Aerodyne High-Resolution Aerosol Mass Spectrometer, Atmos. Chem. Phys., 11, 1865–1877, doi:10.5194/acp-11-1865-2011, 2011.
Huang, X.-F., He, L.-Y., Xue, L., Sun, T.-L., Zeng, L.-W., Gong, Z.-H., Hu, M., and Zhu, T.: Highly time-resolved chemi-cal characterization of atmospheric fine particles during 2010 Shanghai World Expo, Atmos. Chem. Phys., 12, 4897–4907, doi:10.5194/acp-12-4897-2012, 2012.
Jayne, J. T., Leard, D. C., Zhang, X., Davidovits, P., Smith, K. A., Kolb, C. E., and Worsnop, D. R.: Development of an Aerosol Mass Spectrometer for Size and Composition Analysis of Sub-micron Particles, Aerosol. Sci. Tech., 33, 49–70, 2000.
Jimenez, J. L., Jayne, J. T., Shi, Q., Kolb, C. E., Worsnop, D. R., Yourshaw, I., Seinfeld, J. H., Flagan, R. C., Zhang, X. F., Smith, K. A., Morris, J. W., and Davidovits, P: Ambient aerosol sam-pling using the Aerodyne Aerosol Mass Spectrometer, J. Geo-phys. Res.-Atmos., 108, 8425, doi:10.1029/2001jd001213, 2003. Jimenez, J. L., Canagaratna, M. R., Donahue, N. M., Prevot, A. S., Zhang, Q., Kroll, J. H., DeCarlo, P. F., Allan, J. D., Coe, H., Ng, N. L., Aiken, A. C., Docherty, K. S., Ulbrich, I. M., Grieshop, A. P., Robinson, A. L., Duplissy, J., Smith, J. D., Wilson, K. R., Lanz, V. A., Hueglin, C., Sun, Y. L., Tian, J., Laaksonen, A., Raatikainen, T., Rautiainen, J., Vaattovaara, P., Ehn, M., Kul-mala, M., Tomlinson, J. M., Collins, D. R., Cubison, M. J., Dun-lea, E. J., Huffman, J. A., Onasch, T. B., Alfarra, M. R., Williams, P. I., Bower, K., Kondo, Y., Schneider, J., Drewnick, F., Bor-rmann, S., Weimer, S., Demerjian, K., Salcedo, D., Cottrell, L., Griffin, R., Takami, A., Miyoshi, T., Hatakeyama, S., Shimono, A., Sun, J. Y., Zhang, Y. M., Dzepina, K., Kimmel, J. R., Sueper, D., Jayne, J. T., Herndon, S. C., Trimborn, A. M., Williams, L. R., Wood, E. C., Middlebrook, A. M., Kolb, C. E., Baltensperger, U., and Worsnop, D. R.: Evolution of organic aerosols in the atmo-sphere, Science, 326, 1525–1529, doi:10.1126/science.1180353, 2009.