Simulation of microstructural evolution
in directional solidiication of Ti-45at.%Al
alloy using cellular automaton method
Male, born in 1965, associate professor, Ph.D. He obtained his doctor's degree from Harbin Institute of Technology, and his research interest focuses on the application of computer technology in casting.
E-Mail: [email protected]
Received: 2009-03-13; Accepted: 2009-08-12 *Wang Kuangfei
*Wang Kuangfei 1, Lu Shan2, Mi Guofa 1, Li Changyun1and FU Hengzhi1,2
(1. School of Materials Science and Engineering, Henan Polytechnic University, Jiaozuo, 454100, China; 2. School of Electromechanical
Engineering, Jiaozuo University, Jiaozuo 454100, China)
Abstract: The microstructural evolution of Ti-45 at.%Al alloy during directional solidiication was simulated by applying a solute diffusion controlled solidiication model. The obtained results have shown that under high thermal
gradients the stable primary spacing can be adjusted via branching or competitive growth. For dendritic structures formed under a high thermal gradient, the secondary dendrite arms are developed not very well in many cases due to the branching mechanism under a constrained dendritic growth condition. Furthermore, it has been observed that, with increasing pulling velocity, there exists a cell/dendrite transition region consisting of cells and dendrites, which varies with the thermal gradient in a contradicting way, i.e. increase of the thermal gradient leading to the decrease of the range of the transition region. The simulations agree reasonably well with experiment results.
Key words: Ti-Al based alloy; directional solidiication; solute diffusion controlled mode; cellular automaton
CLC number: TG146.2+3/TP391.9 Document code: A Article ID: 1672-6421(2010)01-047-05
D
uring directional solidiication of alloys, the cell/dendrite transition is one of the most fundamental and importantsolidification phenomena [1,2], because their columnar grain
spacing is an important structural parameter reflecting the solidiication process. According to Mullins–Sekerka theory of morphological instability [3], the growth of regular cells occurs
in low growth rate (V) conditions. As the temperature gradient
(GL) is reduced and the growth rate is increased, cells begin to
branch, leading to dendrites. Theoretically, the critical velocity of these transitions can be determined, however due to the complexity and gradual evolution process, such as the high nonlinearity, detailed cell/dendrite evolution mechanism has yet to be well understood and further research is necessary.
Two signiicantly controllable variables, the temperature gradient (GL) and pulling velocity (Vp), are independently controlled
and held constant with time during directional solidification experiments. The evolution of simulated microstructures can be directly visualized and compared with actual microstructures from experiments. The present simulation was mainly to investigate the microstructural evolution of Ti-45at.%Al alloy during directional solidification with initial concentration chosen in range of the L→L+b(Ti) liquid–solid transition [1] in the phase
diagram. The calculated results were presented and discussed.
1 Model description
The model is based on the following assumptions: (1) The alloys are molten, quiescent and uniformly mixed, and have no melt convection; (2) The melt is only cooled at the bottom, and the top and side walls are insulated; (3) No diffusion occurs in the solid phase, and concentration distribution reaches local equilibrium at the solid/liquid interface; (4) No nucleation occurs in the bulk liquid, and only the growth of the seeds placed at the base of the directionally solidiied ingot will be considered.
1.1 The model of grain growth
The structure of the stochastic model is similar to that described in ref. [4]. It consists of a regular network of cells that resembles the geometry of interest. The model is characterized by: (a) geometry of the cell; (b) state of the cell; (c) neighborhood coniguration and (d) several transition rules that determine the state of the cell. In this work, the geometry of the cell is a square. Each cell has three possible states: liquid (fs= 0) , interface (0< fs<1), or solid (fs= 1).
It is assumed that a nucleus formed at a particular location will grow based on the growth velocity of the S/L interface
obtained from Equ. (2) and the neighborhood coniguration rule previously described [5]. As a "liquid" cell nucleated and became
an active "interface" cell (0< fs<1), it would grow until fully solidiied (fs = 1). Thereafter, the "interface" cell would capture the neighboring cells if a randomly generated number, rand, is smaller than the capture probability, pc, deined as follows
[5]:
(1)tan 1
1 2 +
= θ
Where q is the growth angle and takes values from -p/4 to p/4. The growth velocity of the S/L interface is calculated
according to solute conservation at the S/L interface: (2)
Where Vn is the normal velocity of the interface, cL the solute concentration in liquid of the interface, cS the solute concentration in solid of the interface, DL the liquid solute
diffusion coeficient, n the interface normal vector, and c the
solute concentration in liquid (cL) or solid (cS) phase.
The interface liquid concentration cL is deined as
[6]:
Where TL is the equilibrium liquidus temperature of the
alloy, mL the liquidus slope in the phase diagram, κ the mean
curvature of the S/L interface, Γthe Gibbs–Thomson coeficient, f( , q) is a coeficient used to account for growth anisotropy, and the preferential crystallographic orientation angle. and f( , q) are described in Ref. [5], T(t) is the local temperature, and c0 is the initial concentration of the liquid.
Knowing the velocity components in both x- and y-directions, the solid fraction increment is calculated with:
Wherea is the mesh size (uniform and constant for both x- and y- direction), Where Vx and Vy are the interface velocities
in the x- and y-directions, and
δ
t is the time step. Then, the solid fraction can be expressed as:Where superscripts "p+1" and "p" denote the new and the
old solid fraction values, respectively.
1.2 The concentration ields in the liquid
Assuming the equilibrium partition coeficient, it is obtained that the partitioning of solute in the growing cell is determined by:
Where
k
0 is a constant partition coefficient. The diffusion equations in liquid and solid can be expressed in a similar form:
The time step used in calculations is given by [6]:
Where a is the mesh size (uniform and constant for both x- and y-directions), Vmaxthe maximum growth velocity obtained by
scanning the growth velocities ( ) of all "interface" cells during
each time step, and DS the solute diffusion coeficient in solid.
2 Results and discussion
In the present simulation of directional solidification, it
κ
gradient (GL), and that the local temperature T(t) is given by
(10) Where Vp is the pulling velocity, T* is the reference
temperature, and t the local solidification time, and x is the
distance from the bottom of the directionally solidiied domain. In the following simulations, it is also assumed that no nucleation occurs in the bulk liquid; only the growth of the seeds placed at the bottom of the directionally solidified domain is considered. Therefore, the final microstructure develops only by branching and overgrowth mechanisms from these initial seeds. The undercooling available for the nucleation of the seeds was taken to be 1 K throughout this work. Several simulations were run for directional solidification from fixed numbers of seeds of 4 and the preferred growth direction of all the seeds <10> were perfectly aligned with the grid. Computational domain of 160×300 mesh was chosen with a cell edge length of 5 mm. A zero lux boundary condition was applied to the left and the right side of the domain, while keeping the liquid concentration at top of the domain constant, c0. The material properties and the model
parameters used in these simulations are given in Table 1.
Table 1: Material properties and model parameters used in the simulation [7, 8]
Properties Variable Value
Liquidus temperature TL 1,830 K
Liquidus slope mL -8.9 K/at.%
Partition coeficent ko 0.63
Solute diffusion coeficient in liquid DL 3.0×10
-9 m2
/s Solute diffusion coeficient in solid DS 3.0×10
-12 m2
/s
Gibbs-Thomson coeficient 1.5×10⁻⁷ K•m
Initial concentration co 45at.%
A typical simulated columnar grain evolution for Ti-45at.%Al alloy is shown in Fig.1. The gray zones represent different solute constitutions in the solid and liquid zones. It is demonstrated that the dendritic stems directly grow from four seeds with a spacing of 200 μm, accompanied with some parallel secondary dendritic arms at both sides of the stems (Fig.1(a)). Further solidification led to the development of secondary dendrites perpendicular to the heat transfer direction and the formation of some tertiary dendrites emanating from the secondary dendrites and following along the direction of the primary dendrites. Apparently, they were all blocked by other secondary dendrites, as shown in Figs.1(b) and (c).
In addition to the branching of the dendrite arms, the simulation has also revealed phenomena that occurred during the columnar dendritic growth, such as selection and competition. It can be seen in Fig. 1(c) that branching competition must have occurred during the dendrite growth. When the primary dendrite spacing is larger, the secondary dendrites are well developed, which is similar to that reported in ref. [7] on Ti-44 at% Al alloy. This result suggests that the current model can not only simulate the dynamic growth of the columnar dendrites, but also maybe (3) ) ( a t V V V V a t
fs
δ
x y x yδ
δ
= + − (4)s p s p
s
f
f
f
+1=
+
δ
(5)(6)
(9)
) ( )
(t T G x V t
T = + L − p
∗ n c D V c
cL L
• ∇ = •
− ) n
( S )] ( ) , ( [ 1
0 T f T t
m
c + L−Γ −
= κ φ θ
cL L φ φ φ t f c c D t c s L L L ∂ ∂ − + ∇ • ∇ = ∂ ∂ ) 1 ( )
( L
k
0) (D c t c ∇ • ∇ = ∂ ∂ S S S S L ) , , min( 5
1 2 2
max a a V a = δ D D t Vn (8) (7)
=k0cL
cS
Fig.1: Simulated microstructural evolution with time developed from 4 seeds under conditions of a temperature gradient of 1 K/mm and pulling velocity of 1.0 mm/s: 1.13 s (a); 1.89 s (b); 1.934 s (c)
2.1 The effect of thermal gradient
In directional solidification, the thermal gradient is an important factor affecting the shape of the solidification front. The effect of thermal gradient on structure evolution developed under the pulling velocity of 0.1 mm/s was simulated (shown in Fig.2). At GL=5 K/mm, dendrites
form directly from all four seeds (Fig.2(a)). Increasing the thermal gradient, the growth of side branches of dendrites
is suppressed, and the primary and secondary spacing are shortened (Fig.2(b)). At GL=20 K/mm, cellular arms are
developed from the bottom, and the primary spacing is signiicantly reduced to 50 μm (Fig.2(c)). Finally, increasing thermal gradient to 40 K/mm, a superine cellular interface is obtained in Fig. 2(d). It should be pointed out that superine cellular morphology can be found under high thermal gradient conditions (Fig. 2(e)-(f)).
(a) (b) (c)
(a) (b) (c)
(d) (e) (f)
(K/mm)
Fig.3: Effect of temperature gradient on the primary pacing
In order to characterize the dendrite morphology quantitatively, a series of simulations with the same initial nucleation conditions have been then carried out with pulling velocity ranging 0.25–1.0 mm/s, and at different temperature gradients. The effect of temperature gradient GL on the
primary spacing is shown in Fig.3. It can be seen that at the same pulling velocity, increasing thermal gradient decreases the final primary dendrite spacing, and at the same thermal gradient, increasing pulling velocity also decreases the final primary dendrite spacing.
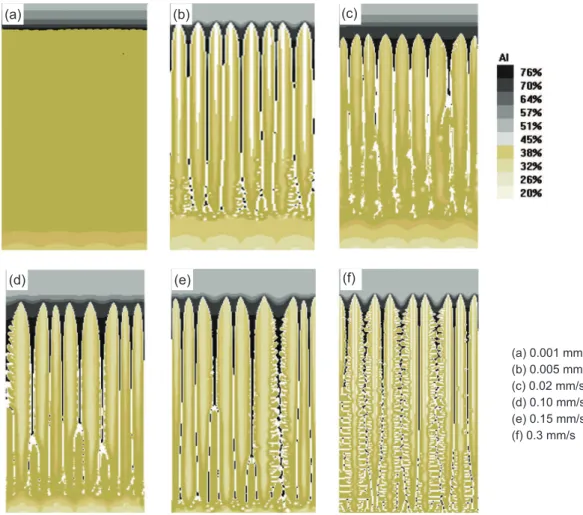
2.2 The effect of pulling velocity
Figure 4 shows the effect of the pulling velocity on the structural evolution where GL=10 K/mm. At Vp=0.001 mm/
s, a planar grain is developed from the seeds (Fig.4(a)). When pulling velocity increases to 0.005 mm/s, cells are formed directly from the seeds (Fig.4(b)-(c)). As Vp≥0.1 mm/s, some
cells show a tendency to form secondary dendrite arms, and a
Fig.4: Simulated microstructure evolution developed from 4 seeds under conditions of a temperature gradient of 10 K/mm and different drawing rate
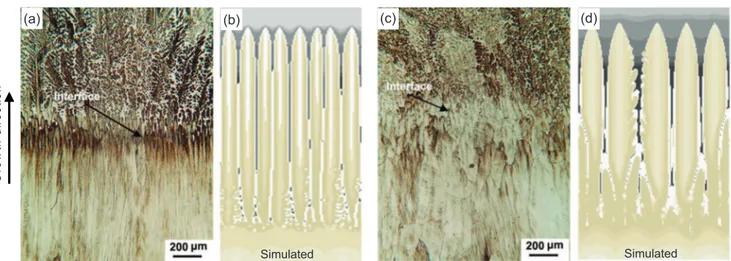
The comparison between experimental and modeling results is shown in Fig.5. With a low pulling velocity, at quenching, large quantity of parallel dendrites form at interface and in liquid phase, while ine cells appear opposite to the heat transfer direction (Fig.5(a)), which is close to the simulated results in Fig.5(b). It can be seen that, as the pulling velocity increases, coarse cells form during directional solidification (Fig.5(c)),
Figure 6 illustrates the evolution of primary cell and dendrite arm spacing with the pulling velocity. Obviously, the columnar arm spacing is intensively dependent on pulling velocity and thermal gradient. With increasing pulling velocity, the microstructure can be classified into three regions: (1) cellular structure; (2) cell/dendrite transition; (3) regular dendrites. In the cellular structure region, the primary transient structure composed of cells and dendrites is observed (Fig.4 (d)-(e)). When Vp > 0.30 mm/s, dendrites grow directly
from the seeds, and as solidification proceeding, tertiary dendrites gradually emanate from the secondary dendrites, leading to the reduction of the primary spacing (Fig. 4(f)).
(a) (b) (c)
(d) (e) (f)
Fig. 5: The interface morphologies and simulated results in directionally solidiied Ti-45Al(at.%) alloy at different pulling
velocities: Vp=0.02mm/s (a); Vp=0.03mm/s (c)
Fig.6: Dependence of the columnar grain spacing on the pulling velocity
be drawn:
(1) At the same pulling velocity, increasing thermal gradient decreases the final primary dendrite spacing, especially at high thermal gradients. Due to branching mechanism in the constrained dendritic growth, the secondary dendrite arms can not be very well developed in many cases.
(2) A transient structure composed of cells and dendrites was observed during directional solidiication. In cell/dendrite transition region, the range of the pulling velocity varies with the thermal gradient, and the higher the thermal gradient, the smaller the range. The simulated results agree reasonably well with experiment results at low pulling velocity.
References
transition region, the range of the pulling velocity varies with the thermal gradient, but in general, the spacing increases with the decrease of thermal gradient.
In the regular dendrites region, the primary dendrite arm spacing decreases proportionally with the increasing pulling velocity. Similar transient structure was also experimentally observed in Ti46Al alloy [10], characterized by the increase
of cell arm spacing with increasing growth rate. Through regression analysis, the variation of dendrite arm spacing,λ1, with the pulling velocity and temperature gradient (GL=10 K/
mm) can be expressed as follows:
(11)
Where K1 is a material constant. The value of the material
constant determined by linear regression analysis is K1=1.296
× 10-3. The rate exponent −0.24 is close to a theoretical value
of −0.25 resulting from the models of Kurz and Fisher[11]:
Compared with the models of Kurz and Fisher, the coeficient in present simulation is 5.3.
3 Conclusions
A solute diffusion controlled solidification model was used to simulate the microstructural evolution of Ti-45at.%Al alloy during directional solidiication. The following conclusions can
[1]
[2]
[3]
[4]
[5]
[6]
[7]
[8]
[9]
[10]
Lapin J, Ondrúš L, Nazmy M. Directional solidification of intermetallic Ti–46Al–2W–0.5Si alloy in alumina moulds. Intermetallics, 2002, 10: 1019-1031.
Langer J S, Müller-Krumbhaar J. Stability effects in dendritic crystal growth. Journal of Crystal Growth, 1977, 42: 11-14. Mullins C W and Sekerka R F. Stability of planar interface
during solidiication of dilute binary alloy. J. Appl. Phys., 1964,
35(2): 444-451.
Nastac L and Stefanescu D M. Stochastic modeling of microstructure formation in solidification processes. Mater. Sci. Eng., 1997, 54: 391-401.
Nastac L. Numerical modeling of solidiication morphologies
and segregation patterns in cast dendritic alloys. Acta Materialia, 1999, 47(17): 4253-4262.
Lazaro Beltran-Sanchez and Doru M Stefanescu. Growth of solutal dendrites: A cellular automaton model and its quantitative capabilities. Metall. Mater. Trans. A, 2003, 34A: 367-382.
Jung J Y, Park J K, Chun C H. Influence of Al content on cast microstructures of Ti-Al intermetallic compounds. Intermetallics, 1999(7): 1033-1041.
JungIn-Soo, Kim Min-Chul, Lee Je-Hyun, et al. High temperature phase equilibria near Ti-50 at% Al composition in
Ti-Al system studied by directional solidiication. Intermetallics,
1999(7): 1247-1253.
Yamaguchi M, Johnson D R, Lee H N and Inui H. Directional
solidiication of TiAl-base alloys. Intermetallics, 2000(8): 511-517. Kurz W and Fisher D J. Dendrite growth at the limit of stability:
tip radius and spacing. Acta Metall, 1981, 29: 11-20. (12)
L
L
24 . 0 5 . 0 1 1
− −
=KG V
λ p
D
Simulated Simulated
(a) (b) (c) (d)
4 / 1 2 / 1 4 / 1
0 0 1 4.3
− −
Γ ∆
= GL Vp
T
λ
![Table 1: Material properties and model parameters used in the simulation [7, 8]](https://thumb-eu.123doks.com/thumbv2/123dok_br/16385110.192229/2.918.483.841.603.772/table-material-properties-and-model-parameters-used-simulation.webp)