Microstructural evolution and mechanical properties of Sn-Bi-Cu ternary eutectic alloy
produced by directional solidification
Mevlüt Şahina*, Tolga Şensoyb, Emin Çadırlıc
Received: October 03, 2017; Revised: December 13, 2017; Accepted: December 20, 2017
Sn-36Bi-22Cu (wt.%) ternary eutectic alloy was prepared using vacuum melting furnace and casting furnace. The samples were directionally solidified upwards solidification rate varying from 8.3 to 166 µm/s and at a constant temperature gradient (4.2 K/mm) in a Bridgman-type directional solidification
furnace. The composition analysis of the phases and the intermetallics (Cu3Sn and Cu6Sn5) were
determined from EDX and XRD analysis respectively. The variation of the lamellar spacing (Bi-rich
phase) and the Cu3Sn phase spacing with the solidification rate were investigated. The dependence
of microhardness, ultimate compressive strength and compressive yield strength on solidification rate were determined. The spacing and microhardness were measured from both longitudinal and transverse sections of the samples. The dependence of microhardness on the lamellar spacing and the Cu3Sn phase spacing were also determined. The relationships between phase spacings, solidification rate and mechanical properties were determined from linear regression analysis.
Keywords: Directional solidification, eutectic alloy, microstructure, intermetallic compound,
microhardness, compressive strength.
*e-mail: [email protected]
1. Introduction
Solidification plays a vital role since it forms the basis for influencing the microstructure and hence improving the quality of cast products. For this improving the casting production and solidification methods have a significant effect on the mechanical properties of the materials and enhancing
the quality of cast metals1-4. Directional solidification5 is
one of the most important solidification methods used for material processing. The mechanical properties of the alloys can be improved by obtaining finer microstructure result from higher solidification rates and higher cooling rates under several directional solidification conditions6-13. The
directionally solidified alloy exhibited higher strength than the non-directionally solidified alloy under the same cooling rate14,15. Liu et al.16 reported that the tensile strength of the
in situ composite from the directionally solidified alloy is significantly higher than that from the as-cast alloy.
Soldering technology is an essential part of electronic devices since it plays a key role not only as an electrical
connection but also as a mechanical bond17,18. Currently,
solder joints with higher reliability is demanding because the trend in electronic package is to make products smaller and faster. For global environment conservation, many researches
on replacing the conventional Pb-Sn eutectic solder with a free solder have been carried out. Among various
lead-free solders, Sn-Bi alloy is one of the promising candidates19.
Furthermore, the ternary Sn-Bi-Cu ternary alloys may also be
considered as promising lead-free solders19. Recently, Ag, Bi
or In-containing Sn-Cu alloys have received some attention, and in several prominent reliability test programs Sn-Cu-Ag and Sn-Cu-In alloys demonstrated superior performance, at least in its mechanical strength20,21. Tai et al.22 showed that
creep resistance of Sn-3.5Ag was improved significantly for Cu particle-reinforced composite solder joints at 25
oC, 65 oC and 105 oC. The tensile strength increased with
increasing Bi content in the Sn-Cu eutectic solder alloy, which was attributed to the presence of Bi and its role in refining microstructure and solid solution strengthening23.
Zhang et al.24 reported that Sn-Bi-Cu alloys were found to
have greater wettability than the Sn-Ag-Cu alloy, and it was confirmed that the addition of Bi increases the wettability. The effect of Cu3Sn and Cu6Sn5 intermetallics (IMC's) on
the mechanical properties were investigated from many
researchers25,26. Cheng et al.25 reported that, Cu
3Sn single
crystal consist of high ultimate strengths depending on the
material directions and strain rate. Hu et al.26 reported that,
a Niğde Ömer Halisdemir University, Technical Vocational School of Sciences, Department of
Electronics and Automation, Niğde, Turkey
b Niğde Ömer Halisdemir University, Institute of Science and Technology, Department of Physics,
Niğde, Turkey
c Niğde Ömer Halisdemir University, Faculty of Arts and Sciences, Department of Physics, Niğde,
increased amount of Cu6Sn5 fibers caused an increment in both ultimate tensile strength and yield tensile strength. The mechanical properties (microhardness, shear stress, young and bulk modulus) and the wettability of the SnCu solder
were improved with Bi addition27. There are numerous
works on low solute content (Cu) Sn-based alloys8,23-31.
Nevertheless, there has been only a limited amount of data about the mechanical properties of directionally solidified high solute content (Cu) based alloy. In this study, Sn-Bi-Cu ternary alloy containing high Cu is preferred. Similar alloys are used as soldering or brazing material depending on the content of copper. The aim of the present work is to investigate the effect of solidification rate (V) on microstructure (λ), microhardness (HV) and compressive strength (σ) of the directionally solidified Sn-36Bi-22Cu (wt.%) ternary eutectic alloy. The dependence of microhardness on the
lamellar spacing (Bi-rich phase) and the Cu3Sn IMC phase
spacing were also determined.
2. Experimental Procedure
2.1. Alloy preparation, directional solidification
and metallographic processes
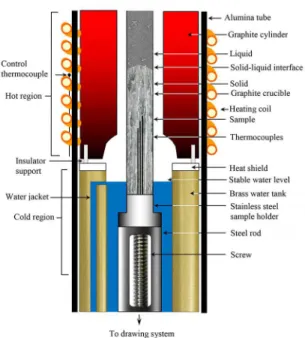
Weighed quantities of Sn, Bi and Cu metals in a graphite crucible determined from stoichiometric calculations were placed in a vacuum melting furnace, and the metals were completely melted. After allowing time for the melt to become homogeneous, the molten alloy was poured into graphite crucibles in a casting furnace. The molten alloy solidified from bottom to top in the casting furnace. The directional solidification of the produced alloy was performed in a Bridgman-type directional solidification furnace whose schematic diagram is given in Figure 1. For the directional solidification, the sample was placed into the sample holder. The sample was placed into the furnace. After the furnace reached the desired temperature and thermal stabilization, the sample was withdrawn from the hot region to the cold region of the furnace with the help of different speeded synchronous motors. The alloy was directionally solidified under different solidification rates (8.3-166 µm/s) at a constant temperature gradient (4.2 K/mm). When the sample solidified 12-13 cm, it was quenched in water. Details of the furnaces equipment, alloy preparation, and directional solidification
are given in previous work32.
For the metallographic processes, the longitudinal and the transverse sections of the samples were cold mounted with epoxy-resin. The samples were then ground with 320-4000 grit SiC paper and polished with 3-0.25 µm diamond pastes.
The alloys were then etched with 95 ml H2O, 2.5 ml HNO3,
1.5 ml HCI, 1 ml HF. The micrographs of the samples were taken with the Olympus BX-51 model optical microscope by using different objectives. The lamellar spacing, λ (Bi-rich
( / )
sin
HV
d
P
2
0 2
2
=
Figure 1. The Bridgman-type directional solidification furnace
phase) and the Cu3Sn intermetallic phase spacings (λI)
were measured with the Adobe Photoshop CS3 program taking into account the magnification factor. In eutectic and intermetallic phase spacing measurements, linear intersection method is used. In both measurements, at least 30-50 values were measured for each specimen at least on ten different regions for each specimen for statistical reliability. The details of eutectic and particle spacing measurements were
described elsewhere32.
2.2. Measurement of microhardness
Microhardness measurements were performed with a
Future Tech FM-700 model digital microhardness test device. This device has the ability of applying 1-1000 g load. In this work 10 g load was applied to the sample for 10 seconds. The measurements were taken from the solid parts nearest to the solid-liquid interface. Average of 30 measurements were taken from longitudinal and transverse sections of the directionally solidified samples, and the average values were taken for the microhardness value. When the indenter of the test device applied to the sample for certain times, the trace in the shape of square occurs. The diagonal size of the trace (d) is read from the test device. By dividing the applied force by the trace area the Vickers microhardness is determined as follows
(1)
where P is the applied load (kg), d is the diagonal length of trace, θ is the angle between the opposite surfaces of the diagonal trace.
2.3. Measurement of compressive strengths
The dependence of ultimate compressive strength and compressive yield strength on the solidification rate were determined. In this work, round rod samples have a length of 6-8 mm and a diameter of 4 mm were used. Compressive strength measurements of the samples were made at room temperature at a deformation rate of 1 mm/min. Compressive tests were performed to the directionally solidified round rod samples with different solidification rates.
3. Results and Discussion
3.1 Determination of the chemical components of
the phases
According to the binary phase diagrams among Bi, Sn and Cu, solid solubility of Sn in solid Bi and Bi in solid Sn are about 0.1 wt.% Sn and 21 wt.% Bi, respectively at the
eutectic temperature, 139°C33. Also, the solubility of solid
Sn in Cu and solid Cu in Sn are about 1 wt.% and 0.006
wt.%, respectively at the eutectic temperature, 232°C33.
Previous work34 indicated that the calculated solubilities of
Bi in solid Cu or Cu in solid Bi at the eutectic point are both approximately 10-9 with the assumption that the interchange
energy in the rhombohedral structure is similar to that in the fcc structure. This small amount cannot be detected with modern spectroscopy, and the material is normally treated as a pure material34.
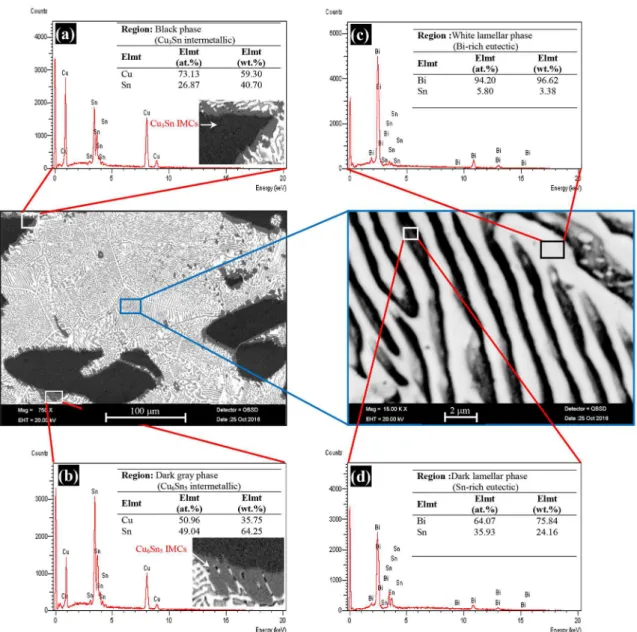
Energy dispersive X-ray (EDX) analysis was performed to determine the composition of phases in the Sn-Bi-Cu eutectic alloy. EDX analysis was performed at 20 keV using the X-ray lines. According to the EDX analysis results shown in Figure 2, four different solid phases (black, dark gray, white lamellar and dark lamellar) grew at the Sn-Bi-Cu
eutectic alloy. The compositions of the black phase (Cu3Sn
intermetallic) and dark gray phase (Cu6Sn5 intermetallic)
were Cu-wt.% 40.70 Sn and Sn-wt.% 35.75 Cu, respectively. Also, the white lamellar phase (Bi-rich eutectic) and dark lamellar phase (Sn-rich eutectic) were Bi-3.38 wt.% Sn and Bi-24.16 wt.% Sn, respectively. Figure 2 shows examples of representative SEM images of ternary eutectic microstructures obtained for the directionally solidified Sn-36Bi-22Cu alloys, with the eutectic mixtures being characterized by complex arrangements of Bi-rich and Sn-rich phases and the
corresponding intermetallic compounds, Cu3Sn and Cu6Sn5,
respectively. For the Cu3Sn IMC, its growth is governed by
the reaction between Cu and Sn atoms. Clevenger et al.35
reported the onset of Cu3Sn formation from the reaction
between Cu6Sn5 and Cu. The Cu3Sn phase can be formed by
conventional casting36,37, directional solidification8,23,26 and
rapid solidification methods38-40. Due to the solidification
temperature differences, initially the Cu-rich Cu3Sn and
Cu6Sn5 IMC phases solidified, followed by Sn-rich and
Bi-rich phases at a lower temperature. Ternary cooperative growth has not been observed for this reason. In addition, the presence of these phases was confirmed by EDX (Fig.2) and
XRD analysis (Fig.3). According to Fig.2, Cu3Sn particles
with a thickness about 4 µm were surrounded by Cu6Sn5
phase and these two phases are coherent with each other
very well. During the eutectic reaction, the Cu3Sn IMC phase
grows as rods embedded in a continuous Bi-rich matrix. X-ray diffraction (XRD) measurements were performed with a diffractometer (Rigaku Ultima IV) using Cu-Kα radiation (k=1.5405 A°) at an accelerating voltage of 40 kV. The diffracted beam was scanned in steps by 0.01º across a 2θ range of 10-100º. XRD results of as-cast alloy are shown
in Figure 3. As indicated, the presence of Cu3Sn and Cu6Sn5
is confirmed due to the high number of peaks corresponding
to these phases. Bi was not observed present in the Cu3Sn
and Cu6Sn5 IMC phases, and Bi did not form IMCs in the
interfacial reactions. The Cu3Sn and Cu6Sn5 intermetallics
have rod-like morphologies, being characterized as faceted
phases. Cu3Sn IMC is a more stable phase than Cu6Sn5 IMC.
The Cu3Sn intermetallic particles may grow in a rod-like
form without branches, as shown in Figure 4. Kim et al.41
reported similar morphologies for the Cu6Sn5 and Ag3Sn
particles in Sn-Ag-Cu alloys.
3. 2 Effect of solidification rate on microstructure
The optic micrographs of the longitudinal and transverse sections of directionally solidified Sn-Bi-Cu eutectic alloy at different solidification parameters are shown in Figure 4. The microstructure is formed by dispersed rod-like particlesof Cu3Sn within Sn-rich and Bi-rich phases. Cu3Sn IMC
appears for each solidification rate. Cooling condition has a significant effect on the IMC thickness. For a constant temperature gradient (4.2 K/mm), it is found that the complex
regular Bi-Sn lamellar spacings and Cu3Sn intermetallic phase
spacings are mainly controlled by the solidification rate (V), and both of them decrease with increased solidification rate.
Spacings between primary intermetallic particles (Cu3Sn) were
measured. These particles are part of the complex regular eutectic microstructure. At the highest growth rate (166 µm/s), the average spacing between the particles is reduced to 22 µm. Consequently, the microstructure underwent are finement with an increase in the solidification rate (Table 1).
Higher solidification rate yields a thinner IMC, which
is consistent with other researchers' results42,43. Because of
its mechanical properties, Cu3Sn is also more suitable than
Cu6Sn5 and Sn as a joint material for microbumps44,45.
Rod-like Cu3Sn particles prevailed along the Bi-rich
eutectic matrix, as can be seen in Fig. 4. These hard and brittle
Cu3Sn particles are normally alternated with the Bi-rich phase
permitting the eutectic mixture to be characterized. According
to Figure 4, The primary Cu3Sn intermetallic phases with a
thickness about 4 µm were surrounded by Cu6Sn5 intermetallic
Figure 2. The chemical composition analysis of Sn-36Bi-22Cu eutectic alloy (G=4.2 K/mm, V=8.3 µm/s) by using SEM-EDX, (a) black
phase (Cu3Sn intermetallic phase) (b) dark gray phase (Cu6Sn5 intermetallic phase) (c) white lamellar phase (Bi-rich eutectic phase) (d)
dark lamellar phase (Sn-rich eutectic phase)
Figure 3. X-ray diffraction patterns obtained from the Sn-36Bi-22Cu
alloy
phases are coherent with each other very well. With increasing the solidification rate from 8.3 to 166 µm/s, the thickness
of Cu6Sn5 intermetallic phase decreased from 4.15 µm to
0.75 µm. The thickness of the Cu6Sn5 phase agrees with the
thickness found by Chen46, Le et al.47 and Rao et al.48. The
variation of lamellar spacing (λ) and Cu3Sn intermetallic
phase spacing (λI) with solidification rate are given in Table 1
and Figure 5, and the relationships between these parameters are given in Table 2. At a constant temperature gradient (4.2 K/mm), the λ and λI decreased with increasing solidification
rate. The average eutectic spacing values measured on the longitudinal (λL) and transverse (λT) sections of the samples
Figure 4. Optical images of the directionally solidified
Sn-36Bi-22Cu eutectic alloy at a constant temperature gradient (G=4.2 K/
mm) (a-e) longitudinal section (V=8.3-166.0 µm/s), (f-j) transverse section (V=8.3-166.0 µm/s)
1.41 µm, λT (lamellar) decreased from 2.89 to 1.50 µm, λIL
(for Cu3Sn phase) decreased from 98.3 to 18.6 µm and λIT
(for Cu3Sn phase) decreased from 108.0 to 25.4 µm. The
exponent value (0.24-0.25) of the V is in good agreement with the values of 0.22-0.26, 0.25 obtained by Şahin and Çadırlı49
for Bi-2.0Zn-0.2Al (wt.%) eutectic alloy, by Yan et al.50 for
Nb-22Ti-16Si-3Cr-3Al-2Hf (at.%) alloy, respectively. Since ternary cooperative growth has not been observed in this study, the exponent value of 0.5 predicted by the
Jackson-Hunt eutectic theory51 for binary eutectics was not obtained.
However, as can be seen from Table 2, an exponent value of
0.52 was obtained for the dependence of the Cu3Sn phase
spacings related to solidification rate.
3.3. Effect of solidification rate on microhardness
The dependence of microhardness on the solidification rate and phase spacing is given in Table 1 and Figures 6 and 7, and the relationships between these parameters are given in Table 3. At a constant temperature gradient (4.2 K/mm), the microhardness values increased with increasing solidification rate. The average microhardness values measured on the longitudinal and transverse sections of the samples are given in Table 1. With increasing the solidification rate from 8.3 to 166 µm/s, the HVL increased
from 192.7 to 290.8 MPa and HVT increased from 193.2 to
296.7 MPa. Also, the HVIL (Cu3Sn phase) increased from
3054.8 to 3436.4 MPa and HVIT (Cu3Sn phase) increased
from 2663.4 to 3144.1 MPa. The measured microhardness
values for the Cu3Sn phase are in good agreement with
the values of 3364.8, 3266.7-2795.9 (0.98-4.9 N load), 3364.8 and lower than the 4231.1-4184.9 MPa (1.96-4.9 N load) obtained by Lee et al.52, Liu et al.53, Frear et al.54
and Ghosh55, respectively.
The exponent value (0.13-0.14) of the V (for lamellar structure) is in good agreement with the value of 0.14,
0.11, 0.15, values obtained by Zhang et al.7 for Ni-25at.%Si
alloy, by Hu et al.56 for Sn-1.0 wt.% Cu, by Fan et al.57 for
Ti-46Al-0.5W-0.5Si alloy (at.%), respectively. Decrease in lamellar spacing due to the increasing solidification rate, increased the microhardness. As can be seen from Table 1 and Figure 7, microhardness increased with decreasing lamellar spacing. With decreasing the λL from 2.72 to 1.41 µm, HVL
increased from 192.7 to 290.8 MPa. With decreasing the λIL from 98.3 to 18.6 µm, HVIL increased from 3054.8 to
3436.4 MPa. Similarly, With decreasing the λT from 2.89
to 1.50 µm, HVT increased from 193.2 to 296.7 MPa. With
decreasing the λIT from 108.0 to 25.4 µm, HVIT increased
from 2663.4 to 3144.1 MPa.
The increment of the solidification rate not only decrease
the Cu3Sn IMC spacings but also refines the Cu3Sn IMC
phases. The finer microstructure causes an increment on the mechanical properties. The microhardness values of the Cu3Sn phases are approximately 10-15 times greater than the complex Bi-Sn eutectic phase. However, the change in complex lamellar spacing is more effective on microhardness. As shown in Table 3, the exponent value (0.53) of the Bi-Sn complex lamellar phase is quite larger than the exponent
value (0.09) of the Cu3Sn IMC phase. This is due to the fact
that the dependency of the Bi-Sn complex lamellar spacing on the solidification rate is quite large relative to the Cu3Sn
IMC phase spacing. The exponent value (0.53) of the lamellar phase is good agreement with the 0.50 value obtained by
Table 1. Experimental data of the Sn-36Bi-22Cu alloy.
G (K/mm)
V
(μm/s) (μm)λ (μm)λI (MPa)HV
Thickness of Cu6Sn5 (μm)
HVI
(MPa)
σy
(MPa)
σc
(MPa)
4.2 8.3 2.81 103.1 192.9 4.15 2859.1 71.5 102.1
4.2 16.6 2.60 73.2 215.1 3.29 2958.2 91.0 110.0
4.2 41.5 1.78 37.2 233.6 2.10 3042.1 103.3 113.0
4.2 83.0 1.51 30.4 260.0 1.68 3124.5 112.3 116.3
4.2 166.0 1.46 22.0 293.7 0.75 3290.3 118.9 139.3
λ: the value of the lamellar spacing
λI: the value of the Cu3Sn intermetallic phase spacing HV: the microhardness value of the lamellar structure HVI:the microhardness value of the Cu3Sn intermetallic phase σy: the value of the compressive yield strength
σc: the value of the ultimate compressive strength.
Figure 5. Variation of phase spacings versus solidification rate
Table 2. The relationships between the microstructure
parameters and the solidification rate
Relationships Constant (k) Coefficient (r)Correlation
λIL=k1V-0.52 k1=273.53
(μm1.52s-0.52) r1= -0.990
λIT=k2V
-0.53 k2=333.43
(μm1.53s-0.53) r2= -0.973
λL=k3V
-0.25 k3=4.68
(μm1.25s-0.25) r3= -0.960
λT=k4V-0.24 k4=4.92
(μm1.24s-0.24) r4= -0.979
λIL: the spacings between the Cu3Sn intermetallic phases
measured from the longitudinal section of the sample
λIT: the spacings between the Cu3Sn intermetallic phases
measured from the transverse section of the sample
λL: the values of the lamellar spacing (Bi rich phase) measured
from the longitudinal section of the sample
λT: the values of the lamellar spacing (Bi rich phase) measured
from the transverse section of the sample.
Figure 6. Variation of microhardness versus solidification rate
Table 3. The relationships between the solidification rate and the
mechanical properties
Relationships Constant (k) Coefficient (r)Correlation
HVL=k1V
0.13 k
1=360.83 (MPa mm
-0.13s0.13) r
1= 0.989
HVT=k2V0.14 k
2=374.11 (MPa mm
-0.14s0.14) r
2= 0.996 HVIL=k3V
0.04 k
3=3660.16 (MPa mm
-0.04s0.04) r
3= 0.971 HVIT=k4V
0.05 k
4=3379.87 (MPa mm
-0.05s0.05) r
4= 0.959
HVL=k5λ-0.47 k
5=12.31 (MPa mm
0.47) r
5= -0.913 HVT=k6λ
-0.53 k
6=9.15 (MPa mm
0.53) r
6= -0.956 HVIL=k7λ
-0.07 k
7=2622.41 (MPa mm
0.07) r
7= -0.991
HVIT=k8λ-0.09 k
8=2145.85 (MPa mm0.09) r8= -0.902
σc=k9V
0.09 k
9=153.74 (MPa mm
-0.09s0.09) r
9= 0.914 σy=k10V
0.16 k
10=165.99 (MPa mm
-0.16s0.16) r
10= 0.962 HVL: the value of the microhardness measured from the
longitudinal section of the lamellar structure
HVT: the value of the microhardness measured from the
transverse section of the lamellar structure
HVIL: the value of the microhardness measured from the
longitudinal section of the Cu3Sn intermetallic phase HVIT: the value of the microhardness measured from the transverse section of the Cu3Sn intermetallic phase
σc: the values of the ultimate compressive strength
σy: the values of the compressive yield strength
3.4 Effect of solidification rate on compressive
strength
Compressive strength-strain curves for Sn-36Bi-22Cu alloy are shown in Figure 8. The variation of ultimate compressive strength (σc) and compressive yield strength (σy)
determined form strength-strain curves with solidification rate are given in Figure 9 and Table 1, and the relationships between these parameters are given in Table 3. At a constant temperature gradient (4.2 K/mm), the compressive strength values increased with increasing solidification rate. With increasing the solidification rate from 8.3 to 166 µm/s, the σc increased from 102.1 to 139.3 MPa and the σy increased
from 71.5 to 118.9 MPa. The exponent value (0.09) of the V for the σc is in good agreement with the 0.08, 0.08, 0.11
values of σt obtained by Hu et al.
23 for Sn-0.7Cu-0.7Bi
(wt.%) alloy, by Hosch and Napolitano58 for Al-12wt.%Si
alloy, by Çadırlı et al.59 for Sn-40.5Pb-2.6Sb (wt.%) ternary
eutectic alloy respectively. The exponent value (0.16) of the V for the σc is in good agreement with the 0.16 value of the
σt obtained by Hu et al.
23 for Sn-0.7Cu-0.7Bi (wt.%) alloy.
Nevertheless, the exponent value (0.09) of the V for the ultimate compressive strength is higher than the 0.04 value of ultimate tensile strength and the exponent value (0.16) of the V for the compressive yield strength is slightly higher than the 0.12 value of the tensile yield strength, σ,
obtained by Hu et al.23 for Sn-0.7Cu-1.3Bi (wt.%) alloy.
Differences exist in the exponent values because of the possible differences in purity, different alloy compositions, solidification conditions and the surface preparation of the test
Figure 8. Typical strength-strain curves of Sn-36Bi-22Cu eutectic
alloy for different V at a constant G
Figure 9. Variation of compressive strength of the Sn-36Bi-22Cu alloy as a function of solidification rate
pieces. Also, solidification rate effects the elongation of the alloy. Hu et al.26 determined that, with increasing solidification
rate from 5 to 100 µm/s, the elongation increased from % 28.2 to % 41.5 for Sn-0.7Cu-0.7Bi (wt.%) alloy. Sakuyama
et al.36 found that, the elongation of the Bi-41.8Sn-0.5Cu
is higher than the Bi-41.8Sn-0.5Ag, Bi-41.8Sn-0.5Zn and Bi-42Sn alloys. This situations improve the importance of the material for technological applications.
According to the literature60, it is well established that the
two IMCs are the ε-phase (Cu3Sn) and η-phase (Cu6Sn5). The
presence of those intermetallic phases may increase HV and σ, but the ductility properties slightly decrease with further increased solidification rate, that may contribute to a reason. The main reason is that the high growth velocity during directional solidification may result in a radial temperature
gradient, which leads to some Cu3Sn fibers do not grow
along with the crystal growth direction. Consequently, the increment in the solidification rate caused finer microstructure. This finer microstructure has improved the some mechanical properties (HV, σc) of the Sn-Bi-Cu ternary eutectic alloy.
by Cu3Sn and Cu6Sn5 IMCs in the Sn-matrix of Sn-Bi-Cu ternary system. These IMC phases build a long-range internal stress, resulting in a strengthening effect.
4. Conclusions
Sn-36Bi-22Cu (wt.%) ternary eutectic alloy was directionally solidified upwards at a constant temperature gradient (4.2 K/mm) under different solidification rates (8.3-166µm/s) in a Bridgman-type directional solidification furnace. The results are summarized as follows:
1. The lamellar spacing and the Cu3Sn phase spacing
decreased with increasing solidification rate. With increasing the solidification rate from 8.3 to 166 µm/s, average λ decreased from 2.81 to 1.46 µm, average
λI decreased from 103.1 to 22.0 µm for the lamellar
spacing and Cu3Sn phase spacing, respectively.
The relationships between the eutectic spacings and solidification rate were obtained by binary
regression analysis as (λL=4.7V
-0.25,λ
IL=273V-0.52)
2. The microhardness increased with increasing
solidification rate. Average HV increased from 192.9 to 293.7 MPa, and HVI increased from 2859.1
to 3290.3 MPa with increasing the solidification rate from 8.3 to 166 µm/s. The establishment of
the relationship between HV and V can be given
as (HV=367.3V0.13,HV=3520.5V0.04)
3. The compressive strength values increased with
increasing solidification rate. The σc increased from
102.1 to 139.3 MPa and the σy increased from 71.5
to 118.9 MPa with increasing the solidification rate from 8.3 to 166 µm/s. The relationships between σ and V can be given as (σc=153V0.09,σ y=165V0.16).
5. References
1. Stefanescu DM. Science and Engineering of Casting Solidification, Kluwer Academic/Plenum Publishers, New York, 2002.
2. Campbell J. Effects of vibration during solidification. International Metals Reviews. 1981;26(1):71-108.
3. Verma A, Tewari SP, Prakash J. Vibratory stress, solidification
and microstructure of weldments under vibratory welding condition - A review. International Journal of Engineering
Science and Technology. 2011;3(6):5215-5220.
4. Yao L, Hao H, Ji SH, Fang CF, Zhang XG. Effects of ultrasonic vibration on solidification structure and properties of
Mg-8Li-3Al alloy. Transactions of Nonferrous Metals Society of China. 2011;21(6):1241-1246.
5. Gündüz M, Çadırlı E. Directional solidification of
aluminium-copper alloys. Materials Science and Engineering: A.
2002;327(2):167-185.
6. Verissimo NC, Brito C, Santos WLR, Cheung N, Spinelli JE, Garcia
A. Interconnection of Zn content, macrosegregation, dendritic growth,
nature of intermetallics and hardness in directionally solidified
Mg-Zn alloys. Journal of Alloys and Compounds. 2016;662:1-10.
7. Zhang B, Li X, Wang T, Liu Z. Microstructures and mechanical
properties of directionally solidified Ni-25%Si full lamellar
in situ composites. Materials Science and Engineering: A. 2016;674:242-249.
8. Silva BL, Garcia A, Spinelli JE. Complex eutectic growth and
Bi precipitation in ternary Sn-Bi-Cu and Sn-Bi-Ag alloys.
Journal of Alloys and Compounds. 2017;691:600-605.
9. Luo S, Yang G, Liu S, Wang J, Li J, Jie W. Microstructure evolution and mechanical properties of directionally solidified
Mg-xGd (x=0.8, 1.5, and 2.5) alloys. Materials Science and
Engineering: A. 2016;662:241-250.
10. Reyes RV, Bello TS, Kakitani R, Costa TA, Garcia A, Cheung
N, et al. Tensile properties and related microstructural aspects
of hypereutectic Al-Si alloys directionally solidified under different melt superheats and transient heat flow conditions. Materials Science and Engineering: A. 2017;685:235-243.
11. Fan J, Liu J, Tian S, Wu S, Wang S, Gao H, et al. Effect of
solidification parameters on microstructural characteristics and mechanical properties of directionally solidified binary TiAl alloy. Journal of Alloys and Compounds. 2015;650:8-14.
12. Bertelli F, Freitas ES, Cheung N, Arenas MA, Conde A,
Damborenea J, et al. Microstructure, tensile properties and wear resistance correlations on directionally solidified Al-Sn-(Cu;
Si) alloys. Journal of Alloys and Compounds. 2017;695:3621-3631.
13. Zhai W, Wang B, Hu L, Wei B. Ternary eutectic growth during
directional solidification of Ag-Cu-Sb alloy. Philosophical
Magazine Letters. 2015;95(4):187-193.
14. Liu S, Yang G, Jie W. Microstructure, Microsegregation, and Mechanical Properties of Directional Solidified
Mg-3.0Nd-1.5Gd Alloy. Acta Metallurgica Sinica (English Letters). 2014;27(6):1134-1143.
15. Wang JH, Yang GY, Liu SJ, Jie WQ. Microstructure and room temperature mechanical properties of directionally solidified
Mg-2.35Gd magnesium alloy. Transactions of Nonferrous
Metals Society of China. 2016;26(5):1294-1300.
16. Liu K, Jiang Z, Zhao J, Zou J, Chen Z, Lu D. Effect of directional solidification rate on the microstructure and properties of
deformation-processed Cu-7Cr-0.1Ag in situ composites.
Journal of Alloys and Compounds. 2014;612:221-226.
17. Kang SK, Sarkhel AK. Lead (Pb)-free solders for electronic packaging. Journal of Electronic Materials. 1994;23(8):701-707.
18. Liu KC, Duh JG. Microstructural evolution in Sn/Pb solder and
Pd/Ag thick film conductor metallization. IEEE Transactions
on Components, Hybrids, and Manufacturing Technology. 1991;14(4):703-707.
19. Lee JI, Chen SW, Chang HY, Chen CM. Reactive wetting
between molten Sn-Bi and Ni substrate. Journal of Electronic
Materials. 2003;32(3):117-122.
20. El-Daly AA, Hammad AE. Development of high strength Sn-0.7Cu solders with the addition of small amount of Ag and In. Journal of Alloys and Compounds.
21. El-Daly AA, Hammad AE. Enhancement of creep resistance and thermal behavior of eutectic Sn-Cu lead-free solder alloy by Ag and In-additions. Materials & Design. 2012;40:292-298.
22. Tai F, Guo F, Han MT, Xia ZD, Lei YP, Shi YW. Creep and thermomechanical fatigue properties of in situ Cu6Sn5 reinforced lead-free composite solder. Materials Science and Engineering:
A. 2010;527(15):3335-3342.
23. Hu X, Li Y, Liu Y, Min Z. Developments of high strength Bi-containing Sn0.7Cu lead-free solder alloys prepared by
directional solidification. Journal of Alloys and Compounds.
2015;625:241-250.
24. Zhang X, Matsuura H, Tsukihashi F, Yuan Z. Wettability of Sn-Zn, Sn-Ag-Cu and Sn-Bi-Cu alloys on copper subsrates.
Materials Transactions. 2012;53(5):926-931.
25. Cheng HC, Yu CF, Chen WH. Strain- and strain-rate-dependent mechanical properties and behaviors of Cu3Sn compound using molecular dynamics simulation. Journal of Materials Science. 2012;47(7):3103-3114.
26. Hu X, Li K, Min Z. Microstructure evolution and mechanical properties of Sn0.7Cu0.7Bi lead-free solders produced by
directional solidification. Journal of Alloys and Compounds.
2013;566:239-245.
27. Mohammed S, El-Maghraby A. Study of some mechanical properties and wetting behavior with addition Bi to SnCu solder alloys. International Journal of Innovative Research in
Science, Engineering and Technology. 2014;3(2):9439-9446.
28. Silva BL, Garcia A, Spinelli JE. Cooling thermal parameters and microstructure features of directionally solidified ternary
Sn-Bi-(Cu,Ag) solder alloys. Materials Characterization. 2016;114:30-42.
29. Yang TL, Wu JY, Li CC, Yang S, Kao CR. Low temperature
bonding for high temperature applications by using SnBi solders.
Journal of Alloys and Compounds. 2015;647:681-685. 30. Spinelli JE, Garcia A. Microstructural development and
mechanical properties of hypereutectic Sn-Cu solder alloys.
Materials Science and Engineering: A. 2013;568:195-201.
31. Wang KK, Gan D, Hsieh KC. The orientation relationships of the Cu3Sn/Cu interfaces and a discussion of the formation sequence of Cu3Sn and Cu6Sn5. Thin Solid Films. 2014;562:398-404.
32. Sahin M. The directional solidification of binary and ternary
metallic alloys and investigation the physical properties of
them. [Thesis]. Nigde: Nigde University; 2012.
33. Hansen M, Anderko K. Constitutions of Binary Alloys. New
York: McGraw-Hill; 1958.
34. Chang LS, Straumal BB, Rabkin E, Gust W, Sommer F. The Solidus Line of the Cu-Bi Phase Diagram. Journal of Phase
Equilibria. 1997;18(2):128-135.
35. Clevenger LA, Arcot B, Ziegler W, Colgan EG, Hong QZ, d'Heurle FM, et al. Interdiffusion and phase formation in Cu(Sn)
alloy films. Journal of Applied Physics. 1998;83(1):90-99.
36. Sakuyama S, Akamatsu T, Uenishi K, Sato T. Effects of a
Third Element on Microstructure and Mechanical Properties of Eutectic Sn-Bi Solder. Transactions of The Japan Institute
of Electronics Packaging. 2009;2(1):98-103.
37. Wang KK, Gan D, Hsieh KC. The orientation relationships of the Cu3Sn/Cu interfaces and a discussion of the formation sequence of Cu3Sn and Cu6Sn5. Thin Solid Films. 2014;562:398-404.
38. Shen J, Liu YC, Gao HX. Formation of bulk Cu6Sn5 intermetallic compounds in Sn-Cu lead-free solders during solidification. Journal of Materials Science. 2007;42(14):5375-5380. 39. El Ashram T, Shalaby RM. Effect of rapid solidification and
small additions of Zn and Bi on the structure and properties of Sn-Cu eutectic alloy. Journal of Electronic Materials. 2005;34(2):212-215.
40. Zhai W, Wang BJ, Lu XY, Wei B. Rapid solidification mechanism
of highly undercooled ternary Cu40Sn45Sb15 alloy. Applied
Physics A. 2015;121(1):273-281.
41. Kim KS, Huh SH, Suganuma K. Effects of intermetallic
compounds on properties of Sn-Ag-Cu lead-free soldered joints.
Journal of Alloys and Compounds. 2003;352(1-2):226-236.
42. Ochoa F, Williams JJ, Chawla N. Effects of cooling rate on the
microstructure and tensile behavior of a Sn-3.5wt.%Ag solder.
Journal of Electronic Materials. 2003;32(12):1414-1420.
43. Deng X, Piotrowski G, Williams JJ, Chawla N. Influence
of initial morphology and thickness of Cu6Sn5and Cu3Sn intermetallics on growth and evolution during thermal aging of Sn-Ag solder/Cu joints. Journal of Electronic Materials. 2003;32(12):1403-1413.
44. Bosco NS, Zok FW. Critical interlayer thickness for transient liquid phase bonding in the Cu-Sn system. Acta Materialia. 2004;52(10):2965-2972.
45. Deng X, Chawla N, Chawla KK, Koopman M. Deformation behavior of (Cu, Ag)-Sn intermetallics by nanoindentation.
Acta Materialia. 2004;52(14):4291-4303.
46. Chen Z. Micro-mechanical characteristics and dimensional
change of Cu-Sn interconnects due to growth of interfacial intermetallic compounds. [Thesis]. Loughborough: Loughborough
University; 2014.
47. Lee HT, Chen MH, Jao HM, Liao TL. Influence of interfacial
intermetallic compound on fracture behavior of solder joints.
Materials Science and Engineering: A. 2003;358(1-2):134-141. 48. Chandra Rao BSS, Weng J, Shen L, Lee TK, Zeng KY. Morphology
and mechanical properties of intermetallic compounds in SnAgCu solder joints. Microelectronic Engineering. 2010;87(11):2416-2422.
49. Şahin M, Çadırlı E. Mechanical, electrical, and thermal properties of the directionally solidified Bi-Zn-Al ternary eutectic alloy. International Journal of Minerals, Metallurgy, and Materials.
2014;21(10):999-1008.
50. Yan Y, Ding H, Kang Y, Song J. Microstructure evolution
and mechanical properties of Nb-Si based alloy processed
by electromagnetic cold crucible directional solidification. Materials & Design. 2014;55:450-455.
51. Jackson KA, Hunt JD. Lamellar and rod eutectic growth. Transactions of the Metallurgical Society of AIME. 1966;236:1129-1142.
52. Lee CC, Wang PJ, Kim JS. Are Intermetallics in Solder Joints
Really Brittle? In: Proceedings of the 57th Electronic Components
53. Liu CY, Hu YJ, Liu YS, Tseng HW, Huang TS, Lu CT, et al.
Epitaxial Cu-Sn bulk crystals grown by electric current. Acta
Materialia. 2013;61(15):5713-5719.
54. Frear DR, Burchett SN, Morgan HS, Lau JH. The Mechanics of
Solder Alloy Interconnects. New York: Van Nostrand Reinhold;
1994.
55. Ghosh G. Elastic properties, hardness, and indentation fracture toughness of intermetallics relevant to electronic packaging. Journal of Materials Research. 2004;19(5):1439-1454.
56. Hu X, Chen W, Wu B. Microstructure and tensile properties of Sn-1Cu lead-free solder alloy produced by directional solidification. Materials Science and Engineering: A.
2012;556:816-823.
57. Fan J, Li X, Su Y, Guo J, Fu H. Dependency of microhardness on solidification processing parameters and microstructure characteristics in the directionally solidified Ti-46Al-0.5W-0.5Si
alloy. Journal of Alloys and Compounds. 2010;504(1):60-64.
58. Hosch T, Napolitano RE. The effect of the flake to fiber
transition in silicon morphology on the tensile properties of Al-Si eutectic alloys. Materials Science and Engineering: A.
2010;528(1):226-232.
59. Çadırlı E, Sahin M, Turgut Y. Characterization of a directionally
solidified Sn-Pb-Sb ternary eutectic alloy. Metallography,
Microstructure, and Analysis. 2015;4(4):286-297.