www.biogeosciences.net/12/1/2015/ doi:10.5194/bg-12-1-2015
© Author(s) 2015. CC Attribution 3.0 License.
Spatiotemporal variations of nitrogen isotopic records
in the Arabian Sea
S.-J. Kao1, B.-Y. Wang1, L.-W. Zheng1, K. Selvaraj1, S.-C. Hsu2, X. H. Sean Wan1, M. Xu1, and C.-T. Arthur Chen3
1State Key Laboratory of Marine Environmental Science, Xiamen University, Xiamen, China 2Research Center for Environmental Changes, Academia Sinica, Taipei, Taiwan
3Department of Oceanography, National Sun Yat-sen University, Kaohsiung, Taiwan
Correspondence to:S.-J. Kao (sjkao@xmu.edu.cn)
Received: 3 May 2014 – Published in Biogeosciences Discuss.: 11 June 2014
Revised: 22 October 2014 – Accepted: 10 November 2014 – Published: 5 January 2015
Abstract.Available reports of dissolved oxygen,δ15N of ni-trate (δ15NNO3) andδ
15N of total nitrogen (δ15N
bulk) for trap
material and surface/downcore sediments from the Arabian Sea (AS) were synthesized to explore the AS’ past nitro-gen dynamics. Based on 25 µmol kg−1dissolved oxygen iso-pleth at a depth of 150 m, we classified all reported data into northern and southern groups. By usingδ15Nbulkof the
sed-iments, we obtained geographically distinctive bottom-depth effects for the northern and southern AS at different climate stages. After eliminating the bias caused by bottom depth, the modern-day sedimentaryδ15Nbulk values largely reflect
the δ15NNO3 supply from the bottom of the euphotic zone. Additionally to the data set, nitrogen and carbon contents vs. their isotopic compositions of a sediment core (SK177/11) collected from the most southeastern part of the AS were measured for comparison. We found a one-step increase in δ15Nbulkstarting at the deglaciation with a corresponding
de-crease in δ13CTOCsimilar to reports elsewhere revealing a
global coherence. By synthesizing and reanalyzing all re-ported down core δ15Nbulk, we derived bottom-depth
cor-rection factors at different climate stages, respectively, for the northern and southern AS. The diffusive sedimentary δ15Nbulkvalues in compiled cores became confined after bias
correction revealing a more consistent pattern except recent 6 ka. Such high similarity to the global temporal pattern indi-cates that the nitrogen cycle in the entire AS had responded to opocean changes until 6 ka BP. Since 6 ka BP, further en-hanced denitrification (i.e., increase inδ15Nbulk) in the
north-ern AS had occurred and was likely driven by monsoon, while, in the southern AS, we observed a synchronous re-duction inδ15Nbulk, implying that nitrogen fixation was
pro-moted correspondingly as the intensification of local denitri-fication at the northern AS basin.
1 Introduction
Biogeochemical processes of nitrogen in the ocean are in-timately related to various elemental cycles (synergistically modulate atmospheric CO2and N2O concentrations), hence
the feedback on the climate being on a millennial time scale (Gruber, 2004; Falkowski and Godfrey, 2008; Altabet et al., 2002). Though oxygen deficient zones (ODZs) occupy only
∼4 % of ocean volume, the denitrification process therein
contributes remarkably to the losses of nitrate, leaving excess P in the remaining water mass to stimulate N2fixation while
entering the euphotic zone (Morrison et al., 1998; Deutsch et al., 2007) and thus controlling the budget of bioavailable nitrogen in ocean. Denitrification leaves15NO−3 in residual nitrate (Sigman et al., 2001), whereas N2fixation introduces
new bioavailable nitrogen with lowδ15N values (Capone et al., 1997) into ocean for compensation. The Arabian Sea (AS) – one of the three largest ODZs in the world ocean with distinctive monsoon driven upwelling – accounts for at least one-third of the loss of marine fixed nitrogen (Codispoti and Christensen, 1985) playing an important role in the past climate via regulating atmospheric N2O concentration
(Ag-nihotri et al., 2006) or nitrogen inventory to modulate CO2
Nitrogen isotope compositions of sedimentary organic mat-ter potentially reflect biological processes in wamat-ter columns, such as denitrification (Altabet et al., 1995; Ganeshram et al., 1995, 2000), nitrogen fixation (Haug et al., 1998), and the degree of nitrate utilization by algae (Altabet and Francois, 1994; Holmes et al., 1996; Robinson et al., 2004). However, alteration may occur (through various ways or processes; e.g., diagenesis) before the signal of δ15N of exported pro-duction is buried.
Previous measurements ofδ15Nbulk in various cores and
surface sediments in the AS showed the following points: (1) near-surface NO−3 in the AS is completely utilized in an an-nual cycle, resulting in small isotopic fractionation between δ15N of exported sinking particles andδ15N of NO−3 supplied to the euphotic zone (Altabet, 1988; Thunell et al., 2004); (2) monsoon-driven surface productivity and associated oxidant demand were regarded as the main control on water column denitrification in the past (Ganeshram et al., 2000; Ivanochko et al., 2005); (3) sedimentaryδ15Nbulkprimarily reflects the
relative intensity of water column denitrification in this area (Altabet et al., 1995, 1999); (4) oxygen supply at interme-diate depth by the Antarctic intermeinterme-diate waters (AAIWs) can modulate the denitrification intensity in the northern AS (Schulte et al., 1999; Schmittner et al., 2007; Pichevin et al., 2007). Among previous research, the geographical features in sedimentaryδ15Nbulkbetween the north and south basins
of the AS have not been discussed, particularly on the ba-sis of bottom-depth effect, which might be different during glacial and interglacial periods.
In this study, a sediment core (SK177/11) collected from the slope of the southeastern AS was measured for organic C and N contents and their stable isotopes. We synthesized previous hydrographical and isotopic data, such as dissolved oxygen (DO),N∗(N∗=NO−
316×PO 3−
4 +2.9; Gruber and
Sarmiento, 2002), andδ15N of nitrate, as well as trapped ma-terial and surface/downcore sediments, among which surface and downcore sediments may have experienced more inten-sified diagenetic alteration. Based on the subsurface of a DO concentration of 25 µmol kg−1 isopleth at 150 m, the data
sets in the AS were separated into north and south basins by time span (glacial, Holocene and modern) for compari-son. We aim to (1) investigate the geographic and glacial– interglacial differences in bottom-depth effect and to (2) re-trieve extra information from sedimentary δ15Nbulk by
re-moving basin/climate stage specific bottom-depth effects, thus better deciphering the environmental history of the Ara-bian Sea.
2 Study area
The Arabian Sea is characterized by seasonal rever-sal of monsoon winds, resulting in large seasonal phys-ical/hydrographic/biological/chemical variations in water columns (Nair et al., 1989). Cold and dry northeasterly winds
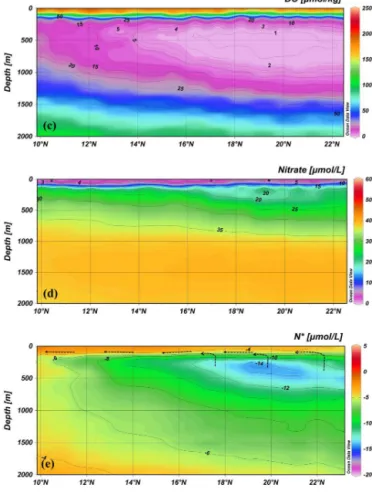
Figure 1. (a)Map of the Arabian Sea. Dissolved oxygen (DO) con-centration at 150 m (World Ocean Atlas 09) was shown in color contour. Southern (⋆) and northern (•) categories of available cores and SK177/11, in this study, were defined by DO of 25 µmol kg−1 (see text; purple dash curve).(b)Bathymetric map superimposed by core locations;(c),(d)and(e)are DO, nitrate andN∗transects (yellow dashed line in(a), online data originated from cruises of JGOFS in 1995), respectively, for upper 2000 m.(f)N∗transect for the upper 300 m with arrows revealing the flow direction. In(a), the northern cores include core MD-04-2876 (828 m; Pichevin et al., 2007), core NIOP455 vs. NIOP464 (1002 m vs. 1470 m; Reichart et al., 1998), SO90-111KL vs. ME33-NAST(775 m vs. 3170 m; Suth-hof et al., 2001), ODP724C vs. ME33-EAST (603 m vs. 3820 m; Möbius et al., 2011), RC27-24 vs. RC27-61 (1416 m vs. 1893 m; Altabet et al., 1995), ODP723, ODP722(B) vs. V34-101 (808 m, 2028 m vs. 3038 m; Altabet et al., 1999), RC27-14 vs. RC27-23 (596 m vs. 820 m; Altabet et al., 2002), GC08 (2500 m; Banakar et al., 2005), MD-76-131 (1230 m; Ganeshram et al., 2000); the south-ern cores include core SO42-74KL (3212 m; Suthhof et al., 2001), NIOP905 (1586 m; Ivanochko et al., 2005) and SK177/11 (776 m; this study).
Table 1.Accelerator mass spectrometry (AMS)14C dates of sediment core SK177/11. Radiocarbon ages were calibrated using the CALIB 6.0 program (http://calib.qub.ac.uk/calib/calib.html, Reimer et al., 2009).
Lab code Depth Dating pMC Raw14C age Calibrated age δ13C (‰)
cm materials (yr BP) (yr BP) (1σ)
KIA24386 58 OM 65.58±0.17 3390±20 3186±24 −18.55±0.04
KIA26327 125 OM 46.65±0.20 6125±35 6504±26 −20.02±0.10
KIA24387 155 OM 31.38±0.13 9310±30 10054±104 −19.50±0.08
KIA26328 175 OM 21.96±0.12 12180±45 13618±104 −17.71±0.18
KIA24388 205 OM 13.94±0.11 15830±60 18646±54 −21.65±0.15
KIA24389 275 OM 9.81±0.12 18650+100(−90) 21774±194 −18.02±0.10
KIA26329 355 OM 2.76±0.06 28830±180 32857±207 −19.23±0.17
OM – organic matter; pMC – percent modern.
Figure 1.Continued.
precipitationmaximum. In the present day, the SW monsoon is much stronger than its northeastern counterpart.
The spatial distribution of DO at a depth of 150 m for the AS is shown in Fig. 1a (World Ocean Atlas 2009, http:// www.nodc.noaa.gov/OC5/WOA09/woa09data.html), which shows a clear southwardly increasing pattern with DO hav-ing increased from ∼5 to>100 µmol kg−1, and the lowest DO value appears northeast of the northern basin. As
den-Figure 1.Continued.
itrification, the dominant nitrate removal process generally occurs in the water column, where DO concentration ranges from 0.7 to 20 µmol kg−1 (Paulmier et al., 2009). The
in-tensity of denitrification was reported to descend gradually, corresponding to the DO spatial pattern from the northern to the southern parts of the AS, and did not become obvi-ous at 11 or 12◦N (Naqvi et al., 1982). As indicated by the upper 2000 m N–S transect of DO (Fig. 1c), a southwardly decrease in ODZ thickness can be observed and the contour line of 5 µmol kg−1 extends to around 13◦N. Since the ni-trate source is mainly from the bottom of the euphotic zone at around 150 m, we postulate a geographically distinctive sedimentaryδ15Nbulkunderneath ODZs. Thus, an isopleth of
25 µmol kg−1DO at 150 m is applied as a geographic
bound-ary to separate the northern from the southern part of the AS basin. The interface where DO concentration changed from 20 to 30 µmol kg−1was such a transition zone. On the
other hand, the bottom layer of the ODZ moves shallower to-ward the south, as shown previously by Gouretski and Kolter-mann (2004). Accordingly, the bottom oxygen content may also be a factor to influence the degree of alteration in sedi-mentaryδ15Nbulk.
As mentioned in the introduction, nitrate is removed via denitrification in ODZs resulting in excess P to stimulate N2
Figure 2. (a)Plot of calendar age against depth;(b)Linear sedi-mentation rate (indicates the14C age controlling points).
(Fig. 1d), as mentioned earlier, near-surface NO−3 in the AS is completely utilized in an annual cycle (Altabet, 1988; Thunell et al., 2004). Furthermore, negativeN∗ (P excess) throughout the water column represents a nitrate deficit, and the lowestN∗value appears at∼300 m at 18–20◦N, where DO is<1 µmol kg−1. Meanwhile, a gradual southwardly in-crease inN∗can be observed for upper 100 m (Fig. 1f) and the isopleth ofN∗of−4 deepens southward with the highest
N∗ (−2) appearing at ∼10–12◦N. The volume expansion
of highN∗water, as well as a simultaneous increase inN∗, strongly indicate an addition of bioavailable nitrogen when surface water is traveling southward.
3 Material and method
A sediment gravity core, SK177/11 (8.2◦N and 76.47◦E),
was collected at water depths of 776 m on the continental slope off the southwest coast of India (Kerala) during the 177th cruise ofORV SagarKanyain October 2002. Although the core MD77-191 locates further south in the AS (Bassinot et al., 2012), SK177/11 is, so far, the southernmost core with reference to δ15N record. The 3.65 m long core was sub-sampled at interval of 2 cm for upper 1 m and of 5 cm for the rest (open circles in Fig. 2a). There is a distinct boundary at∼1.7 m, above which the core consists mainly of brownish
gray clayey sediments. Neither distinct laminations nor
tur-Figure 3.Temporal variations of(a)stable isotopic compositions of bulk nitrogen (δ15N);(b)stable isotopic compositions of total organic carbon (TOC) (δ13C);(c)contents of total nitrogen;(d) to-tal organic carbon;(e)TOC / TN ratio. Horizontal dashed lines are references for low value periods.
bidities can be observed by visual contact immediately after collection or at the time during sub-sampling (Pandarinath et al., 2007). All sub-samples were freeze-dried and ground into powder in an agate mortar with pestle. Sand was almost absent (<1 wt %) throughout the core.
Bulk sedimentary nitrogen content and δ15N analyses were carried out using a Carlo-Erba EA 2100 elemental an-alyzer connected to a Thermo Finnigan Delta V Advantage isotope ratio mass spectrometer (EA-IRMS). Sediments for TOC analyses were acid-treated with 1N HCl for 16 h, and then centrifuged to remove carbonate. The acid-treated sedi-ments were further dried at 60◦C for TOC content andδ13C. The nitrogen isotopic compositions of acidified samples were obtained at the same time for comparison. Carbon and ni-trogen isotopic data were presented by standard δ notation with respect to PDB (Pee Dee Belemnite) carbon and at-mospheric nitrogen. USGS 40, which has certified δ13C of
−26.24 andδ15N of−4.52 ‰ and acetanilide (Merck) with δ13C of−29.76 andδ15N of −1.52 ‰ were used as work-ing standards. The reproducibility of carbon and nitrogen iso-topic measurements is better than 0.15 ‰ . The precision of nitrogen and carbon content measurements were better than 0.02 and 0.05 %, respectively. Meanwhile, the acidified and non-acidified samples exhibited identical patterns in δ15N (not shown) with mean deviation of 0.3 ‰.
4 Results
4.1 Sedimentation rate
The age–depth curve was shown in Fig. 2a, in which age dates were evenly distributed throughout the core, although not at a high resolution. In Mollenhauer et al. (2005), the largest age offset between total organic carbon and co-occurring foraminifera is ∼3000 years and mostly<2000 years. Meanwhile, the offset remains more or less constant throughout past 20 ka, regardless of the deglacial transition. The youngest date in our core is 3180 cal ka BP at 58 cm. We may expect younger age on the surface. Thus, if our TOC samples contain any pre-aged organics, as indicated by Mol-lenhauer et al. (2005), the offset should not be too large to alter our interpretation for the comparison between glacial and Holocene periods. The linear sedimentation rates de-rived from seven date intervals range from 6 to 20 cm ka−1 (Fig. 2b), with relatively constant value (∼6 cm ka−1) prior
to Holocene, except for the excursion around the last glacial maximum. The linear sedimentation rates started to increase since Holocene and reached 18–20 cm ka−1 when the sea
level reached modern-day level.
4.2 Nitrogen and carbon contents and their isotopes Values of δ15Nbulk ranged from 4.7 to 7.1 ‰ with
signifi-cantly lower values during the glacial period (Fig. 3a). The δ15N values increased rapidly since∼19 ka BP, with a peak
at ∼15 ka BP, and then started to decrease gradually
to-ward the modern day, except for the low δ15N excursion at
∼14 ka BP. Figure 3b shows that values ofδ13CTOC(−21.5
to−18.5 ‰) were consistent with theδ13C of typical marine organic matter end member (−22 to−18 ‰; Meyers, 1997).
Figure 4.Scatter plot of the total organic carbon content against total nitrogen. Redfield field ratio of 5.68 is shown in line. Bold dashed line stands for regression. Red, purple, green and blue dots represent the late Holocene, early Holocene, deglacial and glacial periods, respectively.
An abrupt decrease inδ13C was observed in concert with the dramatic increase inδ15Nbulkat the start of deglaciation.
Bulk nitrogen content (TN) had a range of 0.23–0.75 % (Fig. 3c), and the TOC content ranged from 2.2 to 5.5 % (Fig. 3d). Both TN and TOC showed similar trends over the last 35 ka BP with relatively constant values prior to Holocene and an afterward elevation until the modern day. The upward increasing TOC and TN patterns since Holocene were consistent with the increasing pattern of the sedimenta-tion rate, suggesting a higher organic burial flux induced by enhanced productivity, which had been reported elsewhere in the AS (Altabet et al., 2002).
As for the TOC / TN ratio, higher values appeared dur-ing the deglacial transition and the glacial period (Fig. 3e). The highest value coincides with theδ13CTOCdrop,
Figure 4 shows the scatter plot of TOC against TN. The slope of the linear regression line for TOC against TN (TOC=(6.67±0.22)×TN+(0.99±0.11),R2=0.94,n=
57, p <0.0001) is 6.67, again indicating that organic mat-ter is mainly marine-sourced. Although this slope is slightly higher than the Redfield ratio of 5.68 (wt / wt), it is lower than that observed on the East China Sea shelf (7.46; Kao et al., 2003). Meanwhile, the intercept of TN is negative when TOC downs to zero, implying that inorganic nitrogen can be ignored in our core. Obviously, if we force the regression through the origin point, TOC / TN values for samples dur-ing the Holocene will have the lower ratios reflectdur-ing even less contribution from terrestrial organics.
5 Discussion
5.1 Downward transfer and transformation of N isotopic signal
As mentioned, the signal of sedimentary δ15N may be al-tered under different burial conditions. Altabet and Fran-cois (1994) reported little diagenetic alteration of the near-surfaceδ15N in the equatorial Pacific, while there was an ap-parent +5 ‰ enrichment relative to sinking particles in the
Southern Ocean, south of the polar front. In the Sargasso Sea, sedimentaryδ15N also enriched by 3–6 ‰ relative to sinking particles (Altabet et al., 2002; Gruber and Galloway, 2008). The degree of alteration was attributed to particle sinking rate and organic matter (OM) preservation (Altabet, 1988). Gaye-Haake et al. (2005) also suggested that low sedimen-tation rates benefit organic matter decomposition, resulting in a positive shift in bulk sedimentary δ15N comparing to sinking particles in the South China Sea. Finally, Robinson et al. (2012) concluded that oxygen exposure time at the seafloor is the dominant factor controlling the extent of N isotopic alteration. Thus, it is necessary to follow the track of δ15N signal to clarify the occurrence of deviation during transfer.
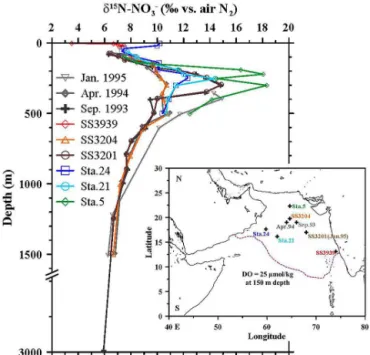
The reported depth profiles of δ15NNO3 in the AS were shown in Fig. 5, in which δ15NNO3 values of water depth deeper than 1200 m range narrowly around 6–7 ‰, which is slightly higher than the global average of the deep oceans ((4.8±0.2) ‰ for >2500 m, Sigman et al., 2000; (5.7±0.7) ‰ for >1500 m, Liu and Kaplan, 1989). Be-low the euphotic layer, δ15NNO3 increases, rapidly peaking at around 200–400 m. The preferential removal of 14NO3
by water column denitrification accounts for these subsur-face δ15NNO3 highs (Brandes et al., 1998; Altabet et al., 1999; Naqvi et al., 2006). The subsurface δ15NNO3 maxi-mum ranges from 10 to 18 ‰ for different stations, imply-ing a great spatial heterogeneity in water columns denitrifi-cation intensity. It is worth mentioning that higher values, in general, appear in the northeastern AS (15∼18 ‰) (Fig. 5),
highlighting that the focal area of water column
denitrifi-Figure 5.Depth profiles of nitrogen isotope of nitrate (δ15NNO3) in
water columns; data not marked are all from August; the location of Station January 1995 overlaps with Station SS3201 (data digitized from Brandes et al., 1998; Altabet et al., 1999; Naqvi et al., 2006).
cation is prone to the northeastern Arabian Sea (Naqvi et al., 1994; Pichevin et al., 2007), also revealed by the DO spatial distribution (Fig. 1a). Contrary to higher denitrifica-tion in the northeastern AS, the export producdenitrifica-tion is always higher in the northwestern AS throughout a year (Rixen et al., 1996). Such decoupling between productivity and den-itrification was attributed to the oxygen supply by interme-diate water exchange besides primary productivity oxygen demand (Pichevin et al., 2007). Note that theδ15NNO3 val-ues at a water depth of 100–150 m, which correspond to the bottom depth of the euphotic zone (Olson et al., 1993), from different stations fall within a narrow range of 7–9 ‰ de-spite wide denitrification intensity underneath. The rapid ad-dition of new nitrogen, as mentioned earlier, might account for the relatively uniformδ15NNO3 at the bottom of the eu-photic layer. Unfortunately, there are noδ15NNO3 profiles or sediment trap data from the southern basin for comparison.
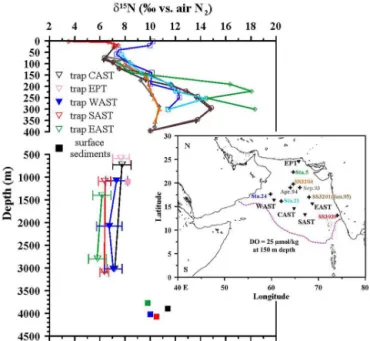
Interestingly, reportedδ15N of sinking particles (δ15NSP)
water column, as indicated by Altabet (2006). Only these five trap stations with nitrogen isotope information were avail-able in the AS (Gaye-Haaake et al., 2005). The trap locations were in the same area but not as far south compared to the δ15NNO3 stations (insert map in Fig. 6). The slightly lower δ15N in sinking particles is attributable to their geographic locations (see below), since incomplete relative utilization of surface nitrate has been documented to have a very limited imprint on the δ15N signal in the AS (e.g., Schäfer and It-tekkot, 1993).
The uniformly low values ofδ15NNO3 at the bottom of the euphotic zone should be a consequence resulting from vari-ous processes in the euphotic zone, such as remineralization, nitrification and N2 fixation. Nevertheless, the distribution
pattern ofN∗(Figs. 1e and f) illustrates that there must be an addition of14NO3into the system to cancel out the isotopic
enrichment caused by denitrification. Note that the positive offset inδ15NNO3 (1δ
15N
NO3, 6∼12 ‰) in ODZs caused by various degrees of denitrification was narrowed down signif-icantly, while nitrate was transported upward. This implies that a certain degree of addition processes, most likely the N2
fixation, varied in concert with the intensity of denitrification underneath. Since the upwelling zones distribute at the very north and the west of the AS and the upwelled water travels southward (or outward) on the surface, as shown in Fig. 1e, it is reasonable to see the phenomenon of denitrification-induced N2 fixation to compensate the nitrogen deficiency.
Consistent to this notion, Deutsch et al. (2007) discovered the spatial coupling between denitrification in eastern tropical Pacific (upstream) and N2fixation in western equatorial
Pa-cific (downstream). Such a horizontal nitrogen addition pro-cess can also be seen clearly in our background information ofN∗(Fig. 1f). In fact, fixed N had been proved to account for a significant part of surface nitrate in the modern-day AS, where denitrification is exceptionally intense (Brandes et al., 1998; Capone et al., 1998; Parab et al., 2012).
Compared with reported δ15N of surface sediments re-trieved from trap locations, a significant positive shift inδ15N can be seen at the seafloor (Fig. 6). Such a positive devia-tion can be seen elsewhere in previous reports (Altabet, 1988; Brummer et al., 2002; Kienast et al., 2005) due to prolonged oxygen exposure after deposition (Robinsson et al., 2012) as-sociated with sedimentation rate (Pichevin et al., 2007). Al-though Cowie et al. (2009) found an ambiguous relation be-tween contents of sedimentary organic carbon and oxygen in deep water, they also noticed the appearance of maximum or-ganic carbon contents at the lower boundary of ODZs, where oxygen content was relatively higher. Accordingly, they be-lieved that other factors controlling the preservation of or-ganic carbon existed, such as the chemical characteristics of organic matter, the interaction between organic matters and minerals, the enrichment and activity of benthic organism or the physical factor, including the screening and water dy-namic effect.
Figure 6.Vertical profiles for nitrogen isotope of nitrate (crosses in inserted map), sinking particles (inverse triangles in map) and trap-corresponding surface sediments. Data for sediment traps and surface sediments are from Gaye-Haake et al. (2005). Depth profile ofδ15NNO3follows that in Fig. 5.
5.2 Geographically distinctive bottom-depth effects in the modern day
As classified by oxygen content of 25 µmol kg−1 at 150 m,
the documented surface sedimentaryδ15Nbulk (Gaye-Haake
et al., 2005) was separated into northern and southern groups to examine the geographic difference in bottom-depth effect. Both groups exhibit positive linear relationships between δ15Nbulk and bottom depth (deeper than 200 m) (Fig. 7a).
The regression equations were shown in Table 2. Interest-ingly, the regressions generally differ statistically from each other in terms of slope and intercept. The slope represents the degree of positive shift of sedimentary δ15N due to bottom-depth effect. For the southern AS, the slope is (0.76 (±0.14)×10−3km−1), which is close to the correction
fac-tor (0.75×10⁻³km−1) for the world ocean, proposed by
Robinson et al. (2012) and further applied by Galbraith et al. (2012). By contrast, the slope for the northern AS is sig-nificantly lower (0.55 (±0.08)×10−3km−1), implying that
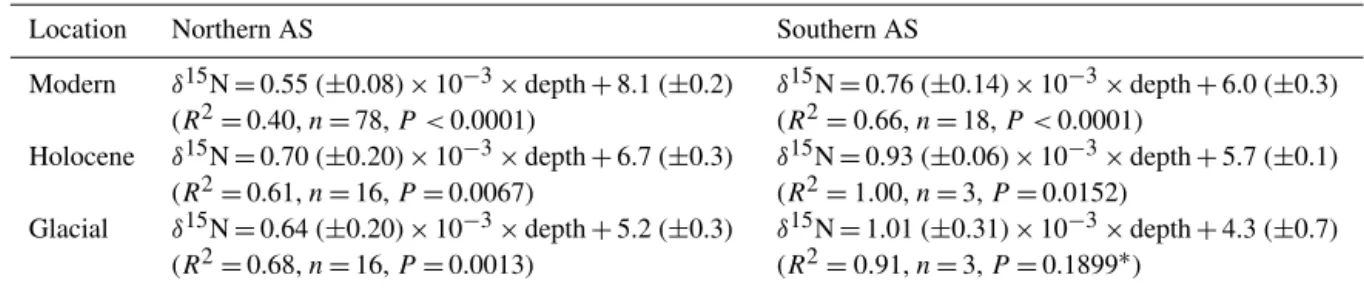
Table 2.Linear equations of bottom-depth effect during different climate stages.
Location Northern AS Southern AS
Modern δ15N=0.55 (±0.08)×10−3×depth+8.1 (±0.2) δ15N=0.76 (±0.14)×10−3×depth+6.0 (±0.3) (R2=0.40,n=78,P <0.0001) (R2=0.66,n=18,P <0.0001)
Holocene δ15N=0.70 (±0.20)×10−3×depth+6.7 (±0.3) δ15N=0.93 (±0.06)×10−3×depth+5.7 (±0.1)
(R2=0.61,n=16,P=0.0067) (R2=1.00,n=3,P=0.0152)
Glacial δ15N=0.64 (±0.20)×10−3×depth+5.2 (±0.3) δ15N=1.01 (±0.31)×10−3×depth+4.3 (±0.7) (R2=0.68,n=16,P=0.0013) (R2=0.91,n=3,P=0.1899∗)
∗Insignificant byPvalue.
oxygen contents, as indicated by previous research (Olson et al., 1993; Morrison et al., 1999; Brummer et al., 2002).
On the other hand, the intercept for the northern AS re-gression (8.1±0.2) is significantly higher than that for the
southern AS (6.0±0.3). As mentioned above,δ15N values of sinking particle resembled theδ15N of nitrate sourced from a depth of 100–150 m. According to the depth-dependent correction factor, we may convert sedimentaryδ15Nbulk
val-ues at various water depths into their initial condition when the digenetic alteration is minimal to represent the δ15N of source nitrate. Higher intercept suggests that a stronger den-itrification had occurred in northern AS surface sediments. The 2.1 ‰ lower intercept in the southern AS likely reflects the addition of N2fixation in the upper water column while it
travels southward. The progressive increase ofN∗toward the southern AS supports our speculation, although noδ15NNO3 profiles had been published in the southern basin. Future works about δ15NNO3 and δ
15N
SP in the southern AS are
needed.
In Fig. 7b, we presented correctedδ15Nbulk values along
with bottom depth for the northern and southern AS surface sediments for comparison. After removing site-specific bias caused by bottom-depth effect, the values and distribution ranges ofδ15Nbulkfor both the northern and southern AS
be-came smaller and narrower. For the northern AS, the distri-bution pattern skewed negatively, giving a standard deviation of 0.88 ‰, falling exactly in the range of 7–9 ‰ forδ15NNO3 (7–9 ‰) at the bottom of the euphotic zone. As a result, the corrected nitrogen isotopic signals in sediments more truth-fully represent theδ15NNO3 value at the bottom depth of the euphotic zone. Meanwhile, the statistically significant differ-ence inδ15Nbulkdistribution between the northern and
south-ern AS further confirms the feasibility of our classification by using DO isopleth of 25 µmol kg−1at 150 m.
5.3 Bottom-depth effect during different climate stages
In order to better decipher the history ofδ15NNO3in the bot-tom the euphotic zone of the water column, we synthesized almost all available δ15Nbulkof sediment cores reported for
the AS (see Figs. 1a and 1b for locations). Similar to mod-ern surface sediments, northmod-ern and southmod-ern groups were
Figure 7. (a)Non-correctedδ15N values of modern surface sed-iments against corresponding bottom depth in the northern and southern Arabian Sea (see text for N–S boundary). Regression lines were shown in dashed and solid lines, respectively, for the northern and southern AS.(b)Corrected surface sedimentaryδ15N values against water depth.
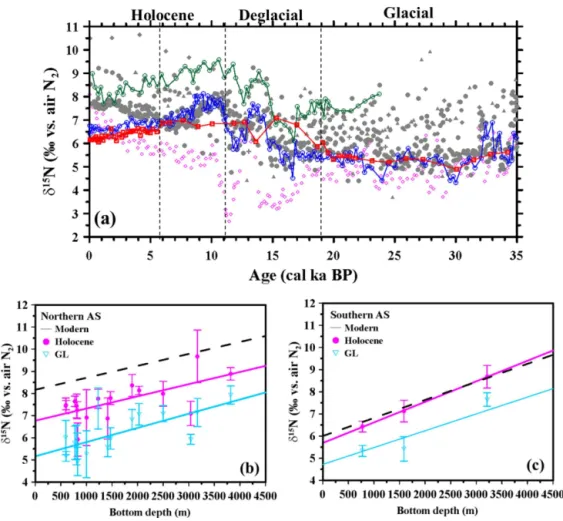
Figure 8. (a)Temporal variations of non-correctedδ15Nbulkvalues of all reported cores in the AS. Data shown in curves are for cores in the southern Arabian Sea (red for SK177/11, blue for NIOP 905 and green for SO42-74KL), dots in gray are for the northern part and pink dots are for core MD-04-2876. Mean values ofδ15N for fixed periods against corresponding water depths for cores in the(b)northern and(c)
southern Arabian Sea. Pink and indigo blue are for the Holocene and glacial periods, respectively. Error bars represent the standard deviation for meanδ15Nbulk.The dashed regression lines for modern surface sediments are shown for reference.
35 ka (Fig. 8a). Unfortunately, data points were less in 0–6 ka and there were only three sediment cores in the southern AS: SK177/11 in this study, and NIOP 905 and SO42-74KL in previous studies.
As shown in Fig. 8a, the originalδ15Nbulkfrom the
north-ern (gray dots) and southnorth-ern AS (green, blue and red curves) scatter in a wide range from 4.5 to 10.5 ‰ over the entire 35 ka. The pink dots are for the data from core MD-04-2876, which is peculiar since the relatively lowδ15Nbulkvalues
de-viated from all other reports in the northern AS. Pichevin et al. (2007) excluded the influences from incomplete nitrate utilization and terrestrial input, thus we still include this core in our statistical analyses. As for the southern cores, the tem-poral variations ofδ15Nbulkin core SK177/11 and NIOP 905
(red and blue) had a very similar trend distributing at the lower bound of the whole data set. The meanδ15Nbulkvalues
for SK177/11 and NIOP 905 during the glacial period were almost identical, and the deviation in the Holocene was as small as 0.7 ‰. By contrast, the temporal pattern forδ15Nbulk
of core SO42-74KL (green) resembles that of NIOP 905, yet with an enrichment in15N by∼2 ‰ for the entire period.
The core SO42-74KL is retrieved from a depth of 3212 m, which is the deepest of the three cores in the southern AS; the positive offset is apparently caused by the bottom-depth effect. Thus, inference should be made with caution when compare sediment cores from different depths.
Below we consider two time spans – 0∼11 ka (Holocene) and 19∼35 ka (glacial) – to examine the bottom-depth ef-fect at different climate stages. We ignore the transgression period, which is shorter with more variable inδ15Nbulk, to
avoid bias caused by dating uncertainties in different studies. Also, we will discuss the peculiar patters for 0–6 ka later. The mean and standard deviation of reportedδ15Nbulkvalues for
(Re-ichart et al., 1998; Altabet et al., 1999) is ignored. The re-gression curves for the modern day (dashed lines) were plot-ted for comparison.
The difference among regressions of three climate stages in the northern AS (Table 2) is not significant (0.55×10⁻³km−1to 0.70×10⁻³km−1). However, the
re-gression slopes for the northern AS are significantly lower compared with those obtained from the southern AS for all climate states. This might indicate that the oxygen content in the northern AS is always lower, resulting in a lower degree of alteration ofδ15Nbulk. On the other hand, we may not
ex-clude the effect by sedimentation rate changes over these two stages, which also affect the oxygen exposure time; unfor-tunately, insufficient sedimentation rate data in the northern AS in previous reports prevent us from implementing further analysis.
As for the southern AS, correction factors are always higher than those in the northern AS. The overall spatial– temporal patterns are consistent with the oxygen distribu-tion in the Arabian Sea (Olson et al., 1993; Morrison et al., 1999; Pichevin et al., 2007) and agree with the view that DO concentration was the dominant factor for organic mat-ter preservation (Aller, 2001; Zonneveld et al., 2010). Mean-while, the regression slopes remained high from 0.76×10⁻³
to 1.01×10⁻³km−1 over different climate stages in the
southern AS, suggesting that environmental situations, and thus those correction factor, change less relatively to that in the northern AS. For SK177/11, the sedimentation rate in Holocene is two-fold higher compared to that in the glacial period. However, the influence caused by the sedimentation rate changes is likely not significant enough to alter the re-gression slopes for the southern AS, based on the small changes in the slope (0.93×10⁻³and 1.01×10⁻³km−1).
5.4 Insights from temporal changes in geographic
δ15N
bulkdistribution
Based on the earlier comparison among δ15NNO3, sinking particles and surface sediments, we recognized that the re-gression intercept is representative of the nitrogen isotope of nitrate source at a depth of 100 m. Therefore, the regression-derived intercepts given in Table 2 can be used to infer the δ15NNO3 source at different climate stages, while the slopes can be used as correction factors to eliminate the positive shift inδ15Nbulkcaused by bottom depth; by doing this, we
can get the original signal ofδ15Nbulkprior to alteration. We
applied the correction factor to be equal to (bottom depth
−100 m)×slope, ignoring the sea level changes during the different climate stages.
Noticeably, the regression intercepts for both the north-ern and southnorth-ern AS are higher in the Holocene compared to those in the glacial period, indicating the intensified iso-topic enrichment inδ15NNO3 in the entire AS in Holocene. Such increment is almost the same to be∼1.5 ‰, which is
similar to the increase in the eastern tropical North Pacific,
but slightly smaller than that in the eastern tropical South Pa-cific (Galbraith et al., 2012). The 120 m sea level increase, which may induce only a 0.1 ‰ offset, cannot be the reason for such a significant increase of averageδ15Nbulkduring the
Holocene. Moreover, deviations between the northern and southern AS at the respective climate stage are almost iden-tical (1.0 ‰ for Holocene and 0.9 ‰ for glacial), indicating a synchronous shift in the relative intensity of denitrification and N2fixation over the basin to keep such a constant
latitu-dinal gradient of subsurfaceδ15NNO3.
The intermediate water formation near the polar region controls the oxygen supply to the intermediate water and thus the extent of denitrification on global scale and the stoichiometry of nutrient source to the euphotic zone (Gal-braith et al., 2004). Lower glacial-stage sea surface tempera-ture may increase oxygen solubility, while stronger winds in high-latitude regions enhance the rate of thermocline venti-lation. The resultant colder and rapidly flushed thermocline thus lessened the spatial extent of denitrification and, conse-quently, N fixation (Galbraith et al., 2004). Therefore, such a basin of wide synchronous increase inδ15Nbulkis likely a
global control. The lower intercepts in glacial time (4.3 ‰ for the south and 5.3 ‰ for the north), which are similar to the global meanδ15NNO3 (4.5–5 ‰, Sigman et al., 1997), illus-trate a better ventilation of intermediate water during glacial time in the Arabian Sea (Pichevin et al., 2007). In fact, the AAIWs penetrate further northward over 5◦N in the present
day and even during the late Holocene (You, 1998; Pichevin et al., 2007). Since theδ13C of autochthonous particulate or-ganic carbon is negatively correlated to [CO2(aq)] in the
eu-photic zone (Rau et al., 1991), the sharp decrease ofδ13CTOC
in SK177/11 at the start of deglaciation (Fig. 3b) may in-fer the timing of a rapid accumulation of dissolved inorganic carbon driven by the shrinking of oxygenated intermediate water (Pichevin et al., 2007) or enhanced monsoon-driven upwelling (Ganeshram et al., 2000); both facilitate the pro-motion of denitrification. Nevertheless, the mirror image be-tweenδ15N andδ13CTOCpro?les revealed their intimate
re-lation, of which the variability was attributable to the change of physical processes.
The intercepts of the northern AS increase continuously from 5.2 to 8.1 from glacial through to modern day, indicat-ing the strengthened intensity of denitrification relative to ni-trogen fixation in the northern AS (Altabet, 2007). When we take a close look at the temporal pattern of correctedδ15Nbulk
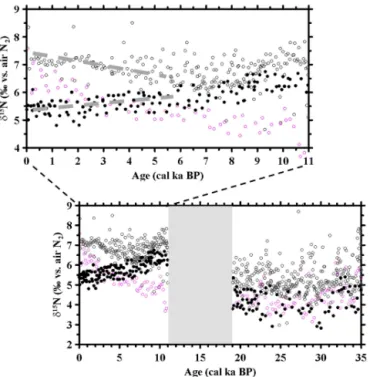
for long cores (Fig. 9), we can see an amplified deviation since 6 ka, during whichδ15Nbulkincreases continuously in
the northern AS, whereas it decreases in the southern AS. Note that the northern most core, MD-04-2876, also followed the increasing trend in recent 6 ka even though itsδ15Nbulk
Figure 9.Temporal variations of correctedδ15Nbulkvalues of all reported cores in the AS. Gray and black dots are for the northern and southern AS, respectively. Pink dots are specifically for core MD-04-2876. The deglacial period is in shadow because non proper equations for bottom-depth effect correction. The upper panel is the blow-up for the Holocene period. The intensified deviation trends since 6 ka were marked by bold dashed lines.
Besides the oxygen supply to the intermediate water, the intensity of water column denitrification varies with primary productivity (Altabet, 2006; Naqvi et al., 2006). Strong summer monsoon and winter monsoon drive up-welling or convective mixing enhances primary productivity, which, in turn, intensifies denitrification (Altabet et al., 2002; Ganeshram et al., 2002). However, it was also reported that primary productivity did not correlate well with water col-umn denitrification underneath during the Holocene in some parts of the northern AS (Banakar et al., 2005, and refer-ences therein). Regardless of the declining summer monsoon strength since 5500 ka (Hong et al., 2003), primary produc-tivity in the northern AS seemed to have increased. Similar to the patterns observed for TOC and TN in this study, produc-tivity indicators (TOC and Ba / Al ratios), reported by Rao et al. (2010) in the core SK148/4 located near our SK177/11, also increased gradually since the Holocene. Incomplete ni-trate consumption can hardly explain the decreasing pattern for all three cores in the southern AS, where upwelling in-tensity is much less relative to that in the north. Moreover, lower TOC / TN ratios observed in Holocene in SK177/11, as mentioned earlier, rule out the influence of terrestrial or-ganic input. Therefore, a spatial coupling of denitrification-dependent N2fixation is the more plausible cause of the
de-creasingδ15Nbulkpattern (Deutsch et al., 2007).
We suggested that the intensified supply of excess phos-phorous (phosphorus in stoichiometric excess of fixed nitro-gen) toward the southern AS to stimulate N2 fixation,
sub-sequently responsible for the decreasingδ15Nbulkpattern in
the southern basin. The intensification in excess phosphorous supply can be driven by enhanced upwelling or intensified subsurface water column denitrification or both. According to the increasing pattern inδ15Nbulkand primary
productiv-ity in the northern AS, synergetic processes are suggested. The upwelled water in the northern AS basin brings up low N / P water to the surface for non-diazotrophs to uptake. If we assume complete consumption, the remaining excess phos-phorous after complete consumption will be transported to-ward the south by clockwise surface circulation and advec-tion. Therefore, N2fixation in the southern AS acts as
feed-back to balance denitrification changes in the northern AS. This phenomenon is similar to the illustration for the spatial coupling of nitrogen inputs and losses in the Pacific Ocean, proposed by Deutsch et al. (2007). The question as to why such forcing to expand the N–S deviation had not occurred before 6 ka warrants more studies.
6 Conclusions
The available data showed that values ofδ15NNO
3at the bot-tom of the euphotic zone (∼150 m) were similar toδ15NSP,
implying that the source of nutrients for sinking particu-late organic matter was largely derived from a depth of around 150 m. Values of sedimentary δ15Nbulk were
obvi-ously higher thanδ15NSP in surrounding areas, suggesting
that such a shift of sedimentaryδ15Nbulkoccurred after
depo-sition. It is necessary to remove site-specific bias ofδ15Nbulk
values caused by bottom depth to retrieve the original sig-nal before alteration. As a result, the corrected nitrogen iso-topic signal in sediments could be representative of the value of δ15NNO3 at the bottom depth of the euphotic zone. The bottom-depth effects in the northern AS vary during different climate stages, but the variation is always lower than such effects in the southern AS in general. The modern surface δ15Nbulk values can be separated statistically into northern
and southern AS groups, reflecting a special coupling of den-itrification to the north, and N2 fixation to the south. This
phenomenon is supported by the reported modern-day N∗ distribution. As for historical records, the offset inδ15Nbulk
between the southern and northern AS remained relatively constant (1.0 ‰ for early Holocene and 0.9 ‰ for glacial) prior to 6 ka, indicating a synchronous shift in the relative intensity of denitrification and N2 fixation over the basin
to keep such a constant latitudinal gradient of subsurface δ15NNO3. However, this offset expanded gradually since 6 ka, likely due to more localized intensifications in denitrification and N2 fixation had occurred, respectively, in the northern
question as to why the driving force did not expand the N–S deviation before 6 ka warrants more studies.
Acknowledgements. This research was supported by the National Natural Science Foundation of China (NSFC 41176059, 91328207, and 41273083) and Shanhai Fund (2013SH012). K. Selvaraj per-sonally thanks the director of the National Center for Antarctic and Ocean Research, Goa and the Secretary, the Department of Ocean Development, New Delhi, for providing the ship time, and also the crew ofORV Sagar Kanyafor coring operation. K. Selvaraj also thanks V. Yoganandan for onboard help of subsampling, and the coordinator of Ocean Science and Technology Cell of Mangalore University, for their kind encouragement.
Edited by: N. Ohkouchi
References
Agnihotri, R., Altabet, M. A., and Herbert, T.: Influence of marine denitrification on atmospheric N2O variability dur-ing the Holocene, Geophys. Res. Lett., 33, , L13704, doi:10.1029/2006GL025864, 2006.
Aller, R. C.: Transport and reactions in the bioirrigated zone, The benthic boundary layer: Transport processes and biogeochem-istry, edited by: B. Boudreau, and Jørgensen, B. B., Oxford Uni-versity Press, Oxford, UK, 269–301, 2001.
Altabet, M.: Variations in nitrogen isotopic composition between sinking and suspended particles: Implications for nitrogen cy-cling and particle transformation in the open ocean, Deep-Sea Res. Pt. A, 35, 535–554, 1988.
Altabet, M. and Francois, R.: Sedimentary nitrogen isotopic ratio as a recorder for surface ocean nitrate utilization, Global Bio-geochem. Cy., 8, 103–116, 1994.
Altabet, M., Francois, R., Murray, D. W., and Prell, W. L.: Climate-related variations in denitrification in the Arabian Sea from sedi-ment15N /14N ratios, Nature, 373, 506–509, 1995.
Altabet, M., Murray, D. W., and Prell, W. L.: Climatically linked oscillations in Arabian Sea denitrification over the past 1 my: Implications for the marine N cycle, Paleoceanography, 14, 732– 743, 1999.
Altabet, M., Higginson, M. J., and Murray, D. W.: The effect of millennial-scale changes in Arabian Sea denitrification on atmo-spheric CO2, Nature, 415, 159–162, 2002.
Altabet, M.: Isotopic tracers of the marine nitrogen cycle: Present and past, in: Marine organic matter: biomarkers, isotopes and DNA, edited by: Volkman, J. K., Springer-Verlag Berlin Heidel-berg, 251–293, 2006.
Altabet, M.: Constraints on oceanic N balance/imbalance from sed-imentary15N records, Biogeosciences, 4, 75–86, 2007, http://www.biogeosciences.net/4/75/2007/.
Banakar, V., Oba, T., Chodankar, A., Kuramoto, T., Yamamoto, M., and Minagawa, M.: Monsoon related changes in sea surface pro-ductivity and water column denitrification in the Eastern Arabian Sea during the last glacial cycle, Mar. Geol., 219, 99–108, 2005. Bassinot, F. C., Marzin, C., Braconnot, P., Marti, O., Mathien-Blard, E., Lombard, F., and Bopp, L.: Holocene evolution of summer winds and marine productivity in the tropical Indian Ocean in
re-sponse to insolation forcing: data-model comparison, Clim. Past, 7, 815–829, doi:10.5194/cp-7-815-2011, 2011.
Brandes, J. A., Devol, A. H., Yoshinari, T., Jayakumar, D., and Naqvi, S.: Isotopic composition of nitrate in the central Arabian Sea and eastern tropical North Pacific: A tracer for mixing and nitrogen cycles, Limnol. Oceanogr., 43, 1680–1689, 1998. Brummer, G., Kloosterhuis, H., and Helder, W.: Monsoon-driven
export fluxes and early diagenesis of particulate nitrogen and its
δ15N across the Somalia margin, Geological Society, London, Special Publications, 195, 353–370, 2002.
Capone, D. G., Zehr, J. P., Paerl, H. W., Bergman, B., and Carpenter, E. J.: Trichodesmium, a globally significant marine cyanobac-terium, Science, 276, 1221-1229, 1997.
Capone, D. G., Subramaniam, A., Montoya, J. P., Voss, M., Hum-borg, C., Johansen, A. M., Siefert, R. L., and Carpenter, E. J.: An extensive bloom of the N2-fixing cyanobacterium Tri-chodesmium erythraeum in the central Arabian Sea, Mari. Ecol.-Prog. Ser., 172, 281–292, 1998.
Codispoti, L. and Christensen, J.: Nitrification, denitrification and nitrous oxide cycling in the eastern tropical South Pacific Ocean, Mar. Chem., 16, 277–300, 1985.
Cowie, G. L., Mowbray, S., Lewis, M., Matheson, H., and McKen-zie, R.: Carbon and nitrogen elemental and stable isotopic com-positions of surficial sediments from the Pakistan margin of the Arabian Sea, Deep-Sea Res. Pt. II, 56, 271–282, 2009.
Deutsch, C., Sarmiento, J. L., Sigman, D. M., Gruber, N., and Dunne, J. P.: Spatial coupling of nitrogen inputs and losses in the ocean, Nature, 445, 163–167, 2007.
Falkowski, P. G. and Godfrey, L. V.: Electrons, life and the evolu-tion of Earth’s oxygen cycle, Philosoph. Trans. Roy. Soc. B, 363, 2705–2716, 2008.
Galbraith, E. D., Kienast, M., Pedersen, T. F., and Calvert, S. E.: Glacial-interglacial modulation of the marine nitrogen cycle by high-latitude O2supply to the global thermocline, Paleoceanog-raphy, 19, PA4007, doi:10.1029/2003PA00100, 2004.
Galbraith, E. D., Kienast, M., Albuquerque, A. L., Altabet, M., Batista, F., Bianchi, D., Calvert, S., Quintana, S. C., Crosta, X., Holz, R. D. P., Dubois, N., Etourneau, J., Francois, R., Hsu, T.-C., Ivanochko, T., Jaccard, S., Kao, S.-J., Kiefer, T., Kien-ast, S., Lehmann, M. F., Martinez, P., McCarthy, M., Meckler, A. N., Mix, A., Möbius, J., Pedersen, T., Pichevin, L., Quan, T. M., Robinson, R. S., Ryabenko, E., Schmittner, A., Schneider, R., Schneider-Mor, A., Shigemitsu, M., Sinclair, D., Somes, C., Studer, A., Tesdal, J. E., Thunell, R., and Yang, J.-Y.: The accel-eration of oceanic denitrification during deglacial warming, Nat. Geosci., 5, 151–156, 2012.
Ganeshram, R. S., Pedersen, T. F., Calvert, S. E., and Murray, J. W.: Large changes in oceanic nutrient inventories from glacial to in-terglacial periods, Nature, 376, 755–758, 1995. Ganeshram, R. S., Pedersen, T. F., Calvert, S. E., McNeill, G. W., and Fontugne, M. R.: Glacial-interglacial variability in denitrification in the world’s oceans: Causes and consequences, Paleoceanography, 15, 361–376, 2000.
Ganeshram, R. S., Pedersen, T. F., Calvert, S., and François, R.: Reduced nitrogen fixation in the glacial ocean inferred from changes in marine nitrogen and phosphorus inventories, Nature, 415, 156–159, 2002.
ra-tios in rivers, sinking particles, and sediments, Marine Chemistry, 114, 72–85, 2009.
Gaye-Haake, B., Lahajnar, N., Emeis, K. C., Unger, D., Rixen, T., Suthhof, A., Ramaswamy, V., Schulz, H., Paropkari, A., and Guptha, M.: Stable nitrogen isotopic ratios of sinking particles and sediments from the northern Indian Ocean, Mar. Chem., 96, 243–255, 2005.
Gouretski, V. and Koltermann, K. P.: WOCE global hydrographic climatology, Berichte des BSH, 35, 1–52, 2004.
Gruber, N. and Sarmiento, J. L.: Biogeochemical/physical interac-tions in elemental cycles, in: The sea: Biological-Physical Inter-actions in the Oceans, edited by: Robinson, A. R., McCarthy, J. J., and Rothschild, B. J., John Wiley and Sons, New York, 337– 399, 2002.
Gruber, N.: The dynamics of the marine nitrogen cycle and its in-fluence on atmospheric CO2variations, in: The ocean carbon cy-cle and climate, edited by: Follows, M., and Oguz, T., Springer Netherlands, 97–148, 2004.
Gruber, N. and Galloway, J. N.: An Earth-system perspective of the global nitrogen cycle, Nature, 451, 293–296, 2008.
Haug, G. H., Pedersen, T. F., Sigman, D. M., Calvert, S. E., Nielsen, B., and Peterson, L. C.: Glacial/interglacial variations in produc-tion and nitrogen fixaproduc-tion in the Cariaco Basin during the last 580 kyr, Paleoceanography, 13, 427–432, 1998.
Holmes, M. E., Schneider, R. R., Müller, P. J., Segl, M., and Wefer, G.: Reconstruction of past nutrient utilization in the eastern An-gola Basin based on sedimentary15N /14N ratios, Paleoceanog-raphy, 12, 604–614, 1997.
Hong, Y., Hong, B., Lin, Q., Zhu, Y., Shibata, Y., Hirota, M., Uchida, M., Leng, X., Jiang, H., and Xu, H.: Correlation between Indian Ocean summer monsoon and North Atlantic climate dur-ing the Holocene, Earth Planet. Sci. Lett., 211, 371–380, 2003. Ivanochko, T. S., Ganeshram, R. S., Brummer, G. J. A., Ganssen,
G., Jung, S. J. A., Moreton, S. G., and Kroon, D.: Variations in tropical convection as an amplifier of global climate change at the millennial scale, Earth Planet. Sci. Lett., 235, 302–314, 2005. Kao, S., Lin, F., and Liu, K.: Organic carbon and nitrogen contents
and their isotopic compositions in surficial sediments from the East China Sea shelf and the southern Okinawa Trough, Deep-Sea Res. Pt. II, 50, 1203–1217, 2003.
Kao, S., Dai, M., Wei, K., Blair, N., and Lyons, W.: En-hanced supply of fossil organic carbon to the Okinawa Trough since the last deglaciation, Paleoceanography, 23, PA2207, doi:10.1029/2007PA001440, 2008.
Kienast, M., Higginson, M., Mollenhauer, G., Eglinton, T. I., Chen, M. T., and Calvert, S. E.: On the sedimentological origin of down-core variations of bulk sedimentary nitrogen isotope ratios, Paleoceanography, 20, PA2009, doi:10.1029/2004PA0018081, 2005.
Liu, K.-K. and Kaplan, I. R.: The eastern tropical Pacific as a source of15N-enriched nitrate in seawater off southern Califomia, Lim-nol. Oceanogr, 34, 820–830, 1989.
Meyers, P. A.: Organic geochemical proxies of paleoceanographic, paleolimnologic, and paleoclimatic processes, Organ. Geochem., 27, 213–250, 1997.
Möbius, J., Gaye, B., Lahajnar, N., Bahlmann, E., and Emeis, K.-C.: Influence of diagenesis on sedimentaryδ15N in the Arabian Sea over the last 130kyr, Mar. Geol., 284, 127–138, 2011.
Mollenhauer, G., Kienast, M., Lamy, F., Meggers, H., Schneider, R. R., Hayes, J. M., and Eglinton, T. I.: An evaluation of14C age relationships between co-occurring foraminifera, alkenones, and total organic carbon in continental margin sediments, Paleo-ceanography, 20, PA1016, doi:10.1029/2004PA001103, 2005. Morrison, J., Codispoti, L., Gaurin, S., Jones, B., Manghnani, V.,
and Zheng, Z.: Seasonal variation of hydrographic and nutrient fields during the US JGOFS Arabian Sea Process Study, Deep-Sea Res. Pt. II, 45, 2053–2101, 1998.
Morrison, J., Codispoti, L., Smith, S. L., Wishner, K., Flagg, C., Gardner, W. D., Gaurin, S., Naqvi, S., Manghnani, V., and Pros-perie, L.: The oxygen minimum zone in the Arabian Sea during 1995, Deep-Sea Res. Pt. II, 46, 1903–1931, 1999.
Nair, R., Ittekkot, V., Manganini, S., Ramaswamy, V., Haake, B., Degens, E., Desai, B. t., and Honjo, S.: Increased particle flux to the deep ocean related to monsoons, Nature, 338, 749–751, 1989.
Naqvi, S., Noronha, R. J., and Reddy, C.: Denitrification in the Ara-bian Sea, Deep-Sea Res. Pt. A, 29, 459–469, 1982.
Naqvi, S.: Denitrification processes in the Arabian Sea, Proc. Ind. Acad. Sci.-Earth Plane. Sci., 103, 279–300, 1994.
Naqvi, S., Naik, H., Pratihary, A., D’Souza, W., Narvekar, P., Jayakumar, D., Devol, A., Yoshinari, T., and Saino, T.: Coastal versus open-ocean denitrification in the Arabian Sea, Biogeo-sciences, 3, 621–633, 2006,
http://www.biogeosciences.net/3/621/2006/.
Olson, D. B., Hitchcock, G. L., Fine, R. A., and Warren, B. A.: Maintenance of the low-oxygen layer in the central Arabian Sea, Deep-Sea Res. Pt. II, 40, 673–685, 1993.
Pandarinath, K., Subrahmanya, K., Yadava, M., and Verma, S.: Late Quaternary Sedimentation Records on the Continental Slope Off Southwest Coast of India-Implications for Provenance, Deposi-tional and Paleomonsoonal Conditions, J. Geol. Soc. India, 69, 1285–1292, 2007.
Parab, S. G. and Matondkar, S.: Primary productivity and nitrogen fixation byTrichodesmiumspp. in the Arabian Sea, J. Mar. Syst., 105, 82–95, 2012.
Paulmier, A. and Ruiz-Pino, D.: Oxygen minimum zones (OMZs) in the modern ocean, Prog. Oceanogr., 80, 113–128, 2009. Pichevin, L., Bard, E., Martinez, P., and Billy, I.: Evidence of
ven-tilation changes in the Arabian Sea during the late Quaternary: Implication for denitrification and nitrous oxide emission, Global Biogeochem. Cy., 21, GB4008, doi:10.1029/2006GB002852, 2007.
Rao, V. P., Kessarkar, P. M., Thamban, M., and Patil, S. K.: Paleo-climatic and diagenetic history of the late quaternary sediments in a core from the Southeastern Arabian Sea: Geochemical and magnetic signals, J. Oceanogr., 66, 133–146, 2010.
Rau, G., Froelich, P. N., Takahashi, T., and Des Marais, D.: Does sedimentary organicδ13C record variations in Quaternary ocean [CO2(aq)], Paleoceanography, 6, 335–347, 1991.
Reichart, G.-J., Lourens, L., and Zachariasse, W.: Temporal vari-ability in the northern Arabian Sea Oxygen Minimum Zone (OMZ) during the last 225,000 years, Paleoceanography, 13, 607–621, 1998.
calibra-tion curves, 0–50 000 yeats cal BP, Radiocarbon, 51, 1111–1150, 2009.
Rixen, T., Haake, B., Ittekkot, V., Guptha, M., Nair, R., and Schlüs-sel, P.: Coupling between SW monsoon-related surface and deep ocean processes as discerned from continuous particle flux mea-surements and correlated satellite data, J. Geophys. Res., 101, 28569–28528, 1996.
Robinson, R. S., Brunelle, B. G., and Sigman, D. M.: Revisiting nu-trient utilization in the glacial Antarctic: Evidence from a new method for diatom-bound N isotopic analysis, Paleoceanogra-phy, 19, PA3001, doi:10.1029/2003PA000996, 2004.
Robinson, R. S., Kienast, M., Luiza Albuquerque, A., Altabet, M., Contreras, S., De Pol Holz, R., Dubois, N., Francois, R., Gbraith, E., and Hsu, T. C.: A review of nitrogen isotopic al-teration in marine sediments, Paleoceanography, 27, PA4203, doi:10.1029/2012PA002321, 2012.
Schäfer, P. and Ittekkot, V.: Seasonal variability ofδ15N in settling particles in the Arabian Sea and its palaeogeochemical signifi-cance, Naturwissenschaften, 80, 511–513, 1993.
Schmittner, A., Galbraith, E. D., Hostetler, S. W., Pedersen, T. F., and Zhang, R.: Large fluctuations of dissolved oxygen in the In-dia and Pacific oceans during Dansgaard-Oeschger oscillations caused by variations of North Atlantic Deep Water subduction, Paleoceanography, 22, PA3207, doi:10.1029/2006PA001384, 2007.
Schubert, C. J. and Calvert, S. E.: Nitrogen and carbon isotopic composition of marine and terrestrial organic matter in Arctic Ocean sediments: implications for nutrient utilization and or-ganic matter composition, Deep-Sea Res. Pt. I, 48, 789–810, 2001.
Schulte, S., Rostek, F., Bard, E., Rullkötter, J., and Marchal, O.: Variations of oxygen-minimum and primary productivity recorded in sediments of the Arabian Sea, Earth Planet. Sci. Lett., 173, 205–221, 1999.
Sigman, D., Altabet, M., Michener, R., McCorkle, D., Fry, B., and Holmes, R.: Natural abundance-level measurement of the nitro-gen isotopic composition of oceanic nitrate: an adaptation of the ammonia diffusion method, Mar. Chem., 57, 227–242, 1997. Sigman, D., Altabet, M., McCorkle, D., Francois, R., and Fischer,
G.: Theδ15N of nitrate in the Southern Ocean: nitrogen cycling and circulation in the ocean interior, J. Geophys. Res.-Oceans (1978–2012), 105, 19599–19614, 2000.
Sigman, D. M., Karsh, K. L., and Casciotti, K. L.: Nitrogen Isotopes in the Ocean, in: Encyclopedia of Ocean Sciences, edited by: John, H. S. (Editor-in-Chief), Academic Press, Oxford, 1884– 1894, 2001.
Stuiver, M. and Braziunas, T. F.: Anthropogenic and solar com-ponents of hemispheric14C, Geophys. Res. Lett., 25, 329–332, 1998.
Suthhof, A., Ittekkot, V., and Gaye-Haake, B.: Millennial-scale os-cillation of denitrification intensity in the Arabian Sea during the late Quaternary and its potential influence on atmospheric N2O and global climate, Global Biogeochem. Cy., 15, 637–649, 2001. Thunell, R. C., Sigman, D. M., Muller-Karger, F., Astor, Y., and Varela, R.: Nitrogen isotope dynamics of the Cariaco Basin, Venezuela, Global Biogeochem. Cy., 18, GB3001, doi:10.1029/2003GB002185, 2004.
You, Y.: Intermediate water circulation and ventilation of the Indian Ocean derived from water-mass contributions, J. Mar.Res., 56, 1029–1067, 1998.