Haemosporidians from Three Distinct Cerrado Habitats
in Brazil
Nayara O. Belo1, Renato T. Pinheiro2, Elivaˆnia S. Reis2, Robert E. Ricklefs3, E´rika M. Braga1*
1Departamento de Parasitologia, Instituto de Cieˆncias Biolo´gicas, Universidade Federal de Minas Gerais, Belo Horizonte, Brazil,2Universidade Federal do Tocantins, Palmas, Brazil,3Department of Biology, University of Missouri-St. Louis, St. Louis, Missouri, United States of America
Abstract
Habitat alteration can disrupt host–parasite interactions and lead to the emergence of new diseases in wild populations. The cerrado habitat of Brazil is being fragmented and degraded rapidly by agriculture and urbanization. We screened 676 wild birds from three habitats (intact cerrado, disturbed cerrado and transition area Amazonian rainforest-cerrado) for the presence of haemosporidian parasites (Plasmodium and Haemoproteus) to determine whether different habitats were associated with differences in the prevalence and diversity of infectious diseases in natural populations. Twenty one mitochondrial lineages, including 11 fromPlasmodiumand 10 fromHaemoproteuswere identified. Neither prevalence nor diversity of infections byPlasmodiumspp. orHaemoproteusspp. differed significantly among the three habitats. However, 15 of the parasite lineages had not been previously described and might be restricted to these habitats or to the region. Six haemosporidian lineages previously known from other regions, particularly the Caribbean Basin, comprised 50–80% of the infections in each of the samples, indicating a regional relationship between parasite distribution and abundance.
Citation:Belo NO, Pinheiro RT, Reis ES, Ricklefs RE, Braga E´M (2011) Prevalence and Lineage Diversity of Avian Haemosporidians from Three Distinct Cerrado Habitats in Brazil. PLoS ONE 6(3): e17654. doi:10.1371/journal.pone.0017654
Editor:Sharon Gursky-Doyen, Texas A&M University, United States of America
ReceivedNovember 4, 2010;AcceptedFebruary 8, 2011;PublishedMarch 8, 2011
Copyright:ß2011 Belo et al. This is an open-access article distributed under the terms of the Creative Commons Attribution License, which permits unrestricted use, distribution, and reproduction in any medium, provided the original author and source are credited.
Funding:This work was supported by Conselho Nacional de Pesquisa e Tecnologia (CNPq) and Fundac¸a˜o de Amparo a Pesquisa do Estado de Minas Gerais (FAPEMIG). The CNPQ granted a scholarship to Ms. Nayara O. Belo. Some laboratory work was supported by funds from the Curators of the University of Missouri to R.E.R. The funders had no role in study design, data collection and analysis, decision to publish, or preparation of the manuscript.
Competing Interests:The authors have declared that no competing interests exist.
* E-mail: embraga@icb.ufmg.br
Introduction
Understanding the influence of different landscapes on parasite-host interactions in wild populations is of particular relevance in a world undergoing dramatic change in climate. Such environmen-tal change can influence parasite-host relationships in many ways [1], particularly by altering the transmission of endemic pathogens of wildlife, which can lead to the emergence of new diseases in wild populations, domesticated animals, and humans [2]. Habitat degradation and diversity loss due to increased conversion of natural habitats to agricultural uses and urbanization influence the distribution and abundance of wildlife species and thus may be a major driver of change in the ecology of pathogen transmission.
Increases in the occurrence of human malaria in degraded habitats have been related to habitat change altering the distribution and behavior of human malaria vectors [3,4]. As human populations continue to grow exponentially, and as globalization increases with more travel and trade, anthropogenic pressures on wildlife habitat and populations also will increase [5]. The prevalence of malaria in natural populations of birds and mammals exhibits complex associations with landscapes over a range of spatial scales [6–8], including the influence of habitat degradation on vectors and disease patterns [9].
Brazil stands out among countries with high biodiversity. Thus, its natural environments are considered a priority for conservation because of their high degree of endemism and advanced degradation [10]. Nine of the ten countries that account for more
than 80 percent of the world’s primary forest area lose at least 1 percent of their forest area per year; Brazil loses 4 percent each year [11]. Among non-forest environments, the Brazilian Cerrado, which is considered one of the world’s biodiversity hotspots [10], is also one of the most endangered ecosystems in Brazil, being rapidly reduced in area due to agricultural expansion and urbanization. Brazil has lost 48.2% of its original Cerrado vegetation. Nowadays, deforestation destroys about 20,000 square kilometers of Cerrado each year. In September 2009, the Action Plan for Prevention and Control of Deforestation in the Cerrado Lands (PPCerrado) was launched to stop this forest devastation by 2011. [12]
cerrado habitat, urbanized cerrado habitat, and cerrado habitat that is intermixed with areas of Amazonian forest in a natural transition zone. Comparisons between these locations should provide a first indication of the influences of anthropogenic disturbance and habitat ecotones on the parasites of an assemblage of birds.
Results
Screning microscopy and PCR
We examined samples from 676 wild birds (29 families and 122 species) for haemosporidian parasites. Of these, 49% were infected withPlasmodiumspp. or Haemoproteusspp., using both microscopy and PCR as diagnostic methods.
The proportion of infected birds detected by PCR and by microscopy differed significantly (Table 1). Considering the microscopy results as the reference point, 254 PCR-positive samples and 165 microscopy-positive results yielded a sensitivity of 72% (95% CI: 65–79%); 422 PCR-negative and 511 microscopy-negative birds yielded a specificity of 74% (95% CI: 69–76%). Some blood parasite infections amplified by PCR were not detected by microscopy (6.6%), and 19% of samples were negative by microscopy and positive by PCR. Thus, the overall agreement (95% CI) of the PCR with the microscopy standard estimated by Youden’s index was 0.46 (0.38–0.54).
The combination of PCR and microscopy revealedPlasmodium
sp. or Haemoproteus sp. infections in 26 families (89.7%) and 93 species (76%) of avian host. The species with the highest prevalence of infection wereCacicus cela (n = 8, 88%), Formicivora grisea (n = 7, 87.5%), Ramphocelus carbo (n = 12, 75%), Manacus manacus (n = 21, 66.7%), Turdus leucomelas (n = 22, 55%), Elaenia chiriquensis(n = 28, 50%), andPipra fasciicauda(n = 112, 43%). The majority of species birds caught are resident in the region; only six migratory species (Elaenia chiriquensis,Elaenia cristata,Myiarchus ferox,
Myiarchus swainsoni, Tyrannus melancholicus, Vireo olivaceus) were among those infected, Elaenia chiriquensisbeing the one with the highest prevalence.
The prevalence of haemosporidian infections varied among the three areas studied (Table 1). Prevalence in the urban area (disturbed cerrado, UA: 56.2%; n = 108) exceeded that of the intact cerrado (LSP: 42.2%; n = 76; p = 0.007). Prevalence in the intact cerrado and transition area did not differ significantly (CSP: 58.3%) (n = 147; p = 0.2). Parasite prevalence in the urban and transition areas did not differ significantly using both microscopy and PCR as diagnostic methods (p = 0.70). The analysis of a single family of wild birds (Pipridae), which had similar representation in our sample among the three areas, revealed similar prevalences (p = 0.5); haemosporidian prevalence also was not heterogeneous among areas in the sample of the single most abundant species in our sample,Pipra fasciicauda(Pipridae) (p = 0.5). Parasite prevalence
in three additional common species (Turdus leucomelas, Coereba flaveolaandVolatinia jacarina) did not differ between intact cerrado and the urbanized area (p.0.05).
Parasite lineages and habitats
Sequencing of the cytochrome b gene revealed 11Plasmodium
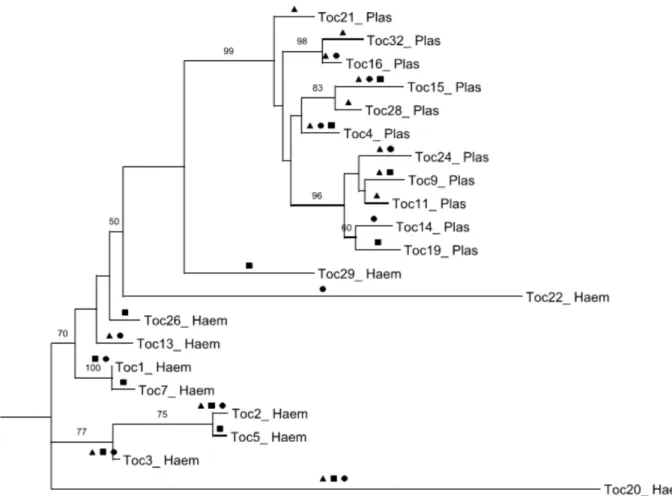
lineages and 10Haemoproteuslineages overall. We were unable to determine sequences of 19 individuals that showed multiple infections and of some additional samples with degraded DNA. Of 11 Plasmodiumlineages, 6 were restricted to a single study area: TOC-11, TOC-21, TOC-28 and TOC-32 in the urban area; TOC-19 in LSP; and TOC-14 in CSP (Figure 1). Five of 10 lineages ofHaemoproteuswere recovered from single areas: TOC-5, TOC-7, TOC-26 and TOC-29 in LSP; and TOC-22 in CSP. The lineages ofPlasmodium TOC-4, TOC-9, TOC-16, TOC-24 and TOC-15 and lineages ofHaemoproteus TOC-1, TOC-2, TOC-3, TOC13 and TOC-20 were observed in more than one habitat (LSP, CSP or/and UA) (Figure 1). Six of the lineages found in this study had previously been described in other studies (Table 2). Fifteen lineages are described for the first time in this study: 8
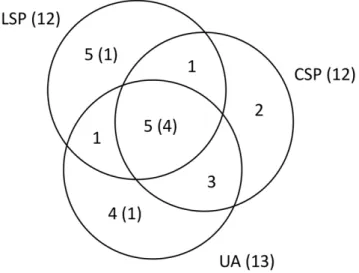
Plasmodium and 7 Haemoproteus. The widespread lineages were recovered from significantly more host species (6.565.2 sd, range 2–14, n = 6) than the local lineages (1.761.1 sd, range 1–5, n = 15) (Kruskal-Wallisx2= 6.8, df = 1, p = 0.01). The Venn diagram in Figure 2 summarizing the distribution of the parasite lineages among the three areas shows that the mixed habitat area (CSP) has the fewest unique lineages.
Parasite diversity was higher in the urban area (78.7% of the combined diversity) than in the intact (61.4%) and transition (56.6%) areas, but the differences were not statistically significant (p.0.05) (Table 3).
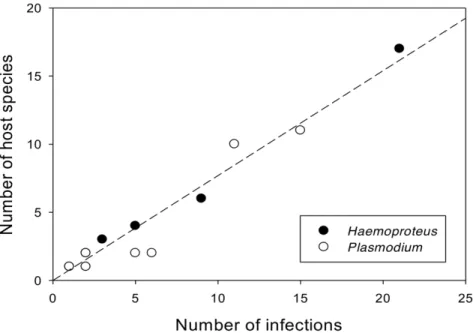
Table 4 lists the parasite lineages and host species and families parasitized. The number of host species increased with the number of each parasite lineage recovered (Figure 3). The proportion of parasite lineages sharing identical sequences in more than one host species occurs more inHaemoproteusthan inPlasmodium(Figure 3), however these proportions did not differ significantly (p = 0.68).
Discussion
Several studies have addressed the geographical distribution of genetically distinct blood parasites in different regions and habitats [6–8,16–20]. However, Neotropical areas, such as Cerrado and transition areas linking the Amazonian rainforest and the cerrado biome, have received little attention.
In the present study, we confirm the weak correspondence between PCR and microscopy results, probably due to the low-intensity of peripheral parasitemia and variation in diagnostic sensitivity [21–23]. In this study, the low levels of parasitemia detected by microscopic examination (ranging from 1 to 5 parasites/200 microscopic fields), with few plasmodia life stages (mainly young trophozoites), also makes morphological identifica-tion of the parasite difficult. Certainly, to obtain realistic estimates of parasite prevalence, it is important to combine both microscopy and PCR.
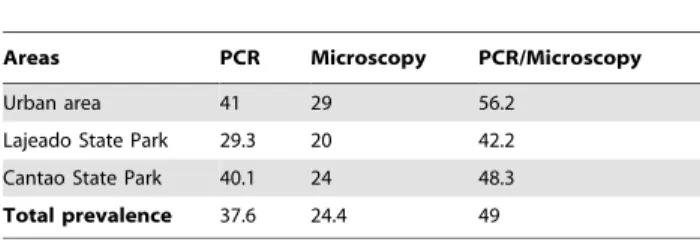
In our study, overall prevalence (Haemoproteus/Plasmodium) was higher in the urban area (urbanized cerrado, UA) and the highest number of uniquePlasmodiumlineages also was observed among birds sampled in the UA (Figure 1). We observed significantly lower prevalence of haemosporidians in the natural cerrado (LSP) compared to the UA. In contrast, we did not observe a significant difference between the diversity of parasites lineages in the natural cerrado and urbanized cerrado. However, when we analyze a single family (Pipridae) and a single bird species (Pipra fasciicauda) Table 1.Prevalence (%) ofPlasmodium/Haemoproteusin the
three different areas studied by PCR and microscopy methods.
Areas PCR Microscopy PCR/Microscopy
Urban area 41 29 56.2
Lajeado State Park 29.3 20 42.2
Cantao State Park 40.1 24 48.3
Total prevalence 37.6 24.4 49
sampled in all three habitats, we observed no statistically significant difference in prevalence or parasite lineage diversity between the habitats. The presence or absence of certain host species is likely the most important factor influencing the presence of parasite lineages and overall parasite prevalence, as shown in several previous studies [24,25]. The similarity in parasite diversity among the three areas might be related to the wide variety of wild birds distributed among these areas. Thus, it is likely that the presence or absence of a parasite lineage depends on the presence of suitable host species rather than particular attributes of the habitat independently of the host. In contrast, Chasar [8] showed that opening forest habitats in Cameroon, Africa, increased both the prevalence and diversity of parasite lineages in a particular host species. However, this type of habitat alteration likely results in more dramatic changes in avian and vector communities than the urbanization of cerrado habitat.
The high prevalence of blood parasites found in the transition area (CSP) might be related to periods of flooding, allowing
reproduction of vectors and consequently increasing the number of infections. Studies have demonstrated an increased risk of malaria in humans in proximity to bodies of water, which provide abundant mosquito breeding sites [26–28]. Future studies of mosquito ecology may reveal the vector–parasite competence relationships in transition areas (Amazonian and Cerrado) to be particularly useful in explaining observed patterns of heterogeneity in avian malaria infection in terms of vector abundance and diversity. We have little knowledge of the vectors that transmit the parasites of these Brazil Cerrado birds. There are reports ofCulex quinquefasciatusandAedes albopictus[29,30], which are known to be vectors of haemosporidians elsewhere, in the north of Brazil, but we do not know if these are vectors of avian malaria in the studied areas.
Spatial variation in parasite prevalence has been demonstrated [31,32], and it is likely that different parasite lineages are associated with particular vector communities. This factor could explain the differences in the geographic distribution of parasite lineages at different sites. In this study, however, we did not Figure 1. Phylogram ofPlasmodiumspp. andHaemoproteusspp. lineages in community birds.Phylogenetic relationships of the 21 haemosporidian parasite lineages found in three different habitats, based on cyt b sequences. Numbers located on the top of the branches indicate ML bootstrap support (100 replications, only values above 50% are shown). The presence of each parasite lineage in the three areas studied is indicated by: transition area (
N
), urban area (m) and natural area (&).doi:10.1371/journal.pone.0017654.g001
Table 2.Relation of parasites lineages already related in others studies.
Parasite Lineage GenBank number Identical Lineages Source
Toc2_ Haem AY540204 Ricklefs RE, et al. (2004)
Toc4_ Plas DQ659549 Beadell JS, et al. (2006)
Toc5_ Haem AY167242 Fallon SM, et al. (2003)
Toc15_ Plas AF465559 Ricklefs RE, Fallon SM (2002)
Toc20_ Haem HM222483 Ricklefs RE, Outlaw DC (2010)
Toc32_ Plas GQ395654 Levin II, et al. (2009)
observe significant differences in lineage diversity among the three habitats investigated suggesting that vectors assemblages were sufficient to support similar parasite assemblages independently of the environmental setting.
Plasmodium and Haemoproteus are widely distributed blood parasites that have been reported in many families of birds. Some studies have suggested that Haemoproteus parasites are relatively more host specific than Plasmodium[33]. However, in our study, lineages ofHaemoproteuswere shared among more host species than lineages ofPlasmodium, although this difference was not significant. Certainly, parasites of both genera are broadly competent to infect multiple host species, which underlies the phenomenon of frequent host switching over the evolutionary history of haemosporidian parasites [16–19].
Habitat can influence parasite load in host species, altering the frequency of contact with vectors of blood parasites [34]. However, in this study, although we observed a greater diversity of parasites in the urban area, there was no statistical difference in the diversity of lineages among the three areas studied, including the mixed environment, which might be expected to have a high abundance of vectors following periods of flooding. Some studies at local scales [35,36] have shown that malaria parasites may differ in prevalence and lineage diversity within small areas. However, this contrasts with the widespread distribution of most parasites in this study.
We observed broad variation in the number of hosts from which we recovered individual parasite lineages, ranging from one to 15 avian host species. The lineage with the greatest number of host
species (TOC-2 Haemoproteussp.) is also known from Venezuela and the state of Alabama in the United States [24]. Another lineage with wide host distribution (TOC-15, 10 hosts) is also known from Missouri in the United States and from the Lesser Antilles [24,37]. In general, the six parasite lineages identified in this study that are also known from outside the region exhibited the greatest local abundance and host diversity in this study.
We observed individual lineages of Haemoproteus parasitizing many host species in as many as eight families of birds. Other surveys have detected similar host diversity in some lineages of
Haemoproteus[38], indicating that some Haemoproteuslineages can Figure 2. The Venn diagram above shows the distribution of the parasite lineages among the three areas, with the total number of lineages indicated for each of the three areas in parentheses, and the number of widespread lineages indicated within each of the sections of the diagram in parentheses.It is interesting that the mixed habitat area (CSP) has the fewest lineages uniquely found there. doi:10.1371/journal.pone.0017654.g002
Table 3.Parasites lineages richness of estimated by Chao1 (S) in the urban area (UA), natural cerrado (LSP) and transition areas (CSP) of the Tocantins region.
Areas S SD IC 95% %
Total Richness 22.88 2.26 21.29 32.99 100
Lajeado State Park 12.96 1.4 12.09 19.97 56.6
Canta˜o State Park 14.00 4.18 11.39 34.00 61.4
Urban area 18.00 5.54 13.89 41.98 78.7
SD - Standard Deviation, CI: Confidence interval. S% - Percentage of total richness estimated for each area.
Table 4.Host species and parasite lineages in Tocantins areas/Brazil.
Host species Parasite Lineages (TOC) Haemosporidian
Galbulidae
Galbula flavogaster 2 Haemoproteussp.
Galbula ruficauda 20 Haemoproteus sp.
Bucconidae
Monasa nigrifrons 15, 22 Plasmodiumsp.;Haemoproteussp.
Picidae
Picumnus albosquamatus 2 Haemoproteussp.
Furnariidae
Dendrocolaptes certhia 2 Haemoproteussp.
Thamnophilidae
Sakesphorus luctuosus 1, 2 Haemoproteussp.
Myrmotherula multostriata 2 Haemoproteussp.
Formicivora grisea 2, 24 Plasmodiumsp.;Haemoproteussp.
Dysithamnus mentalis 2 Haemoproteussp.
Thamnophilus torquatus 4 Plasmodiumsp.
Tyrannidae
Hemitriccus margaritaceiventer 1 Haemoproteussp.
Corythopis torquatus 3 Haemoproteussp.
Elaenia chiriquensis 5, 15 Haemoproteussp.;Plasmodiumsp.
Elaenia cristata 3, 4 Haemoproteussp.;Plasmodiumsp.
Elaenia flavogaster 2 Haemoproteussp.
Euscarthmus rufomarginatus 29 Haemoproteussp.
Hemitriccus striaticollis 15 Plasmodiumsp.
Myiopagis gaimardii 2,4 Haemoproteussp.;Plasmodiumsp
Myiopagis viridicata 14 Plasmodiumsp.
Myiophobus fasciatus 26 Haemoproteussp.
Poecilotriccus fumifrons 15 Plasmodiumsp.
Tyrannus melancholicus 20 Haemoproteussp.
Parulidae
Basileuterus culicivorus 4 Plasmodiumsp.
Basileuterus hypoleucus 2 Haemoproteussp.
Pipridae
Manacus manacus 2, 3 Haemoproteussp.
Pipra fasciicauda 1, 2, 3, 4, 13, 15,16, 20, 22 Haemoproteussp;Plasmodiumsp.
Vireonidae
Vireo olivaceus 15 Plasmodiumsp.
Hylophilus pectoralis 21 Plasmodiumsp.
Hirundinidae
Progne chalybea 15 Plasmodiumsp.
Trogloditidae
Cantorchilus leucotis 3, 11, 16 Haemoproteussp.;Plasmodiumsp.
Turdidae
Turdus leucomelas 4, 7, 9 Haemoproteussp.;Plasmodiumsp.
Coerebidae
Coereba flaveola 1, 2, 28 Haemoproteussp;Plasmodiumsp.
Thraupidae
Dacnis cayana 5 Haemoproteussp.
Hemithraupis guira 15 Plasmodiumsp.
Neothraupis fasciata 4 Plasmodiumsp.
infect a broad variety of hosts. In contrast to these generalist lineages, we also recovered several individual lineages from single host species. Many of these were present in low abundance in our sample, and so it is difficult to assess host distribution [24]. Additional studies in northern region of Brazil will undoubtedly expand the host ranges of many of the apparent specialist haematozoan lineages.
Materials and Methods
Study sites
The study was carried out between 2007 and 2009 in three different areas in the Brazilian North region (5u169N, 33u449S) (Figure 4): 1) an urban area (UA) in the city of Palmas, Tocantins State, Brazil, consisting of cerrado vegetation being impacted by
one of the highest rates of urban growth of the country; 2) Lajeado State Park (LSP), created in 2001 and located 25 km outside of the city of Palmas, preserves 9,931 hectares of natural Cerrado vegetation; 3) Cantao State Park (CSP), located in a protected area of Brazilian Amazonian rainforest and Cerrado vegetation close to the Araguaia River and including a mixture of ecosystems. The birds were caught using a constant-effort method in which the number, time, and location of capture sessions, and the time interval between sessions, were standardized. Thus, each area was sampled bimonthly with 10 mist nets operated for 12 hours during a session. The sampling was conducted during two consecutive years, covering the avian annual cycle of molt, reproduction, and post-reproduction. This method allowed us to obtain an index of the seasonal changes in populations. In the first year, the average catch per session was 71 birds; in the second, 41 birds.
We obtained blood samples from 676 birds comprising 122 species in 29 families: 190 individuals in Palmas, 181 in LSP, and 305 CSP. The bird families with the greatest number of species sampled were Tyrannidae (38 species), Thraupidae (14 species), Thamnophilidae (11 species), Dendrocolaptidae (7 species), Emberizidae (6 species) and Pipridae (4 species). The species with the greatest number of individuals sampled werePipra fasciicauda(n = 112),Elaenia chiriquensis
(n = 28),Elaenia cristata(n = 26),Coereba flaveola(n = 25) andVolatinia jacarina(n = 24). The study was carried out with the approval of the Universidade Federal de Minas Gerais Ethics Committee for Experimentation (Permit Number: 205/2006).
Microscopic analysis
Blood samples were collected from the brachial vein on the underside of the wing and two or three smears were prepared using approximately 5mL of blood. The smears were air-dried, fixed in absolute methanol, and stained for 20 min in 10% Giemsa (Sigma Chemical Co., St. Louis, Missouri, USA), pH 7.4 [39]. The slides were exhaustively examined with a light microscope, and parasite density was quantified after examination of 200 microscopic fields (approximately 150 erythrocytes/field = 30,000 erythrocytes total) at 10006magnification under oil-immersion [39].
Molecular analysis
DNA extraction. The remaining approximately 20mL of blood sample was stored at room temperature (22–25uC) in cell lysis solution (PROMEGA, Madison, Wisconsin, USA) for approximately one day prior to DNA extraction. DNA from blood
Host species Parasite Lineages (TOC) Haemosporidian
Saltator maximus 9 Plasmodiumsp.
Tachyphonus cristatus 2, 15 Haemoproteussp.;Plasmodiumsp.
Tachyphonus luctuosus 13 Haemoproteussp.
Tangara cayana 2 Haemoproteussp.
Emberizidae
Arremon taciturnus 2, 4 Plasmodiumsp.
Coryphospingus pileatus 1, 2, 4, 32 Haemoproteussp.
Volatinia jacarina 3, 32 Haemoproteussp.;Plasmodiumsp.
Icteridae
Cacicus cela 4, 15 Plasmodiumsp.
Gnorimopsar chopi 29 Haemoproteussp.
doi:10.1371/journal.pone.0017654.t004
Table 4.Cont.
Figure 3. Number of host species as a function of the number of each type of parasite lineage recovered from three areas studied in Tocantins-Brazil.Plasmodiumlineages are indicated by no fill symbols andHaemoproteuslineages are indicated by fill symbols. We can observer that one Haemoproteus lineage was presented in 21specimens from 17 different bird species. Genus is not a significant effect in an analysis of covariance (F1,18 = 2.2, P = 0.15). The equation for the line is number of hosts =20.007 (60.27 se)+0.77 (60.04 se) number of infections (F1,19 = 377, P,0.0001, R2= 0.96).
samples was extracted with the Wizard Genomic DNA Purification Kit (PROMEGA) according to the manufacturer’s protocol. The DNA pellet was resuspended in 30mL of hydration solution and kept at220uC until use.
Screening. We used screening primers designed to amplify a 154 nucleotide segment of RNA-coding mitochondrial DNA [37]: 343F (59-GCT CAC GCA TCG CTT CT-39) and 496R (59-GAC CGG TCA TTT TCT TTG-39). PCR reactions were run in 10mL volumes that contained the following final concentrations: 0.4 mM of each primer, 200 mM of each dNTP (PROMEGA), 10 mM Tris–HCl, pH 8.5, 50 mM KCl, and 1 U of Taq DNA polymerase (PHONEUTRIA, Minas Gerais, Brazil). Thermal cycling conditions were as follows: initial denaturation of 2 min at 94uC followed by 35 cycles with 1 min denaturation at 94uC, 1 min annealing at 62uC, and extension at 72uC for 1 min 10 sec. This was followed by a final extension of 3 min at 72uC. The amplified products were visualized in 6% polyacrylamide gels stained with silver nitrate [39,40]. Microscopically negative samples showing a positive DNA amplification were exhaustively re-examined in order to confirm the presence of parasites.
Cytochrome b amplification. From samples in which we detected positive results (microscopy and/or mitochondrial DNA amplification), we amplified a fragment of 591 bp of the cyt b gene under the following conditions: an outer reaction using primers 3932F (59- GGG TTA TGT ATT ACC TTG GGG TC- 39) and DW4R (59-TGT TTG CTT GGG AGC TGT AAT CAT AAT GTG-39) [41] with 1ml of genomic DNA was subjected to an initial denaturation of 4 min at 94uC, followed by 35 cycles of 94uC for 20 sec, 49uC for 10 sec, and 68uC for 45 sec, and a final extension at 68uC for 3 min. For most samples, 0.5-ml aliquot of this product was used as a template for a nested reaction with primers 413F (59-TCA ACA ATG ACT TTA TTT GG-39) and 926R (59-GGG AGC TGT AAT CAT AAT GTG-39) [25] under initial denaturation of 94uC for 1 min and 28 cycles of 94uC for 20 sec, 52uC for 10 sec, and 68uC for 50 sec and then 68uC for 7 min. PCR products were screened on 1% agarose gels, stained with ethidium bromide, and visualized with a UV light source.
Phylogenetic analysis. Positive PCR products were purified for cycle sequence reactions using ExoSAP-IT (USB Corporation)
following manufacturer’s instructions. Bi-directional sequencing with dye-terminator fluorescent labeling was performed in an ABI Prism 3100 automated sequencer (Applied Biosystems, Inc.). We sequenced 591 base pairs of the cyt b gene forPlasmodiumspp. and
Haemoproteusspp.
DNA sequences were aligned using CLUSTALX [42] and edited using Seq ManII version 4 (DNASTAR Inc.) and are available through GenBank (accession numbers HQ287536- HQ287556). Sequences were compared for identification to their closest matches in GenBank using the NCBI nucleotide Blast search, and to unpublished sequences using a local blast search in the laboratory of R. E. Ricklefs. We produced a maximum likelihood phylogenetic tree for the parasite sequences using RaxML [43] with the GTR+ gamma model of nucleotide evolution and 100 bootstrap replications.
Statistics
We used the nonparametric estimator Chao1 [44] calculated with scores of 200 randomizations by EstimateS 8.2 [45] to estimate the host species richness and parasite lineage richness in each study site.
Because sample sizes of hosts were unbalanced between areas, we used contingency table analyses to detect interactions between location and parasite prevalence. Statistics were carried out using Prism 5.0 for Windows (GraphPad Software, Inc.). We used Stata 9.07 to construct tables and to calculate the agreement using Youden’s index (Y = Sensitivity+Specificity21, which reflects the likelihood of a positive result among truly positive subjects versus that for negative subjects; it ranges from 0 to 1) [46] between molecular and microscopic assessments of parasite prevalence.
Acknowledgments
We thank Ms. Maria Svensson for assistance in the molecular analysis.
Author Contributions
Conceived and designed the experiments: EMB NOB RER. Performed the experiments: NOB. Analyzed the data: NOB RER EMB. Contributed reagents/materials/analysis tools: EMB RTP ESR RER. Wrote the paper: NOB RER EMB.
References
1. Lafferty KD (1997) Environmental parasitology: what can parasites tell us about human impacts on environment?. Parasitol Today 13: 251–255.
2. Patz JA, Graczyk TK, Geller N, Vittor AY (2000) Effects of environmental change on emerging parasitic diseases. Int J Parasitol 30: 1395–405. 3. Vittor AY, Gilman RH, Tielsch J (2006) The effect of deforestation on the
human-biting rate ofAnopheles darlingi, the primary vector ofFalciparummalaria in the Peruvian Amazon. Am J Trop Med Hyg 74: 3–11.
4. Po´voa MM, Conn JE, Schlichting CD, Amaral JC, Segura MN, et al. (2003) Malaria vectors, epidemiology, and the re-emergence ofAnopheles darlingi in Bele´m, Para´, Brazil. J Med Entomology 40: 379–86.
5. Aguirre AA (2002) Conservation medicine: ecological health in practice. New York: Oxford University Press. pp 8–16.
6. Cottontail VM, Wellinghausen N, Kalko EK (2009) Habitat fragmentation and haemoparasites in the common fruit bat,Artibeus jamaicensis(Phyllostomidae) in a tropical lowland forest in Panama´. Parasitol 136: 1133–45.
7. Wood MJ, Cosgrove CL, Wilkin TA (2007) Within-population variation in prevalence and lineage distribution of avian malaria in blue tits, Cyanistes caeruleus. Mol Ecol 16: 3263–3273.
8. Chasar A, Loiseau C, Valkiu¯nas G, Iezhova T, Smith TB, et al. (2009) Prevalence and diversity patterns of avian blood parasites in degraded African rainforest habitats. Mol Ecol 18: 4121–33.
9. Gratz NG (1999) Emerging and resurging vector-borne diseases. Annu Rev Entomo 44: 51–75.
10. Myers N, Mittermeier RA, Mittermeier CG, da Fonseca GAB, Kent J (2000) Biodiversity hotspots for conservation priorities. Nature 403: 853–858. 11. Food and Agriculture Organization of the United Nations (2007) The State of
the World’s Forests 2007. Rome: FAO.
12. Environmental Situation. Available: Http://www.Brasil.Gov.Br/?Set_Language = En.
13. Kotze DJ, Samways MJ (2001) No general edge effects for invertebrates at Afromontane forest/grassland ecotones. Biodivers Conserv 10: 443–466. 14. Sehgal RN, Jones HI, Smith TB (2005) Blood parasites of some West African
rainforest birds. J Vet Med Sci 67: 295–301.
15. Smith TB, Wayne RK, Girman DJ, Bruford MW (1997) A Role for Ecotones in Generating Rainforest Biodiversity. Science 276: 1855–1857.
16. Bensch S, Stjernman M, Hasselquist D, Ostman O, Hansson B, et al. (2000) Host specificity in avian blood parasites: a study ofPlasmodiumandHaemoproteus
mitochondrial DNA amplified from birds. Proc Biol Sci 267: 1583–1589. 17. Ricklefs RE, Fallon SM (2002) Diversification and host switching in avian
malaria parasites. Proc R Soc Lond 269: 885–892.
18. Waldenstro¨m J, Bensch S, Kiboi S, Hasselquist D, Ottosson U (2002) Cross-species infection of blood parasites between resident and migratory songbirds in Africa. Mol Ecol 11: 1545–1554.
19. Beadell JS, Covas R, Gebhard C, Ishtiaq F, Melo M, et al. (2004) Host associations and evolutionary relationships of avian blood parasites from West Africa. Int J Parasitol 39: 257–266.
20. Bonneaud C, Sepil I, Mila´ B, Buermann W, Pollinger J, et al. (2009) The prevalence o avian Plasmodium is higher in undisturbed tropical forests o Cameroon. J Trop Ecol 25: 439–447.
21. Jarvi SI, Schultz JJ, Atkinson CT (2002) PCR diagnostics underestimate the prevalence of avian malaria (Plasmodium relictum) in experimentally infected passerines. J Parasitol 88: 153–8.
22. Richard FA, Sehgal RNM, Jones HI, Smith TB (2002) A comparative analysis of PCR-based detection methods for avian malaria. J Parasitol 88: 819–822. 23. Belo NO, Passos LF, Martins LC, Goulart CE, Sherlock TM, et al. (2009) Avian
malaria in captive psittacine birds: Detection by microscopy and 18S rRNA gene amplification. Prev Vet Med 88: 220–4.
24. Ricklefs RE, Fallon SM, Bermingham E (2004) Evolutionary relationships, cospeciation, and host switching in avian malaria parasites. Syst Biol 53: 111–9. 25. Ricklefs RE, Swanson BL, Fallon SM, Martinez-Abrain A, Scheuerlein A, et al. (2005) Community relationships of avian malaria parasites in Southern Missouri. Ecol Monogr 75: 543–559.
26. Van Der Hoek W, Konradsen F, Amerasinghe PH, Perera D, Piyaratne MK, et al. (2003) Towards a risk map of malaria for Sri Lanka: the importance of house location relative to vector breeding sites. Int J Epidemiol 32: 280–285. 27. Balls MJ, Bodker R, Thomas CJ (2004) Effect of topography on the risk of
malaria infection in the Usambara Mountains, Tanzania. Trans R Soc Trop Med Hyg 98: 400–408.
28. Omumbo JA, Hay SI, Snow RW, Tatem AJ, Rogers DJ (2005) Modelling malaria risk in East Africa at high-spatial resolution. Trop Med Int Health 10: 557–566.
29. Morais SA, Moratore C, Suesdek L, Marrelli MT (2010) Genetic-morphometric variation inCulex quinquefasciatusfrom Brazil and La Plata, Argentina. Mem Inst Oswaldo Cruz 105: 672–676.
30. Cunha RV, Schatzmayr HG, Miagostovich MP, Barbosa AM, Paiva FG, et al. (1999) Dengue epidemic in the State of Rio Grande do Norte, Brazil, in 1997. Trans R Soc Trop Med Hyg 93: 247–249.
31. Schall JJ, Marghoob AB (1995) Prevalence of malarial parasite over time and space: Plasmodium mexicanum in its vertebrate host, the western fence lizard
Sceloporus occidentalis. Anim Ecol 64: 177–185.
32. Bensch S, Akesson (2003) Temporal and spatial variation of hematozoans in Scandinavian willow warblers. J Parasitol 89: 388–91.
33. Atkinson CT, Van riper III C (1991) Pathogenicity and epizootiology of avian haematozoa:Plasmodium,Leucocytozoon, andHaemoproteus. In: Loye JE, Zuk M, eds. Bird-Parasite Interactions: Ecology, Evolution and Behaviour, Oxford Univ Press Oxford. pp 19–48.
34. Scott TW, Edman JD (1991) Effects of avian host age and arbovirus infection on mosquito attraction and blood-feeding success. In: Loye JE, Zuk M, eds. Bird parasite interactions, Oxford University Press Oxford UK. pp 179–204. 35. Wood MJ, Cosgrove Cl, Wilkin TA (2007) Within-population variation in
prevalence and lineage distribution of avian malaria in blue tits, Cyanistes caeruleus. Mol Ecol 16: 3263–3273.
36. Knowles SC, Wood MJ, Alves R, Wilkin TA, Bensch S, et al. (2010) Molecular epidemiology of malaria prevalence and parasitaemia in a wild bird population. Mol Ecol in press.
37. Fallon SM, Bermingham E, Ricklefs RE (2003) Island and taxon effects in parasitism revisited: avian malaria in the Lesser Antilles. Evolution 57: 606–615. 38. Fallon SM, Bermingham E, Ricklefs RE (2005) Host specialization and geographic localization of avian malaria parasites: a regional analysis in the Lesser Antilles. Am Nat 165: 466–480.
39. Ribeiro SF, Sebaio F, Branquinho FCS, Braga EM (2005) Avian malaria in Brazilian passerini birds: parasitism detected by nested PCR using DNA from stained blood smears. Parasitol 130: 261–267.
40. Sanguinetti CJ, Neto ED (1994) Simpson AJG. Rapid silver staining and recovery of PCR products separated on polyacrylamide gels. Biotechniques 17: 915–919.
41. Perkins SL, Schall JJ (2002) A molecular phylogeny of malarial parasites recovered from cytochrome b gene sequences. J Parasitol 88: 972–978. 42. Thompson JD, Gibson TJ, Plewniak F, Jeanmougin F, Higgins DG (1997)
Clustal_x Windows interface: flexible strategies for multiple sequence alignment aided by quality analysis tools. Nucleic Acids Res 24: 4876–4882.
43. Stamatakis A (2006) RAxML-VI-HPC: Maximum Likelihood-based Phyloge-netic Analyses with Thousands of Taxa and Mixed Models. Bioinformatics 22: 2688–2690.
44. Chao A, Chazdon RL, Colwell RK, Shen TJ (2006) Abundance-based similarity indices and their estimation when there are unseen species in samples. Biometrics 62: 361–371.
45. Colwell RK (2008) EstimateS: Statistical estimation of species richness and shared species from samples. Version 8.2, Departament of Ecology & Evolutionary Biology University of Connecticut, Storrs, CT. Avaliable: http:// purl.oclc.org/estimates.