Analysis and Design of One Dimensional Periodic Foundations for
Seismic Base Isolation of Structures
Witarto Witarto
1, S.J. Wang
2, Xin Nie
3, Y.L. Mo
1, Zhifei Shi
4, Yu Tang
5,
Robert P. Kassawara
61Department of Civil and Environmental Engineering, University of Houston, Houston, Texas 2
National Center for Research on Earthquake Engineering, Taipei, Taiwan
3Department of Civil Engineering, Tsinghua University, Beijing, China
4School of Civil and Environmental Engineering, Beijing Jiaotong University, Beijing, China 5Argonne National Laboratory, Argonne, Illinois
6
Electric Power Research Institute, Palo Alto, California
ABSTRACT
Periodic foundationis a new type of seismic base isolation system. It is inspired by the periodic material crystal lattice in the solid state physics. This kind of material has a unique property, which is termed as frequency band gap that is capable of blocking incoming waves having frequencies falling within the band gap. Consequently, seismic waves having frequencies falling within the frequency band gap are blocked by the periodic foundation. The ability to block the seismic waveshas put this kind of foundation as a prosperous next generation of seismic base isolators. This paper provides analytical study on the one dimensional (1D) type periodic foundations to investigate their seismic performance. The general idea of basic theory of one dimensional (1D) periodic foundations is first presented.Then, the parametric studies considering infinite and finite boundary conditions are discussed. The effect of superstructure on the frequency band gap is investigated as well. Based on the analytical study, a set of equations is proposed for the design guidelines of 1D periodic foundations for seismic base isolation of structures.
Keywords
–finite element, frequency band gap, one dimensional periodic foundation, phononic crystal, seismic isolationI.
I
NTRODUCTIONThe research on periodic material has shown that an infinite series of lattice layers has the ability to manipulate certain waves travelling through its medium [1–9]. Periodic material is classified into photonic crystal, which can manipulate electromagnetic waves and phononic crystal, which can manipulate elastic waves. According to the number of directions where the unit cell is repeated, periodic material can be classified as: one-dimensional (1D), two-one-dimensional (2D) and three-dimensional (3D) periodic material. This man-made material has the property of preventing the propagation of waves having frequencies within
certain frequency bands through the crystal’s
medium. These frequency bands are termed as frequency band gaps or attenuation zones [10].
Utilizing the unique feature of the periodicmaterial especially phononic crystal, researchers in civil engineering field have started to apply the crystal lattice into the structural element. In the beginning, mechanical and civil engineering researchers [11–15] studied the periodic beams and found the existence of flexural wave band gaps in the periodic beams. Then, theoretical and experimental studies were conducted to investigate the application
of periodic rod on offshore platforms to isolate the sea wave [16–17]. Subsequently, the phononic crystal was applied to the structural foundations to isolate seismic waves to protect the superstructure, which later known as periodic foundation. Although the idea of periodic foundations is relatively new, experimental testing on periodic foundations has already been conducted by several researchers[18– 20]. Due to its uniquewave isolation mechanism, periodic foundation can isolate superstructure from the incoming seismic waves without having a large relative horizontal displacement in the isolation layer that generally occurs in the conventional seismic isolation, such as: rubber bearings and friction pendulum systems[21].
II.
B
ASICT
HEORY OF1D
P
ERIODICM
ATERIALIn 1D periodic material, the crystal lattice possesses periodicity in one direction.Consider that the unit cell is composed of N layersin which the periodicity is in z direction, as shown in Fig.1.The equation of motion in each layer n subjected to elastic wave is shown in equation (1)
Figure 1.One dimensional periodic material 2 2 2 2 2 n n n n u u C t z
(1)
The Cn constant is expressed in equation (2)and equation (3)for input wavesof S-Wave and P-Wave, respectively.
/
n n n
C
(2)( 2 ) /
n n n n
C
(3)Where and are the Lamé elastic constantsand
𝜌 is material density at layer n. Consider a steady state oscillatory waves of angular frequency:
,
e
i t
n n n n
u
z t
u
z
(4)Substituting equation (4) into equation (1) yields:
2
2 2
2
( )
( ) 0
n n
n n n
n
u z
C u z
z
(5)
The general displacement solution of equation (5)is expressed as:
( ) sin( / ) sin( / )
n n n n n n n n
u z A z C B z C (6) In which An and Bn are the amplitudes of the general displacement solution on layer n. Subsequently, the shear stress component on the periodic foundation can be calculated fromequation (7).
( ) /
[ cos( / ) sin( / )] /
n n n n n
n n n n n n n n
z u z
A z C B z C C
(7)
Equation (6) and equation (7) are arranged into matrix form.
( )zn ( )zn
n n n
w H ψ (8)
or
sin( / ) sin( / )
( )
cos( / ) sin( / )
(z )
n n n n
n n n
n n
n n n n
n n n
n n
z C z C
u z A
z C z C B
C C (9)
The left hand side vector of equation (8) at the bottom of layer n is defined as𝐰𝐧𝐛which gives information regarding the displacement and the stress at the bottom of layer n. As for the top of layer n, the left hand side vector is defined as 𝐰𝐧𝐭which gives the information of displacement and the stress at the top of layer n.
(0) (0)
b
n n n n
w w H ψ (10)
(
z
n)
(
z
n)
t
n n n n
w
w
H
ψ
(11)Equation (10) can be related to equation (11) through a transfer matrix 𝐓𝐧.
t b
n n n
w
T w
(12)Hence, the transfer matrix 𝐓𝐧 for a single layer n is:
1(Zn) (0)
n n n
T H H (13)
Each layer interface of the unit cell is assumed to be perfectly bonded and hence the displacement and shear stress need to satisfy continuity. Therefore, the displacement and shear stress of the top of layer n is equal to that of the bottom of layer n+1.
b t
n+1 n
w w (14)
The relation of displacement and shear stress of the bottom and top surfaces of the unit cell containing N layers are:
... ...
t b t
N N N N N-1
b b
N N-1 N-1 N N-1 1 1
w T w T w
T T w T T T w
(15)
The displacement and shear stress vector of top and bottom surface of the unit cell is 𝐰𝐭=𝐰𝐍𝐭and
𝐰𝐛=𝐰
𝟏𝐛. Equation (15)can be shortened into: (ω)
t b
w T w (16)
Based on the Bloch-Floquent theorem the periodic boundary conditions can be expressed as:
eika
t b
w w (17)
Wherea is the unit cell thickness. Subtraction of equation (17) by equation (16) yields:
( ) e ika 0
T I w b (18) The nontrivial solution can be achieved when:
( ) e
ika 0T I (19)
Equation (19) is the so called Eigenvalue problem, with e𝑖𝑘𝑎 equal to the Eigenvalue of the transformation matrix T(ω). Thus, the relation of wave number k and frequency ω can be obtained by solving the corresponding Eigenvalue problem. The relationship between the wave number and frequency forms the dispersion curve, which provides the information of the frequency band gaps.
III.
P
ARAMETRICS
TUDY OF1D
P
ERIODICF
OUNDATIONS WITHI
NFINITEU
NITC
ELLSThe most simple unit cell of 1D periodic foundation is the two layered unit cell. In this configuration, a single unit cell consists of 2 different layers; A and B; in which hA and hBrepresents the
height of each of both layers A and B, respectively.
Consider rubber and concrete as the unit cell’s
component with material properties as shown in Table 1 and each layer height, hrand hc, equals to 0.2
m as shown in Fig.2.
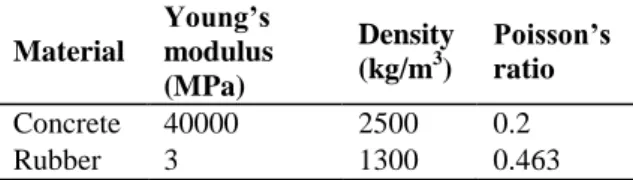
Table 1.Material properties for benchmark unit cell of 1D periodic foundation
Component
Young’s
modulus (MPa)
Density (kg/m3)
Poisson’s
ratio
Concrete 31400 2300 0.2
Rubber 0.58 1300 0.463
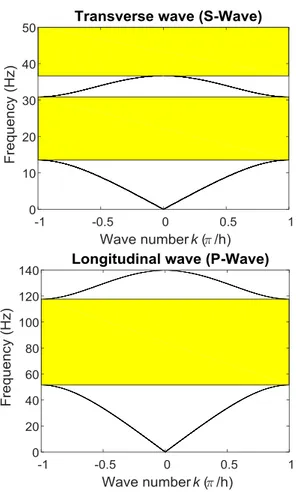
Figure 3. Dispersion curve of the periodic foundation with benchmark unit cell
Fig.3shows the dispersion curves of the periodic foundation with benchmark unit cell subjected to transverse wave (S-Wave) and longitudinal wave (P-Wave). The curves were obtained by solving the Eigenvalue problem stated in equation (19). The first two frequency band gaps under S-Wave are observed at 13.51 Hz– 30.87 Hz and 36.65 Hz to 50 Hz. While the first frequency band gap under P-Wave are 51.5 Hz – 117.6 Hz.
By changing each of the material and geometric properties while keeping the rest of the properties the same as in the benchmark unit cell, the effect of each property on the first frequency band gap can be observed.
Figure 4.Effect of rubber material properties on the first frequency band gap
Fig.4 shows the effect of rubber material properties on the first frequency band gap. The starting frequency of the first frequency band gap represented by the blue curve and the width of the first band gap (obtained by subtracting the starting frequency from the end frequency of the first band gap) represented by the red curve increase rapidly
with the increase of the Young’s modulus of rubber.
The increase of rubber density would slightly reduce the starting frequency of the first frequency band gap and would greatly reduce the width of the band gap.
The effect of Poisson’s ratio is different when the
periodic foundation is subjected to S-Wave or P-Wave. While both the starting and the width of the frequency band gap are steadily decreasing as the
Poisson’s ratio increases under the S-Wave, the starting and the width of the frequency band gap
increase tremendously as the Poison’s ratio gets
closer to 0.5 under the P-Wave. This is so because the volumetric locking occurs in the continuum body subjected to the P-Wave. As shown in equation (3), the constant C for P-Wave is a function of the first Lamé constant λ. As the Poison’s ratio gets closer to 0.5, theλ value goes to infinite causing the volumetric locking that makes the continuum body to become very stiff.
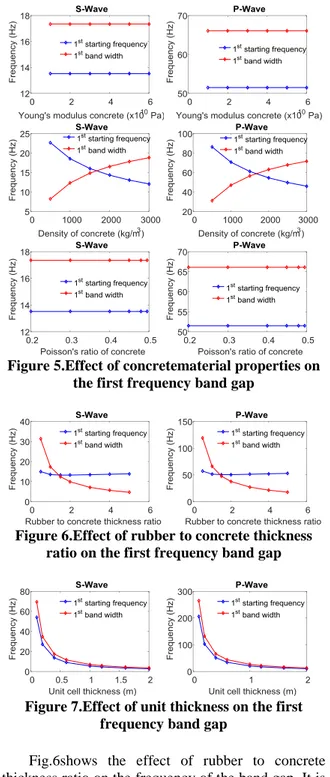
Fig.5shows the effect of each of the concrete material properties on the first frequency band gap. It
is observed that the Young’s modulus and Poisson’s
Figure 5.Effect of concretematerial properties on the first frequency band gap
Figure 6.Effect of rubber to concrete thickness ratio on the first frequency band gap
Figure 7.Effect of unit thickness on the first frequency band gap
Fig.6shows the effect of rubber to concrete thickness ratio on the frequency of the band gap. It is shown that the increase of the rubber to concrete thickness ratio would reduce the starting frequency of the first attenuation zone when the thickness ratio is lower than 1.5. For the thickness ratio greater than 1.5, the starting frequency of the first attenuation zone would increase along with the increase of the thickness ratio. Meanwhile, the width of the attenuation zone keeps decreasing with the increase of the thickness ratio. Fig.7shows that the increase of the unit cell thickness would result in the reduction of the starting frequency and the width of the frequency band gap.
IV.
P
ARAMETRIC STUDY OF1D
PERIODIC FOUNDATIONS WITH FINITE NUMBEROF UNIT CELLS
The parametric studies conducted in Section III have provided the insight of how the material and geometric properties affect the frequency band gap. However, the real structures would have a finite geometry. Thus, the number of unit cells and the plane area has to be finite. In order to simulate the behavior of periodic foundation as close as possible to the reality, finite element model of 1D periodic foundations was utilized. The material properties were assumed to be linear elastic.
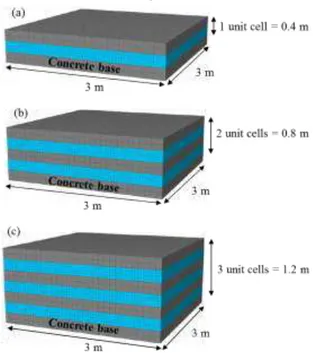
4.1. Effect of periodic foundation plane size This section investigates the plane size effect of the periodic foundation on the response inside the frequency band gap. The periodic foundation was modeled using one unit cell consisting of a rubber layer and a concrete layer. The unit cell was placed on top of a concrete base layer. Each layer has a thickness of 0.2 m. The material properties are listed in Table 2. Three cases were investigated: Case A1 with plane size 1m x 1m, Case A2 with plane size 2m x 2m, and Case A3 with plane size 3m x 3m. All three cases are shown in Fig.8.
Table 2. Material properties
Material
Young’s
modulus (MPa)
Density (kg/m3)
Poisson’s
ratio
Concrete 40000 2300 0.2
Rubber 0.1586 1277 0.463
All three cases were subjected to the vibration of a scanning frequency ranging from 0 to 50 Hz which is a typical main frequency content of seismic waves. The responses of these foundations are presented in the form of frequency response function (FRF) defined as 20log 𝛿 /𝛿𝑖 , where 𝛿 is the instantaneus displacement amplitude recorded at the top of the periodic foundation and 𝛿𝑖 is the amplitude of instantaneous displacement input at the base of the periodic foundation.
The FRF of all three foundations are presented in Fig.9. The negative value shows that the output response is smaller than the input. The yellow gaps are the theoretical frequency band gap obtained from solving the wave equation as described in Section II. It is observed that inside the theoretical frequency band gap, all three foundations show response reduction. Occasional spikes, due to rocking modes, inside the frequency band gap that goes to positive value were observed on the curves. However, the larger the plane size, which is the closer it is to the theoretical infinite boundary condition, the less spikes occur inside the frequency band gap because the rocking modes are eliminated.
Figure 9. Frequency response function of periodic foundation with different plane size
4.2. Effect of number of unit cells
This section investigates the effect of number of unit cells on the response inside the frequency band
gap. Three cases of periodic foundation were investigated. The first case (designated as Case B1) is a periodic foundation with one unit cell and plane size of 3m x 3m, similar to Case A3 studied in Section 4.1. The second case (designated as Case B2) is a periodic foundation with two unit cells. The third case (designated as Case B3) is a periodic foundation with three unit cells. The illustration of each of the three cases is shown inFig.10.
Figure 10.(a) Case B1 (one unit cell); (b) Case B2 (two unit cells); (c) Case B3 (three unit cells)
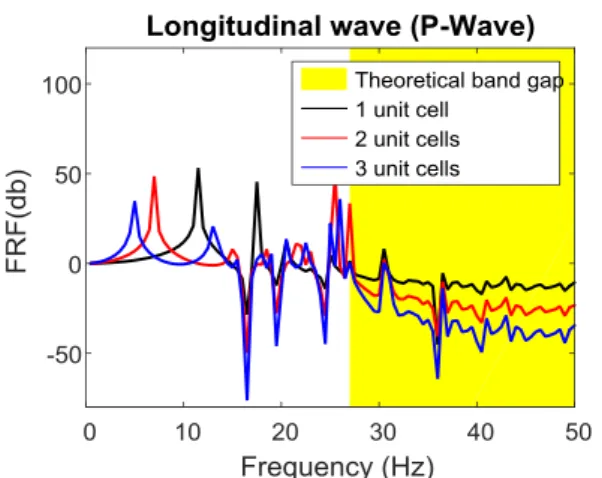
Figure 11.Frequency response function of periodic foundation with different number of unit cells
4.3. Effect of multilayered unit cells
In this section, the effect of multilayered unit cell as a combination of two different unit cells is studied. The first periodic foundation (designated as unit cell-1) is composed of Layer A (made of rubber material) with a layer thickness of 0.2 m and Layer B (made of concrete material) with a layer thickness of 0.2 m. The second foundation (designated as unit cell-2) is composed of Layer C (made of rubber material) with a layer thickness of 0.15 m and Layer D (made of concrete material) with a layer thickness of 0.25 m. Both periodic foundations have plane size of 3 m by 3 m and seat on a concrete base (Fig.12(a) and Fig.12(b)). The third periodic foundation (designated as unit cell-3) is composed of all four layers composing the two periodic foundations mentioned above (Fig.12(c)). The material properties follow Table 2.
(a) (b)
(c)
Figure 12. (a) Unit cell-1, (b) Unit cell-2, and (c) Unit cell-3
The FRF of each of the three foundations subjected to transverse wave can be seen inFig.13. For both the periodic foundation made of unit cell-1 and the periodic foundation made of unit cell-2, the FRF values are found to be negative inside the theoretical frequency band gap. The frequency band gap of the unit cell-1 and unit cell-2 can be seen overlapping one another. Therefore, the unit cell-3, which is the combination of the two unit cells, is presumed to have frequency band gap coming from
the union of the two frequency band gaps (7 Hz to 50 Hz). However, Fig.13(c) shows that the FRF has a positive peak around frequency 17 Hz which represents amplification inside the combined frequency band gap. This result invalidates the previous presumption.
The contradicting result indicates that the frequency band gap of four-layer unit cell is not the union of the frequency band gaps of two separate two-layer unit cells. Therefore the frequency band gap of the four-layer unit cells is calculated.
Using the transfer matrix method, the theoretical frequency band gap of the four-layer unit cell is obtained, as shown in Fig.14. It is observed that multiple frequency band gaps are located very close to each other in the region of 7.37 Hz to 50 Hz. The pass bands that separate the frequency band gaps in this region are 17.36 Hz –17.85 Hz, 23.14 Hz –23.45 Hz, 33.32 Hz–33.44 Hz, 44.16 Hz–44.22Hz, and 49.38Hz–49.48Hz. These very thin pass bands responsible for the amplification of the response at 17 Hz and peak FRFs at 23 Hz, 33 Hz, 44.5 Hz, and 50 Hz. Since the pass band is very small, some peaks still have negative FRF values representing the response reduction.
(a)
(c)
Figure 13. Frequency response function (a) Unit cell-1, (b) Unit cell-2, and (c) Unit cell-3
(a)
(b)
Figure 14. (a) Theoretical band gap of unit cell-3 (b) FRF of unit cell-3
4.4. Effect of superstructure
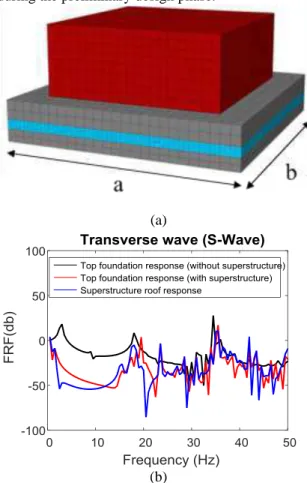
As periodic foundation is designed to support a superstructure, the presence of superstructure in 1D periodic foundation may affect the frequency response function curve. Fig.15(a) illustrates a superstructure seating on a 1D periodic foundation. The mass and stiffness of the superstructure are
tuned, so that the natural frequency of the superstructure alone is 10 Hz (typical natural frequency of nuclear reactor building or low rise building). Fig.15(b) shows that the FRF curves of the 1D periodic foundation with superstructure (red and blue curves) are quite different especially for the attenuation zone in the first band as compared to that of 1D periodic foundation without superstructure (black curve).
Performing finite element analysis of the full superstructure with periodic foundation can be time consuming. Since the presence of superstructure will alter the FRF curve especially in the first frequency band gap, it is more convenient if one can predict the altered frequency band gap without having to model the entire superstructure. This is important especially during the preliminary design phase.
(a)
(b)
Figure 15. (a) 1D periodic foundation with superstructure (b) FRF of 1D periodic foundation
with superstructure
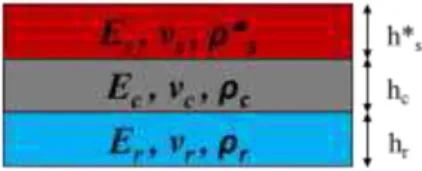
When the superstructure is stiff enough (such as nuclear reactor building), the superstructure can be transformed into an equivalent additional layer of a unit cell, as shown inFig.16. The superstructure is assumed as an additional layer with thickness h*s, which can be set the same as the upmost concrete layer hc. The total weight of the superstructure is then
cross sectional area (horizontal area) of the periodic foundation and the additional layer thickness.
Figure 16.Unit cell with equivalent superstructure layer
The corresponding frequency band gaps of the unit cell with equivalent superstructure layer are shown in Fig.17. It is observed that the negative values in the FRF curves of 1D periodic foundation with superstructure (blue and red curves in Fig.15(b)) coincide with the theoretical frequency band gaps of unit cell with equivalent superstructure layer. Therefore, to predict the altered frequency band gap due to the presence of superstructure, it is much more convenient to solve for the dispersion curve of the multi-layer unit cell with equivalent layer of superstructure.
Figure 17.Theoretical band gap of unit cell with equivalent superstructure layer
4.5.Damping in 1D periodic foundation
It is explained in structural dynamics that the damping effect will reduce the structural response[22]. In 2009, Hussein [23] introduced the theory of damping in phononic crystal.This section will discuss the effect of damping in 1D periodic foundation. For under-damped condition, the wave propagation will experience amplitude decay and shortening of frequency. The damped frequency can be obtained using equation (20). Therefore, each wave number k will have corresponding damped natural frequencies and subsequently the damped dispersion curve can be obtained [51].
2 d
ω ( ) ω( ) 1 ζ( )
k
k
k
(20) Assuming the damping in the whole body of 1D periodic foundation is 10%. The damped and undamped dispersion curvesare shown inFig.18. It can be observed that the difference in theundampedand the damped dispersion curves is negligible. Therefore, in periodic foundation, the frequency band gap of the damped unit cell can be considered the same as the undamped unit cell.
Figure 18. Dispersion curve of damped unit cell
Figure 19. FRF of damped unit cell
Consider the Case B1 periodic foundation in Section 4.2. The damping ratio of 4% and 10% are assigned to the concrete and rubber layers, respectively. The FRF curves of the periodic foundation with and without damping are shown inFig.19. It can be seen that inside the frequency band gap, the FRF values of the damped and undamped periodic foundations are the same since the waves are not propagated through the periodic foundations. Outside the frequency band gap, the response are reduced tremendously especially in the pass band after the first frequency band gap. Therefore, damping contribution is very significant to reduce the response outside the frequency band gap.
V.
D
ESIGN GUIDELINES OF1D
PERIODIC FOUNDATIONThe parametric study was conducted by first assuming a reference or benchmark unit cell. The unit cell size of the periodic foundation is set to be 0.4 m with a rubber to concrete thickness ratio of one. The dispersion curve of the benchmark unit cell under S-Wave and P-S-Wave are shown inFig.3. The first frequency band gap under S-Wave starts at 13.51 Hz with a band width of 17.36 Hz. While the first frequency band gap under P-Wave starts at 51.5 Hz with a band width of 66.1 Hz. Since the damping will reduce the responses at the pass bands after the first frequency band gap, therefore only the first frequency band gap is considered in the development of design guidelines.
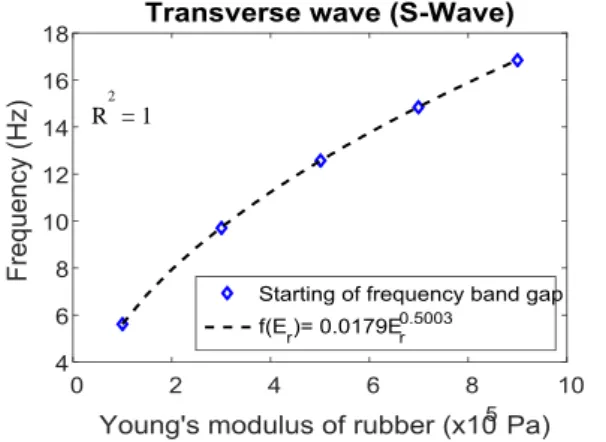
Figure 20. Regression for the effect of Young’s modulus of rubber on the starting of frequency
band gap under S-Wave
Each of the material and geometric properties was changed while keeping the rest of the properties constant. The change in the frequency band gaps due to a certain parameter is observed to follow a certain pattern. The results are then fitted with a regression curve that provides the simplest and the closest equation to the data points. The regression curve for the starting of frequency band gap under S-Wave as a
function of Young’s modulus of rubber is shown in
Fig.20. The chosen power equation can accurately fit the data points.
The Young’s modulus and Poisson’s ratio of
concrete were not included since they do not have any effect on the frequency band gap. The obtained equations were normalized with the starting of frequency band gap obtained from the unit cell with a set of reference properties, which is 13.51 Hz. The normalization turns the regression equations into a modification factor. These modification factors will modify the frequency band gap of the unit cell with respect to the set of reference properties. The final equations to find the starting of frequency band gap and the band width under both S-Wave and P-Wave are shown in equations(21)to (24).
Starting of frequency band gap (S-Wave)=
1 2 3 4 5 6
13.51F(Er) (F r) (Fr)F(c)F T F r (21)
Band width (S-Wave) =
1 2 3 4 5 6
17.36G(Er)G(
r)G(
r)G (
c)G T G r (22)Starting of frequency band gap (P-Wave) =
1( ) 2( ) 3( 4 5 6
51.5H Er H
r H
r)H (
c)H T H r (23)Band width (P-Wave) =
1( ) (2 ) (3 4 5 6
66.1I Er I
r I
r) (I
c)I T I r (24)with the modification factors as follow:
3 0.5003 1
F (Er) 1.3094 10 Er
5
2 4
2.814 1.627 10 F ( )
13.51 13.6451 10
r r r
0.6263 3F (
r) 0.4139
r 1.25610.03885 4
F (
c) 14.937
c 10.05185
F ( )T 0.4 /T
2.878 0.01594
6
F ( )r 0.6403e r0.9489e r
3 0.4996 1
G (Er) 1.3185 10 Er
0.5964 2
G (
r)98.0991
r 0.36320.6325 3
G (
r) 0.4112
r 1.25230.03885 4
G (
c) 11.6244
c 9.6025
5
G ( )T 0.4 /T 0.8319 6
G ( )r r
3 0.5 1
H (Er) 1.3122 10 Er
5
2 5
8.978 6.493 10 H ( )
51.5 5.9431 10
r r r
1.945 16 71.99
3
H ( ) 0.3076e r 5.9728 10 e r r
0.04212 4
H (
c) 14.0932
c 9.1689
5
H ( )T 0.4 /T
2.838 0.01595
6
H ( )r 0.62738e r0.94796e r
3 0.4999 1
I (Er) 1.3145 10 Er
0.5954 2
I (
r) 97.6097
r 0.3657
1.947 16 71.99
3
I ( ) 0.3074e r 5.9592 10 e r r
0.04212 4
I (
c) 10.9803
c 8.92285
I ( )T 0.4 /T 0.8321 6
I ( )r r
WhereE is the Young’s modulus, ρ is the density, and ν is the Poisson’s ratio. Each of the subscriptsr and
cshowsthat material properties belongs to rubber or
concrete, respectively. The unit cell thickness and the rubber to concrete thickness ratio are denoted by T and r, respectively.
This set of equations ((21)to (24)) is very convenient to be used for design. Suppose that the frequency band gap is the design objective, while the
R
2
materials are given from the product in the market. Hence, the unit cell size and rubber to concrete thickness ratio can be tuned to obtain the desired frequency band gap.For example, the materials that will be used for the design is a high density concrete and soft rubber with properties shown in Table 3. The periodic foundation is expected to have starting frequency of band gap at around 6 Hz. The unit cell size are then designed as 2 m with a rubber to concrete thickness ratio of 1. The frequency band gaps under S-Wave and P-Wave calculated using equations(21) to (24)are 6.44–14.51 Hz and 21.18– 50.01 Hz, respectively. Detail calculations are shown below:
Starting of frequency band gap (S-Wave)
1 2 3 4 5 6
13.51F(Er) (F r) (Fr) (F c)F T F r
13.51 2.278 1.08 1 0.968 0.2 1 6.44Hz
Band width (S-Wave)
1 2 3 4 5 6
17.36G(Er)G (
r)G (
r)G (
c)G T G r
17.36 2.27 1 1 1.025 0.2 1 8.07Hz
Starting of frequency band gap (P-Wave)
1 2 3 4 5 6
51.5H(Er)H(r)H(r)H(c)H T H r
51.5 2.273 1 0.936 0.968 0.2 1 21.18Hz
Band width (P-Wave)
1 2 3 4 5 6
66.1I(Er) (I
r) (I
r) (I
c)I T I r
66.1 2.273 1 0.935 1.025 0.2 1 28.83Hz
Table 3. Material properties for designed 1D periodic foundation
Material
Young’s
modulus (MPa)
Density (kg/m3)
Poisson’s
ratio
Concrete 40000 2500 0.2 Rubber 3 1300 0.463
The dispersion curves obtained from solving the wave equation are shown in Fig.21. The first frequency band gap under S-Wave is observed to be at 6–14 Hz. While under P-Wave, the first frequency band gap is observed to be at 22.7–53.48 Hz. The proposed method is proven that can accurately predict the theoretical frequency band gap.
Figure 21. Dispersion curve of designed 1D unit cell under (a) S-Wave (b) P-Wave
VI.
C
ONCLUSIONSTheoretical studies have been conducted to investigate the behavior of 1D periodic foundations as seismic isolators. In order to get lower and wider frequency band gaps, the unit cell must consists of at least two contrasting components, i.e. stiff and dense component as well as light and soft component. In the real application one unit cell is capable of isolating the waves having frequencies inside the theoretical frequency band gap. The more unit cells, the better the waves attenuation. Large plane size to the total thickness of periodic foundation is necessary in order to eliminate the undesirable rocking mode. The present of damping is certainly beneficial to reduce the amplification on the pass bands. The presence of superstructure can be beneficial as it alters the first frequency band gap to become lower and wider. A set of simple equations to predict the first frequency band gap is developed for the design of 1D periodic foundations. The equation is straight forward and can be applied directly in the design without solving the wave equation.
The analytical studies have shown that 1D periodic foundation is very promising for seismic base isolation system. Experimental test needs to be conducted to prove the obtained analytical results. Therefore, an experimental program on 1D periodic foundation is currently under preparation and will be conducted in the coming years.
VII.
Acknowledgements
R
EFERENCES[1] Z. Liu, . X. Zhang, Y. Mao, Y. Zhu, Z. Yang, C. T. Chan and P. Sheng, Locally Resonant Sonic Materials,Science, 289, 2000, 1734–1736.
[2] C. Kittel, Introduction to solid state physics, (Hoboken, NJ: John Wiley & Sons, 2005). [3] M. Sigalas, M. S. Kushwaha, E. N.
Economou, M. Kafesaki, I. E. Psarobas and W. Steurer, Classical vibrational modes in phononic lattices: theory and experment,Z.
Kristallogr, 2005, 765–809.
[4] E. L. Thomas, T. Gorishnyy and M. Maldovan, Phononics: Colloidal Crystals Go Hypersonic,Nature Materials, 5, 2006, 773– 774.
[5] W. Xiao, G. W. Zeng and Y. S. Cheng, Flexural Vibration Band Gaps in a Thin Plate Containing a Periodic Array of Hemmed Discs,Applied Acoustics, 69(3), 2008, 255–261.
[6] M. A. Ghasemi, R. Khodadadi and H. A. Banaei, Design And Simulation Of All Optical Multiplexer based On One-Dimensional Photonic Crystal For Optical Communications Systems,International
Journal of Engineering Research and Applications, 2(6), 2012, 960-968.
[7] Y. S. Joe, J.-F. D. Essiben and E. R. Hedin, Surface-Wave Suppression Using Periodic Structures,International Journal of Engineering Research and Applications, 3(2), 2013, 1562-1566.
[8] M. Maldovan, Sound and Heat Revolutions in Phononics,Nature, 503, 2013, 209–217. [9] G. Kaur, A. S. Sappal and H. Singh, Band
Gap Computation of Two Dimensional Photonic Crystal for High Index Contrast Grating Application,International Journal of
Engineering Research and Applications, 4(5), 2014, 136-139.
[10] M. Torres and F. R. Montero de Espinosa, Ultrasonic Band Gaps and Negative Refraction, Ultrasonics,42, 2004, 787–790. [11] J. Wen, G. Wang, D. Yu, H. Zhao and Y.
Liu, Theoretical and Experimental Investigation of Flexural Wave Propagation in Straight Beams with Periodic Structures: Application to a Vibration Isolation Structure,Journal of Applied Physics, 97(11), 2005, 114907.
[12] M. I. Hussein, G. M. Hulbert and R. A. Scott, Dispersive Elastodynamics of 1D Banded Materials and Structures: Design,Journal of Sound and Vibration,
307(3), 2007, 865–893.
[13] H. J. Xiang and Z. F. Shi, Analysis of Flexural Vibration Band Gaps in Periodic
Beams Using Differential Quadrature Method,Computers & Structures, 87(23), 2009, 1559–1566.
[14] H. J. Xiang and Z. F. Shi, "Vibration Attenuation in Periodic Composite Timoshenko Beams on Pasternak Foundation, Structural Engineering and
Mechanics, 40(3), 2011, 373-392.
[15] D. Yu, J. Wen, H. Shen, Y. Xiao and X. Wen, Propagation of Flexural Wave in Periodic Beam on Elastic Foundations,
Physics Letters A, 376(4), 2012, 626–630. [16] S. A. Asiri, A. S. Mohammad and A. S.
Al-Ghamdi, Dynamic Response of An Experimental Model for Offshore Platforms With Periodic Legs,Journal of King Abdulaziz University Engineering Sciences, 20(1), 2009, 93-121.
[17] S. A. Asiri and Y. Z. AL-Zahrani, Theoretical Analysis of Mechanical Vibration for Offshore Platform Structures,World Journal of Mechanics,
4(1), 2014, 1-11.
[18] H. J. Xiang, Z. F. Shi, S. J. Wang and Y. L. Mo, Periodic materials-based vibration attenuation in layered foundations: experimental validation,Smart Materials and
Structures, 21, 2014, 1–10.
[19] Y. Yan, A. Laskar, Z. Cheng, F. Menq, Y. Tang, Y. L. Mo and Z. Shi, Seismic isolation of two dimensional periodic foundations,Journal of Applied Physics,
116(4), 2014, 044908.
[20] Y. Yan, Z. Cheng, F. Menq, Y. L. Mo, Y. Tang and Z. Shi, Three dimensional periodic foundations for base seismic isolation,Smart
Materials and Structures, 24(7), 2015,
075006.
[21] Y. Yan, Y. L. Mo, F. Y. Menq, K. H. Stokoe II, J. Perkins and Y. Tang, Development of
seismic isolation systems using periodic materials, Department of Energy, Technical
Report Project No. 3219, 2014.
[22] A. K. Chopra, Dynamics of structures:
theory and applications to earthquake engineering, (Upper Saddle River, NJ:
Prentice-Hall, 2007).
[23] I. M. Hussein, Theory of damped Bloch waves in elastic media,Physical Review B,