ACPD
14, 17401–17438, 2014Low temperatures enhance organic nitrate formation
L. Lee et al.
Title Page
Abstract Introduction
Conclusions References
Tables Figures
◭ ◮
◭ ◮
Back Close
Full Screen / Esc
Printer-friendly Version Interactive Discussion
Discussion
P
a
per
|
Discus
sion
P
a
per
|
Discussion
P
a
per
|
Discussion
P
a
per
|
Atmos. Chem. Phys. Discuss., 14, 17401–17438, 2014 www.atmos-chem-phys-discuss.net/14/17401/2014/ doi:10.5194/acpd-14-17401-2014
© Author(s) 2014. CC Attribution 3.0 License.
This discussion paper is/has been under review for the journal Atmospheric Chemistry and Physics (ACP). Please refer to the corresponding final paper in ACP if available.
Low temperatures enhance organic
nitrate formation: evidence from
observations in the 2012 Uintah Basin
Winter Ozone Study
L. Lee1, P. J. Wooldridge1, J. B. Gilman2, C. Warneke2, J. de Gouw2, and
R. C. Cohen1,3
1
Department of Chemistry, University of California, Berkeley, CA, USA
2
Chemical Science Division, Earth System Research Laboratory, National Oceanic & Atmospheric Administration, Boulder, CO, USA
3
Department of Earth and Planetary Sciences, University of California, Berkeley, CA, USA
Received: 28 May 2014 – Accepted: 10 June 2014 – Published: 30 June 2014
Correspondence to: R. C. Cohen ([email protected])
ACPD
14, 17401–17438, 2014Low temperatures enhance organic nitrate formation
L. Lee et al.
Title Page
Abstract Introduction
Conclusions References
Tables Figures
◭ ◮
◭ ◮
Back Close
Full Screen / Esc
Printer-friendly Version Interactive Discussion
Discussion
P
a
per
|
Discus
sion
P
a
per
|
Discussion
P
a
per
|
Discussion
P
a
per
|
Abstract
Nitrogen dioxide (NO2) and total alkyl nitrates (ΣANs) were measured using thermal
dissociation laser induced fluorescence during the 2012 Uintah Basin Winter Ozone
Study (UBWOS) in Utah, USA. The observed NO2 concentration was highest before
sunrise and lowest in the late afternoon, suggestive of a persistent local source of NO2
5
coupled with turbulent mixing out of the boundary layer. In contrast, ΣANs co-varied
with solar radiation with a noontime maximum, indicating that local photochemical pro-duction combined with rapid mixing and/or deposition was the dominant factor in
deter-mining theΣAN concentrations. We calculate thatΣANs were a large fraction (∼60 %)
of the HOx free radical chain termination and show that the temperature dependence
10
of the alkyl nitrate yields enhances the role ofΣANs in local chemistry during winter by
comparison to what would occur at the warmer temperatures of summer.
1 Introduction
The Uintah Basin in Utah is a region of concentrated fossil fuel extraction operations using hydraulic fracturing to extract natural gas and oil from shale formations. The basin
15
has experienced high wintertime ozone as has the nearby Upper Green River Basin in
Wyoming (Schnell et al., 2009). The observed∼200 ppb peak ozone in the basin
dur-ing the winter of 2011 was associated with elevated concentrations of volatile organic compounds (VOCs) coincident with a shallow boundary layer stabilized by snow cover, which doubled as a solar reflector leading to more rapid photochemistry.
20
Organic nitrates (RONO2) are products of atmospheric VOC oxidation in the
pres-ence of NOx (NO+NO2). During daytime, their formation involves the association
re-action of alkyl peroxy radicals with NO. This rere-action terminates ozone formation and
suppresses OH recycling. The importance of RONO2 formation as a NOx sink and
chain terminator of ozone production depends on the mixture of VOCs present as a
re-25
ACPD
14, 17401–17438, 2014Low temperatures enhance organic nitrate formation
L. Lee et al.
Title Page
Abstract Introduction
Conclusions References
Tables Figures
◭ ◮
◭ ◮
Back Close
Full Screen / Esc
Printer-friendly Version Interactive Discussion
Discussion
P
a
per
|
Discus
sion
P
a
per
|
Discussion
P
a
per
|
Discussion
P
a
per
|
molecules (Perring et al., 2013; Farmer et al., 2011). Laboratory studies have shown
that the nitrate yield follows standard expectations for 3-body reactions:α increases
with carbon number of the organic peroxy radical and atmospheric pressure, but de-creases with temperature (Atkinson et al., 1983; Carter and Atkinson, 1989). Field
ob-servations have found RONO2compounds to account for 25 % or more of total reactive
5
nitrogen (NOy, defined as NOx+higher nitrogen oxides). However, none of these prior
field experiments (Farmer et al., 2011; Rosen et al., 2004; Perring et al., 2010, 2009) covered a temperature range wide enough to examine the role of the temperature
de-pendence ofα on nitrate formation rates, O3, or OH concentrations.
In this paper we present observations of organic nitrates obtained during the UBWOS
10
2012 experiment (15 January–29 February 2012). We further describe the role of
or-ganic nitrates in wintertime ozone production and the associated temperature effect by
comparing theα values either constrained by observedΣANs concentration or derived
from temperature-dependent yields from VOC composition data. The findings show or-ganic nitrate formation to be one of the primary radical sinks at this site and confirm that
15
the temperature-dependent kinetics are important. However, temperature dependence of organic nitrate yields are not presented in any of the standard photochemical mech-anisms used in chemical transport models. Accounting for the temperature dependent
yields at 0◦C (the typical daytime temperature during this field campaign) results in
a 30 % faster organic nitrate formation rate than what would occur at room
tempera-20
ture (300 K). As a result, we estimate a suppression in OH concentrations by 15 % and ozone formation by 20 % relative to the calculations that do not include the temperature
dependence of the RONO2yields.
2 Instrumentation
The 2012 Uintah Basin Winter Ozone Study occurred from 15 January to the end of
25
ACPD
14, 17401–17438, 2014Low temperatures enhance organic nitrate formation
L. Lee et al.
Title Page
Abstract Introduction
Conclusions References
Tables Figures
◭ ◮
◭ ◮
Back Close
Full Screen / Esc
Printer-friendly Version Interactive Discussion
Discussion
P
a
per
|
Discus
sion
P
a
per
|
Discussion
P
a
per
|
Discussion
P
a
per
|
center of Uintah Basin, with dense gas production wells to the south and oil production wells to the south-west (refer to Fig. 1 of Edwards et al., 2013). A 19 m high tower was on-site for setting up measurements at various heights.
Thermal Dissociation-Laser Induced Fluorescence (TD-LIF) was used to
mea-sure NO2, total peroxy nitrates (ΣPNs= ΣROONO2) and total alkyl nitrates (ΣANs=
5
ΣRONO2) using methods described previously. (Day et al., 2002; Thornton et al., 2000)
Briefly, laser induced fluorescence was used for detection of gas phase NO2 using
a CW solid-state tunable fiber laser (∼80 mW, NovaWave) at 530 nm for excitation
with detection of photons at wavelengths longer than 700 nm using a red-sensitive PMT (Hamamatsu H7421) preceded by a dielectric long-pass filter. Quartz tubes with
exter-10
nal heating elements were maintained at 180◦C for conversion of ΣPNs and 380◦C
forΣANs to NO2 under a residence time of ∼20 ms. Simultaneous measurements of
NO2, ΣPNs and ΣANs were achieved by operating 3 LIF cells, each measuring the
cumulative concentration of NO2-yielding compounds.
Corrections are necessary for the TD channel signals. As a negative interference,
15
O3 pyrolysis and subsequent O atom-initiated chemistry in the TD oven reduces the
amount of NO2observed for a temperature in excess of 270◦C. This effect is prominent
when the contribution ofΣANs is small compared to ambient NO2. The correction is an
empirical relationship developed in the laboratory by directly observing the loss of the
380◦C signal as a function of both O3and NO2concentrations in the presence of an
20
organic nitrate surrogate (2-ethylhexyl nitrate, Sigma Aldrich). Details of this correction are included in the Appendix A. The factors applied during the daytime hours that
are the focus of this study were typically 6–17 % of the total 380◦C signal, of which
ΣANs account for approximately 25 %. This amounts to a correction of 24–68 % of the
finalΣANs concentration. Larger corrections were required at night due to higher NO2
25
concentration. There are also additional contributions from inorganic species, including
N2O5(which decomposes to NO2and NO3at∼90◦C) in the 180◦C channel and ClNO2
(which decomposes to a chlorine atom and NO2, Thaler et al., 2011) in the 380◦C
ACPD
14, 17401–17438, 2014Low temperatures enhance organic nitrate formation
L. Lee et al.
Title Page
Abstract Introduction
Conclusions References
Tables Figures
◭ ◮
◭ ◮
Back Close
Full Screen / Esc
Printer-friendly Version Interactive Discussion
Discussion
P
a
per
|
Discus
sion
P
a
per
|
Discussion
P
a
per
|
Discussion
P
a
per
|
measurements of both species were available at the site. (Wagner et al., 2011; Roberts
et al., 2009) Overall, the ClNO2 contribution to the difference signal between 380
◦
C
and 180◦C was only significant during the night and early morning since, for example,
the noontime photolysis lifetime of ClNO2is only 1 h. We note that N2O5, present only
during nighttime, did not affect daytimeΣPNs measurements.
5
In subsequent analyses, ΣPNs is calculated as the difference in concentrations of
the ambient and 180◦C channel minus the N2O5contribution, whileΣANs is the
con-centration difference between the 180◦C channel and the O3-corrected 380
◦
C channel
minus the ClNO2contribution.
The TD-LIF instrument was calibrated hourly with a 5 ppm NO2gas standard diluted
10
with zero air to generate 5 different concentration levels at the inlet manifold. In addition,
the instrument zero (baseline) was monitored every half-hour by overflowing the inlet
with NOx-free zero air. The NO2 concentration measured by LIF and nearby
chemilu-minescence instrument were within 7 % of each other on average, giving a linear slope
(LIF vs. chemiluminescence) of 0.94, an intercept of 0.02 ppb, and anR2value of 0.97.
15
The inlet was mounted on the southern face of the tower, 16 m above the ground.
Other measurements made from similar heights include NO and NOy (Kliner et al.,
1997), speciated VOCs (Goldan et al., 2004), O3 and photolysis rates for O3 (O1D),
NO2 and NO3. These measurements are described elsewhere (see description and
the Supplement Table S1 in Edwards et al., 2013). Temperature, pressure, relative
20
ACPD
14, 17401–17438, 2014Low temperatures enhance organic nitrate formation
L. Lee et al.
Title Page
Abstract Introduction
Conclusions References
Tables Figures
◭ ◮
◭ ◮
Back Close
Full Screen / Esc
Printer-friendly Version Interactive Discussion
Discussion
P
a
per
|
Discus
sion
P
a
per
|
Discussion
P
a
per
|
Discussion
P
a
per
|
3 Results
3.1 Observations
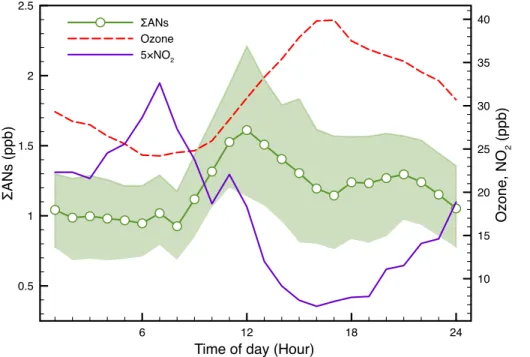
Figure 1 shows the time series (as hourly average) of NO2,ΣANs, O3and windspeed
through the observational period. The time-of-day median values of NO2,ΣANs and O3
are plotted in Fig. 2. During periods with windspeed lower than 5 m s−1, the chemical
5
species, such as large volatile organic compounds (VOCs) and NOx, accumulate,
lead-ing to an increase in concentrations until high wind episodes occur that flush the basin with clean air. The onset of high wind episodes were therefore coincident with a rapid
decrease in VOCs and NOxconcentrations. During the UBWOS campaign in the year
before (2011), up to 200 ppb ozone was observed at the end of accumulation periods
10
with snow cover on the ground. However, during similar period in the 2012 campaign, there was little snow and the ozone concentration did not exceed 51 ppb.
3.1.1 NO2
NO2showed a clear diurnal variation (Fig. 2). Concentrations were highest in the early
morning when vehicle traffic as well as oil well machinery emissions became
coinci-15
dent with a stable nocturnal boundary layer. Turbulent mixing in the afternoon diluted
the concentration, giving a minimum at 4 p.m. local time. The multi-day effect of high/low
wind episodes on NO2concentration is visible for which high windspeed always
corre-sponds to low NO2levels (Fig. 1).
3.1.2 ΣANs
20
The daily variation inΣANs concentration is less pronounced than for NO2 but follows
a similar multi-day trend controlled by meteorology. As shown in Fig. 2, the total RONO2
contribu-ACPD
14, 17401–17438, 2014Low temperatures enhance organic nitrate formation
L. Lee et al.
Title Page
Abstract Introduction
Conclusions References
Tables Figures
◭ ◮
◭ ◮
Back Close
Full Screen / Esc
Printer-friendly Version Interactive Discussion
Discussion
P
a
per
|
Discus
sion
P
a
per
|
Discussion
P
a
per
|
Discussion
P
a
per
|
tions from C1-C3 alkyl nitrates measured by GC-MS are small and nearly constant at
∼50 ppt and did not contribute to the diurnal profile observed.
3.1.3 O3
The observed O3concentration ranged from 4 to 50 ppb and was negatively correlated
with NO2. The diurnal profile has a maximum concentration in the late afternoon,
cor-5
responding to a delay of roughly 4 h from the peak of organic nitrates. The increase in
O3concentration is most rapid (∼2.4 ppb h−
1
) at noon.
3.1.4 VOCs
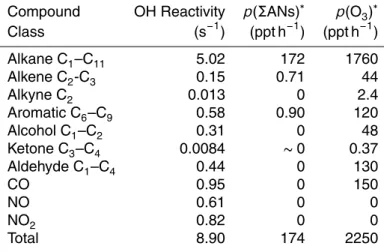
The VOC composition is influenced heavily by the fossil fuel extraction operations. Alkane oxidation dominates the chemistry in the basin (Table 1), accounting for 67 %
10
of total measured VOC reactivity (7.5 s−1) at noon. The diurnal profile of VOCs follows
NO2, reaching a minimum in the late afternoon (see Fig. 3a in Edwards et al., 2012).
3.2 The average branching ratio for nitrate formation
The average noontime temperature during the UBWOS experiment was 0◦C. These
cold temperatures provide a unique opportunity to examine the role of temperature on
15
the formation of organic nitrates and the associated radical chain termination compared with other field campaigns taking places in summer.
Organic nitrate compounds are formed via OH-initiated oxidation. For the specific mixture of VOCs observed, the dominant reaction starts with hydrogen abstraction
from alkanes by OH. The resulting alkyl radical rapidly reacts with O2to give alkyl
per-20
oxy radical RO2, which subsequently reacts with NO to form an energy-rich adduct of
the structure ROONO∗(Reaction R1). Under typical atmospheric conditions, a fraction
(Reaction R2) of ROONO∗is collisionally stabilized to form the nitrooxy group, RONO2,
while the unstabilized portion (Reaction R3) dissociates to yield an alkoxy radical and
NO2. The fate of the alkoxy radical varies depending on the carbon backbone but, in
ACPD
14, 17401–17438, 2014Low temperatures enhance organic nitrate formation
L. Lee et al.
Title Page
Abstract Introduction
Conclusions References
Tables Figures
◭ ◮
◭ ◮
Back Close
Full Screen / Esc
Printer-friendly Version Interactive Discussion
Discussion
P
a
per
|
Discus
sion
P
a
per
|
Discussion
P
a
per
|
Discussion
P
a
per
|
general, returns a HO2radical.
RO2+NO→ROONO
∗
(R1)
α ROONO∗+M→RONO2+M (R2)
(1−α) ROONO∗→RO+NO2 (R3)
Given a rate of VOC reaction with OH, the key factor regulating RONO2 production
5
is the nitrate branching ratio,α, defined as the overall fraction of the RO2+NO reaction
that gives an organic nitrate product rather than an alkoxy radical and NO2 product.
The association reaction to form RONO2is compound-specific and temperature- and
pressure-dependent (Atkinson et al., 1983). In the subsequent sections, we present
2 independent methods for estimating ensemble-averaged α values (or hαi) for the
10
specific environment of UBWOS campaign, and demonstrate they agree to within the uncertainty of our observations. The first method (Sect. 3.2.1) is based on parame-terizations derived from laboratory experiments and the observed VOC composition
data, while the second method (Sect. 3.2.2) uses the observed ΣANs concentration,
photolysis and VOC reactivity.
15
3.2.1 VOC-ensemble method
The averaged α, hαi, is defined in equation below as the summation of
compound-specificαvalues weighted by their relative importance in atmospheric oxidation
calcu-lated as the product of OH reaction rate constant and compound concentration (namely, the OH reactivity).
20
hαi=
P
i
ki[xi]αi
P
j
kj[xj] (1)
Here αi denotes the compound-specific nitrate branching ratio, ki (kj) the OH
ACPD
14, 17401–17438, 2014Low temperatures enhance organic nitrate formation
L. Lee et al.
Title Page
Abstract Introduction
Conclusions References
Tables Figures
◭ ◮
◭ ◮
Back Close
Full Screen / Esc
Printer-friendly Version Interactive Discussion
Discussion
P
a
per
|
Discus
sion
P
a
per
|
Discussion
P
a
per
|
Discussion
P
a
per
|
(kj[xj]), in the Uintah basin was dominated by alkanes (see Table 1). We point out
here that the net effect of temperature on the OH reaction rate constants was generally
small, typically a 5 % reduction in total OH reactivity compared with 298 K values (Atkin-son, 1994) and the dominant temperature dependence of organic nitrate production is due to the nitrate branching ratio as detailed below.
5
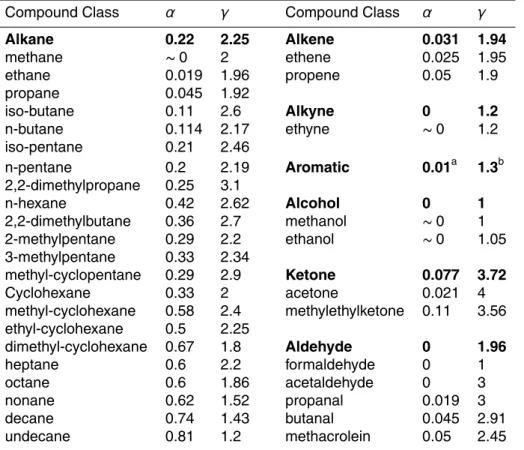
Forαi specific to alkanes, we use temperature- and pressure-dependent,
compound-specificαi values (Carter and Atkinson, 1989) and include contributions of secondary
organic nitrate formation after alkoxy radical isomerization reactions which can be in-creasingly important for alkanes larger than butane. This increases the individual or-ganic nitrate yield by up to 30 %, generally proportional to the size of the molecule. The
10
compound-specificα values are summarized in Table 2.
Theαi value for aldehydes were treated as having the same nitrate yield as the RO2
having one less carbon, since the major reaction with OH involves aldehydic hydrogen
abstraction and decomposition following reaction with NO to give a CO2 and a Cn−1
alkyl radical. α for ketones were estimated using the same method as detailed for
15
alkanes. Methanol and ethanol are presumed to have zero nitrate yield, since their
reactions with O2after hydrogen abstraction to form carbonyls and HO2are dominant.
Finally, the nitrate yields for aromatics were set to 1 % in this analysis, following the yield of benzyl nitrate from toluene oxidation (Gery et al., 1985; Atkinson and Aschmann, 1989; Atkinson, 1994). The alkyl nitrate yields from aromatics are likely related to the
20
ring-opening products and are still poorly constrained.
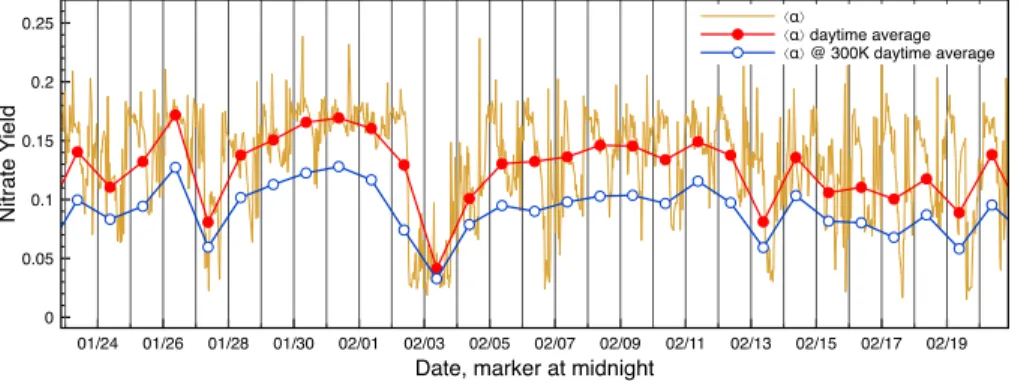
The average nitrate formation yield,hαi, as calculated above including all VOC and
CO measurements throughout the campaign period, is plotted in Fig. 3 as instanta-neous values (gold) and as a daytime (08:00 a.m.–06:00 p.m.) average (red filled sym-bol). The organic nitrate yield ranged from 3 % to 15 % with low values corresponding
25
to periods of high winds (e.g. 3 February). Variation in VOC concentration and compo-sition is the dominant factor controlling the day to day variation as well as the variation
over each day. Daytime averaged values of hαi calculated at a temperature of 300 K
ACPD
14, 17401–17438, 2014Low temperatures enhance organic nitrate formation
L. Lee et al.
Title Page
Abstract Introduction
Conclusions References
Tables Figures
◭ ◮
◭ ◮
Back Close
Full Screen / Esc
Printer-friendly Version Interactive Discussion
Discussion
P
a
per
|
Discus
sion
P
a
per
|
Discussion
P
a
per
|
Discussion
P
a
per
|
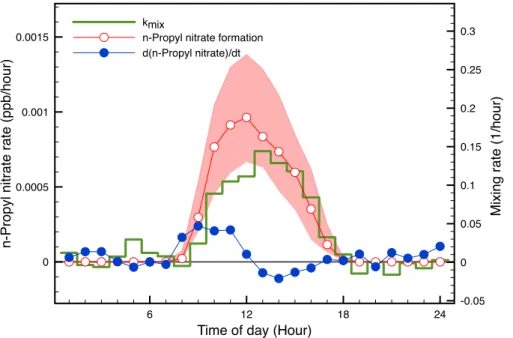
3.2.2 Oxidation-production method
Our second approach to estimatingαis based primarily on theΣAN measurements. In
this case,hαi can be expressed as the ratio of theΣAN production rate over the total
VOC consumption rate (Eq. 2a).
hαi= p(ΣANs)
[OH]·P
i
ki[xi]
(2a)
5
p(ΣANs)=d(ΣANs)
dt +kmix·ΣANs (2b)
[OH]=f(X
i
ki[xi],J,hα′i) (2c)
The individual terms in Eq. (2a) can be derived from observations, as shown in Eq.
(2b) and (2c). The total production rate ofΣANs (p(ΣANs)) is expressed, according to
10
mass balance, as the sum of the rate of change of the observedΣAN concentration and
an overall loss term in Eq. (2b). Chemical losses ofΣANs are found to be negligible
compared with turbulent mixing out of the boundary layer. To estimate this effective
loss rate constant “kmix”, we employ a tracer method by solving Eq. (2b) using n-propyl
nitrate concentrations measured by GC-MS. We chose n-propyl nitrate because its
15
expected loss is also dominated by mixing due to the long chemical lifetime, and its production rate can be calculated independently from measured VOC precursors. Note here that the OH concentration is needed to calculate the production rate of n-propyl nitrate, as well as the VOC consumption rate in the denominator of Eq. (2a). The OH
concentration is a function of VOC reactivity and photolysis rates (J values) as well
20
as theα value for the radical recycling efficiency. Due to the dependence of the OH
concentration on the nitrate yield, it is not possible to representα in a closed functional
form using all other variables. Therefore, the set of equations must be solved iteratively
ACPD
14, 17401–17438, 2014Low temperatures enhance organic nitrate formation
L. Lee et al.
Title Page
Abstract Introduction
Conclusions References
Tables Figures
◭ ◮
◭ ◮
Back Close
Full Screen / Esc
Printer-friendly Version Interactive Discussion
Discussion
P
a
per
|
Discus
sion
P
a
per
|
Discussion
P
a
per
|
Discussion
P
a
per
|
The calculations proceeds as follows by calculating the following: (1) OH
concentra-tion and VOC consumpconcentra-tion rate, (2) mixing rate estimates, (3)ΣANs formation rate and
hαi.
1. OH concentration and VOC consumption rate:
We used photolysis rates of O3, NO2, NO3, HONO, ClNO2, acetaldehyde,
ace-5
tone, formaldehyde and HNO3 to calculate OH and HO2 production rates. OH
formation from alkene ozonolysis reactions was negligible. The medium total
rad-ical production of 2.5 ppb day−1 is similar to the value reported by Edwards et al.
(2013). Data for NO, NO2 and VOCs coupled with literature values of OH
reac-tion rate constants corrected for campaign measured temperature and pressure
10
dependence (Atkinson et al., 2004, 2006) were then used for OH and HO2
calcu-lations including radical recycling. The resulting VOC consumption rate is shown in Fig. 4. Note the VOC consumption rate profile conforms more to the shape of
the radical source strength (OH and HO2 formation rate derived from photolysis,
same shape as solar irradiation) than to the OH concentration, consistent with the
15
notion that VOCs are the major reaction partner with OH.
2. Mixing rate estimation:
We estimate the dilution loss (kmix) forΣANs concentration by substituting [ΣANs]
with n-propyl nitrate concentration in Eq. (2b). The time derivative of n-propyl
ni-trate concentration was calculated using a finite difference method, followed by
20
application of a 2 h running mean to smooth hourly data. Kinetic studies dictate
that ∼24 % of the OH reaction with propane at 273 K yielded a primary alkyl
radical, (Droege and Tully, 1986) which promptly reacted with O2to form the
cor-responding peroxy radical. Larger alkane molecules can also yield n-propyl alkyl radical as a result of alkoxy radical decomposition from the appropriate structure,
25
ACPD
14, 17401–17438, 2014Low temperatures enhance organic nitrate formation
L. Lee et al.
Title Page
Abstract Introduction
Conclusions References
Tables Figures
◭ ◮
◭ ◮
Back Close
Full Screen / Esc
Printer-friendly Version Interactive Discussion
Discussion
P
a
per
|
Discus
sion
P
a
per
|
Discussion
P
a
per
|
Discussion
P
a
per
|
by the 25 and 75 percentiles in the shaded area. Plotted in blue is the median value of time derivative of n-propyl nitrate concentration showing a diurnal pattern for which peak concentration was reached at noon time when the time derivative crosses the zero line. The initial concentration increase roughly coincides with the start of photochemical reaction, as is also marked by the onset of n-propyl nitrate
5
formation rate. The negative portion of the blue trace in the afternoon then corre-sponds to faster dilution due both to turbulence and to the elevated concentration.
These values are sufficient to solve for the time-varying dilution rate constant,
kmix, shown in Fig. 5 as green line with dashed traces bounding the interquartile
range. Note the slight delay (∼1 h) in the daily maximum of the dilution rate
con-10
stant when compared with the peak of n-propyl nitrate formation rate. As vertical turbulence was promoted by surface heating, this delay is a reasonable conse-quence of the expected lag in the mixing rate. The median daily maximum mixing rate shows a time constant of 6 h, much more rapid than other loss processes such as the OH oxidative lifetime of n-propyl nitrate of over 150 h under the OH
15
concentration of 2×106cm−3(Fig. 4) and a photolysis lifetime of over 200 h, (Luke
et al., 1989) consistent with our initial assumption that chemical losses are small.
3. ΣANs formation rate and hαi:
Using the kmix calculated above, the ΣAN formation rate was estimated using
Eq. (2b). We then inserted this ΣAN formation rate and VOC consumption rate
20
back into Eq. (2a) to obtain the impliedhαivalue based on the field observations
and also the initial guess ofhα′i. For time periods whenhαimismatcheshα′i,hα′i
is adjusted towardhαiaccordingly and the calculation repeated to achieve
consis-tency. To reduce the number of points needed for calculation, we only estimated
one self-consistenthαivalue for each day by averaging from 8 a.m. to 6 p.m., the
25
same as the averaging window used for our first method.
ACPD
14, 17401–17438, 2014Low temperatures enhance organic nitrate formation
L. Lee et al.
Title Page
Abstract Introduction
Conclusions References
Tables Figures
◭ ◮
◭ ◮
Back Close
Full Screen / Esc
Printer-friendly Version Interactive Discussion
Discussion
P
a
per
|
Discus
sion
P
a
per
|
Discussion
P
a
per
|
Discussion
P
a
per
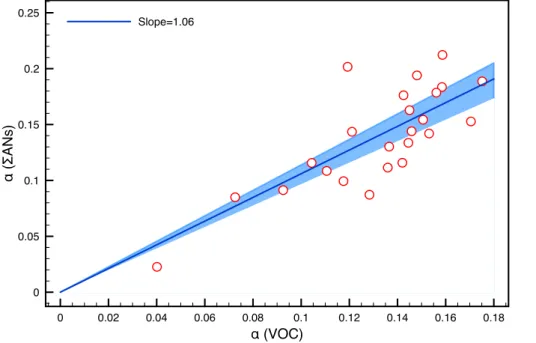
|
compare and the two methods are nearly identical, yielding a slope of 1.06 and
R2=0.61. The similarity in results of the two methods lends support to the
esti-mates ofαand confirms the importance of a significant temperature dependence
to the value ofαaffecting the UBWOS chemistry.
4 Discussion
5
The relatively high value observed for the average nitrate yield,hαi, of∼15 %, is a
di-rect consequence of low temperatures and the presence of heavy alkanes, a special condition created by natural gas and oil extraction operations in the basin. In the
follow-ing sections, we discuss how this elevated nitrate yield affects the fate of NOx emitted
into the basin and the rate of local O3production.
10
4.1 Fate of NOx
Organic nitrate formation was a significant chemical loss for NOxin the Uintah Basin.
We calculated that alkyl nitrate formation is 50 % faster than HNO3 formation during
the low wind periods, of 0.23 ppb h−1 vs. 0.16 ppb h−1 using the estimated noontime
OH concentration. Together, this amounts to a NOxchemical lifetime of 17 h, with
rela-15
tive branching of 59 % to alkyl nitrate formation and 41 % to HNO3formation. PAN and
other peroxyacyl nitrate compounds were not observed to have high production rates
based on measuredΣPNs and PAN concentration and direct calculation of their
forma-tion rate from VOC composiforma-tion including aldehydes. We estimate a lower and upper
limit in noontime median net production of 0.01 to 0.06 ppb PAN h−1, using bottom-up
20
(VOC speciation) and top-down (observed PAN concentration and dilution rate assum-ing zero background PAN concentration) methods, respectively. This corresponds to
PAN representing a maximum of ∼18 % of the NOx sink. Alkyl nitrate formation is
therefore the single most important chemical loss pathway for NOxas well as the most
important terminator for OH chain propagation. Note that, althoughΣAN formation is
ACPD
14, 17401–17438, 2014Low temperatures enhance organic nitrate formation
L. Lee et al.
Title Page
Abstract Introduction
Conclusions References
Tables Figures
◭ ◮
◭ ◮
Back Close
Full Screen / Esc
Printer-friendly Version Interactive Discussion
Discussion
P
a
per
|
Discus
sion
P
a
per
|
Discussion
P
a
per
|
Discussion
P
a
per
|
the largest chemical sink, mixing out of the basin is the dominant overall loss for NOx
emitted. We estimate 68 % of NOxloss is to transport out of the basin.
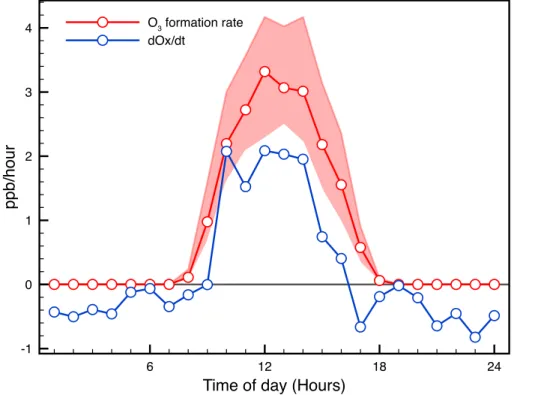
4.2 O3formation
O3 formation is closely related to the formation of organic nitrates, since the reaction
channels lead from a branching point in a common pathway. Similar to our treatment of
5
VOC-specificα values, we calculated, for each measured VOC molecule, the average
number of O3molecules generated in a single event of OH initiated oxidation, denoted
asγin Table 2. Note that our definition and estimate forγincludes the contribution from
multi-generation alkyl nitrate formation, making it slightly different from previous
calcu-lations (Rosen et al., 2004; Perring et al., 2013; Farmer et al., 2011) (see Appendix
10
C). The O3production rate is then a product of the ensemble-averagedγand the VOC
consumption rate calculated above, as plotted in Fig. 7. The difference between the O3
production rate and the rate of change in O3 concentration signifies the contribution
of mixing into the background air. When compared with the production characteristics of n-propyl nitrate in Fig. 4, it is apparent that dilution loss is much more important for
15
the case of n-propyl nitrate (>80 % of the formation rate) than for O3(∼30 % of
forma-tion rate). Using thekmix derived from n-propyl nitrate formation, the local O3 budget
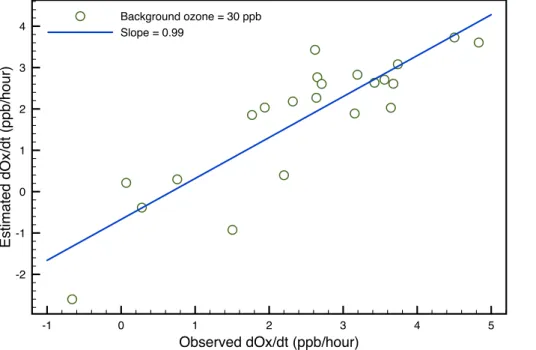
of the whole campaign period can be closed with a background O3 concentration in
the range of 20–35 ppb, consistent with observations during high wind periods. This also reinforces the notion that our estimate for turbulent mixing is representative. To
20
reproduce the short-term variations in O3 production over a 72 h period with a fixed
background O3 level of 30 ppb, we estimate the expected change in Ox (O3+ NO2)
concentration using the mass balance equation (Eq. 2b) to find reasonable agreement with the observations (Fig. 8).
Regarding the relative production of O3toΣANs, the averagep(O3)/p(ΣANs)
calcu-25
lated as γ/αfor UBWOS is 15. For comparison, a value of 6.2–7.5 was reported for
ACPD
14, 17401–17438, 2014Low temperatures enhance organic nitrate formation
L. Lee et al.
Title Page
Abstract Introduction
Conclusions References
Tables Figures
◭ ◮
◭ ◮
Back Close
Full Screen / Esc
Printer-friendly Version Interactive Discussion
Discussion
P
a
per
|
Discus
sion
P
a
per
|
Discussion
P
a
per
|
Discussion
P
a
per
|
heavier organics. By comparison, a typical industrial city plume (Rosen et al., 2004) measured around Houston during Texas Air Quality Study 2000 has a value of 29–41,
a direct result from lowα value (6.5–4.7 %) caused by high temperature (∼40◦C) and
relatively low contribution from large alkanes.
4.3 Temperature
5
Currently, none of the chemical mechanisms commonly employed in the chemical
transport models for regional O3 predictions have incorporated the temperature
de-pendence of alkyl nitrate yields. Since alkyl nitrate formation is a radical termination reaction, reduction in temperature decreases the OH recycling probability and
short-ens the OH radical chain length. For the 2012 UBWOS campaign the effect is to
re-10
duce the radical propagation chain length from a noontime median of 3.2 (300 K) to
2.6 (273 K). Since the chain length is directly proportional to the O3 production rate,
this corresponds to a 20 % decrease in the O3 formation rate. Table 3 shows the
es-timated maximum Ox concentration in a multi-day low wind accumulation event in the
Uintah Basin based on the observed alkyl nitrate yield. We compare a calculation at
15
300 K to one at 273 K. Note that for a snowless winter condition, such as encountered
in UBWOS 2012, the prediction matches well with the observed maximum hourly Ox
concentration of 51 ppb in the afternoon of 18 February 2012. While estimating theα
value at 300 K always yields a higher predicted O3 concentration, the over prediction
is greatest for the simulated snow condition (right most column) when persistent snow
20
cover increases the photolysis rate and stabilizes the boundary layer impeding mixing.
5 Conclusion
We presented an analysis of field observations obtained in the Uintah Basin during winter 2012 in Utah, USA. We find that the field data can be used to derive the
tem-perature dependence of the ensemble-averaged nitrate yield,hαi, and that this value
ACPD
14, 17401–17438, 2014Low temperatures enhance organic nitrate formation
L. Lee et al.
Title Page
Abstract Introduction
Conclusions References
Tables Figures
◭ ◮
◭ ◮
Back Close
Full Screen / Esc
Printer-friendly Version Interactive Discussion
Discussion
P
a
per
|
Discus
sion
P
a
per
|
Discussion
P
a
per
|
Discussion
P
a
per
|
is consistent with a parameterization derived from laboratory experiments. Including the proper temperature dependence based on the dominating VOC species should be
considered for models aimed at estimating local O3 concentrations in order to avoid
substantial errors (+15 % at 0◦C from 27◦C values).
Appendix A: O3pyrolysis correction forΣANs (380◦C) channel
5
It was necessary to correct for apparent negative signals observed in theΣANs signal
(ΣANs channel showing less signal level than the ΣPNs channel). The cause of this
interference was O3pyrolysis to yield O atom in the TD oven at elevated temperature.
In the absence of organic molecules, the O atom can serve as a promoter for NO and
NO2interconversion reaction, as illustrated in Reactions (R4)–(R7).
10
O3+M→O2+O+M (R4)
O2+O+M→O3+M (R5)
NO2+O→NO+O2 (R6)
NO+O+M→NO2+M (R7)
NO and NO2 are interconverted at a cost of one O atom whose steady state
concen-15
tration is generally controlled by the forward and reverse Reactions (R4) and (R5). If
sufficient time is given, NO and NO2will ultimately reach an equilibrium ratio which can
be calculated from the reaction ratek1.2 and k1.3 (of Reactions R5 and R6,
respec-tively) with pressure dependence. From the O3 pyrolysis rate and the gas residence
time of 0.17 s in our TD oven region, only ΣANs channel at 380◦C should generate
20
sufficient O atom to significantly alter the NO2 concentration. To confirm this effect,
we performed a series of lab experiments under NOx and O3 concentrations
cover-ing the range observed durcover-ing the UBWOS campaign in the presence of ∼2 ppb of
2-ethylhexyl nitrate, a simple alkyl nitrate standard available from Sigma Aldrich as
a surrogate for the collection ofΣANs in Utah. Figure A1 demonstrates the result from
ACPD
14, 17401–17438, 2014Low temperatures enhance organic nitrate formation
L. Lee et al.
Title Page
Abstract Introduction
Conclusions References
Tables Figures
◭ ◮
◭ ◮
Back Close
Full Screen / Esc
Printer-friendly Version Interactive Discussion
Discussion
P
a
per
|
Discus
sion
P
a
per
|
Discussion
P
a
per
|
Discussion
P
a
per
|
a temperature scan experiment when the inlet oven temperature of cell 1 was scanned
upward from 180◦C to 380◦C, the operating temperature ofΣANs channel in the field.
The red trace represents the NO2 signal from cell 1, while the black trace is the NO2
signal from cell 3 whose inlet was unheated. Since there was no peroxy nitrate in the
system, at 180◦C cell 3 only detect the same amount of NO2as the ambient
temper-5
ature cell 1. However, starting from∼200◦C alkyl nitrate started to thermal dissociate,
giving extra NO2 signal as the red trace increased relative to the black trace. At
tem-perature beyond 280◦C effects due to O3 pyrolysis started to reduce the excess NO2
signal, presumably by the interconversion reaction mentioned above and we see the
red trace eventually dropped below the black trace at around 320◦C. This interference
10
thus generated substantial negativeΣANs signal when we subtract the 180◦C channel
from 380◦C channel. Indeed, significant portions of uncorrected night timeΣANs
sig-nals throughout the campaign yielded negative values including negative spikes
corre-lated with positive NO2spikes from nearby road traffic emissions. This effect was most
prominent when high NO2 concentration existed so that the excess ΣANs signal was
15
relatively small on the 380◦C channel. Considering that under the same O3
concen-tration the fraction of NO2converted due to O atom chemistry was a constant, larger
overall NO2concentration corresponded to a larger overall NO2reduction which could
easily overwhelm the originalΣANs signal to introduce negative values when high
tem-perature channel was subtracted from lower temtem-perature ones. For example, we have
20
performed high temperature box model simulations on O3pyrolysis reactions inside the
TD oven with a residence time of 0.17 s. At an O3concentration of 30 ppb the amount
of NO2 loss through 380◦C was around 6 %. This indicates that if the ΣANs fraction
within a sample is less than 6 % of the total concentration from NO2,ΣPNs andΣANs
combined, a negative value will result. The O atom chemistry outlined in Reactions
25
(R4)–(R7) was further complicated by the presence of organics, especially when initial
NO2concentration was small as signal loss in lab experiments was always more than
can be explained in the absence of organics. Since we were uncertain of the effect
ACPD
14, 17401–17438, 2014Low temperatures enhance organic nitrate formation
L. Lee et al.
Title Page
Abstract Introduction
Conclusions References
Tables Figures
◭ ◮
◭ ◮
Back Close
Full Screen / Esc
Printer-friendly Version Interactive Discussion
Discussion
P
a
per
|
Discus
sion
P
a
per
|
Discussion
P
a
per
|
Discussion
P
a
per
|
equation derived directly from in-lab observations under NOx and O3 concentrations
relevant to UBWOS condition was currently used for such correction. Equation (A1)
shows the relation of fractional signal lost (r) as a function of the observed total signal
S380of the 380
◦
C channel (NO2+ΣPNs+ΣANs) and O3concentration with all
parame-ters obtained through fitting of experimental data. The corrected signal (S380′ ) was thus
5
obtained with Eq. (A2).
r=(0.0694×ln(S380)−0.308)×(0.0115×[O3]+0.557) (A1)
S′380=
S380
1+r (A2)
Appendix B: VOCα calculation considering multiple generation RO2
10
formation
Explicit examples for calculatingα are given in the following sections for OH-initiated
oxidation of ethane and propane in the presence of NO. Further generalizations to other organics are also described.
B1 α for ethane
15
Estimatingα for ethane is relatively straightforward. Daytime oxidation of ethane starts
with an initial hydrogen extraction by OH radical followed by O2 addition to the alkyl
radical formed. Only a single isomer of alkyl peroxy radical is involved and no signifi-cant decomposition channel exists for the ethyl alkoxy radical formed from NO reaction that does not yield organic nitrate, as shown in Fig. B1. We simply state here and will
20
demonstrate in later section that the dominant fate of RO2 radicals in the basin were
reaction with NO because RO2-RO2and RO2-HO2reactions are minor during the day.
ACPD
14, 17401–17438, 2014Low temperatures enhance organic nitrate formation
L. Lee et al.
Title Page
Abstract Introduction
Conclusions References
Tables Figures
◭ ◮
◭ ◮
Back Close
Full Screen / Esc
Printer-friendly Version Interactive Discussion
Discussion
P
a
per
|
Discus
sion
P
a
per
|
Discussion
P
a
per
|
Discussion
P
a
per
|
in this simple case is the same as the specific branching ratio of the ethylperoxy radical at 0.019.
B2 α for propane
To calculate the overall nitrate yield for propane, the dominant product channels should be traced, as illustrated in Fig. B2. Two isomers are formed through hydrogen
ex-5
tractions from either the primary or secondary carbon, giving n-propylperoxy and iso-propylperoxy radical in a relative yield of 24 % and 76 %, respectively. The overall
ni-trate branching ratio can then be calculated if the specificα for each peroxy isomer is
known. Starting from n-propylperoxy radical, the direct reaction with NO gives n-propyl nitrate with a relative yield of 2.1 % calculated according to the Carter and Atkinson’s
10
method at 273 K and 842 mBar, representative of campaign condition. The remain-ing portion of the channel proceedremain-ing through alkoxy radical reactions has a further
branching of decomposition reaction (rather than reacting with O2) to form a
formalde-hyde and an ethyl radical which promptly reacts with O2 to give ethylperoxy radical.
The relative yield of decomposition vs. O2 reaction can be calculated from the
re-15
spective reaction rates reported in the literature. We used a decomposition rate of
846 s−1 (Curran, 2006) and the product of O2 reaction rate with O2 concentration
giv-ing a first-order rate constant of 4×10⁴s−1 for the O2 channel. Branching ratios are
hence 2 % and 98 % for decomposition and O2 reaction. The ethylperoxy radical from
the decomposition channel can then react further with NO to give organic nitrates with
20
a yield of 0.019, calculated in the previous section. Summing up both yields scaled by the individual channel strength, we have the specific nitrate yield of n-propylperoxy
radical as: (0.019×0.02×0.979+0.021)=0.0214. Note the correction from the
addi-tional ethylperoxy radical nitrate yield is almost negligible, due to the decomposition channel strength of only 2 %. However, for larger molecules, typically starting from
25
decom-ACPD
14, 17401–17438, 2014Low temperatures enhance organic nitrate formation
L. Lee et al.
Title Page
Abstract Introduction
Conclusions References
Tables Figures
◭ ◮
◭ ◮
Back Close
Full Screen / Esc
Printer-friendly Version Interactive Discussion
Discussion
P
a
per
|
Discus
sion
P
a
per
|
Discussion
P
a
per
|
Discussion
P
a
per
|
position reaction a methylperoxy radical is formed. Since methylperoxy radical has lit-tle yield for methylnitrate formation, the total specific nitrate yield for iso-propylperoxy
radical is just the direct yield of 5.2 %. The overall α for propane-OH reaction is
hence the ensemble average of the specific nitrate yield of all peroxy isomers, namely:
(0.24×0.021+0.76×0.052)=0.045.
5
B3 α for higher alkanes and other organics
Using the method detailed above for propane, we carried out an extended estimation for alkanes up to undecane which is the largest alkane reported from GC-MS data. The results are summarized in Table 2. It is noted here that certain simplifications were
necessary for this calculation. For example, in estimating α for more complex RO2
10
radicals from higher-generation oxidation products we ignored the possible contribution of other oxygen-containing functional groups toward the estimated yield given by the Carter and Atkinson parameterization so that only carbon number was considered. Further, rate constants used to estimate the relative branching ratios of alkoxy radical reactions were limited to available literature values, generally around 298 K. As carbon
15
chain length becomes longer, experimental data regarding O2 reaction, isomerization
and decomposition rates become scarce and the data available for the most similar structure are used.
Appendix C: Differences in definition ofγused in this work
Theγ value, used to denote the amount of O3 molecule generated from OH-initiated
20
oxidation of an organic molecule in this work, is different from the definition of
previ-ous works that focus on only single generation RO2chemistry in 2 respects, described
as following. First, γ has commonly been given a value of 2 for two O3 molecules
being generated per OH-initiated oxidation of VOCs, from the formation of HO2 and
NO2 each. This is a good approximation for small alkanes of which isomerization is
ACPD
14, 17401–17438, 2014Low temperatures enhance organic nitrate formation
L. Lee et al.
Title Page
Abstract Introduction
Conclusions References
Tables Figures
◭ ◮
◭ ◮
Back Close
Full Screen / Esc
Printer-friendly Version Interactive Discussion
Discussion
P
a
per
|
Discus
sion
P
a
per
|
Discussion
P
a
per
|
Discussion
P
a
per
|
not important, but can be erroneous otherwise. For example, in the absence of organic
nitrate formation channel, we estimate γ for n-hexane to be 3.2 due to the efficient
isomerization reaction of hydrogen abstraction by the 2-alkoxy or 3-alkoxy radical pro-duced, generating a new alkyl radical and an alcohol group. The presence of large
alkanes, up to undecane, necessitates a more careful treatment. Second,γ has been
5
used to calculate the ratio of O3production rate overΣANs production rate, formulated
asγ(1−α)/α. The factor (1−α) in the numerator implies thatγ was estimated under
the assumption of zero nitrate formation. (1−α) therefore accounted for the fraction
of reaction that actually proceeded to form O3. This is only exact if VOC+OH
reac-tion only forms a single generareac-tion of RO2molecule, once again a valid assumption for
10
small VOC only. For larger alkanes there exist a non-negligible fraction of higher
gener-ation RO2reactions from isomerization reactions and we must account for the effective
number of NO2 and HO2 formed in a cumulative manner over extended generations.
This meansγ andα are related by the structure of the molecule under consideration.
Our listedγ values in Table 2 is then the better average number of O3 generated per
15
OH-initiated oxidation with alkyl nitrate formation considered, or in the same spirit, the
“γ(1−α)” value considered over multi-generation reactions. In Table 2, we observe an
increasing trend ofγgoing from methane to around hexane as larger alkanes are more
susceptible to isomerization and further radical reactions, converting more NO to NO2.
This trend does not continue, however, with further increase of alkane size because of
20
the competing effect of increasing organic nitrate yield, eventually reduces the amount
of alkoxy radical formed.
Acknowledgements. The authors acknowledge the NOAA office of global programs: NA13OAR4310067 and NSF AGS-1120076 for their support of this research. The authors also acknowledge Jim Roberts for his hospitality and support in PAN, HONO and ClNO2 data, and
25
ACPD
14, 17401–17438, 2014Low temperatures enhance organic nitrate formation
L. Lee et al.
Title Page
Abstract Introduction
Conclusions References
Tables Figures
◭ ◮
◭ ◮
Back Close
Full Screen / Esc
Printer-friendly Version Interactive Discussion
Discussion
P
a
per
|
Discus
sion
P
a
per
|
Discussion
P
a
per
|
Discussion
P
a
per
|
References
Atkinson, R.: Gas-phase tropospheric chemistry of organic-compounds, J. Phys. Chem. Ref. Data, ISBN: 156396340X, 1994.
Atkinson, R. and Aschmann, S. M.: Rate constants for the gas-phase reactions of the OH radical with a series of aromatic-hydrocarbons at 296±2 K, Int. J. Chem. Kinet., 21, 355–
5
365, doi:10.1002/kin.550210506, 1989.
Atkinson, R., Carter, W. P. L., and Winer, A. M.: Effects of temperature and pressure on alkyl nitrate yields in the NOx photooxidations of normal-pentane and normal-heptane, J. Phys. Chem., 87, 2012–2018, doi:10.1021/j100234a034, 1983.
Atkinson, R., Baulch, D. L., Cox, R. A., Crowley, J. N., Hampson, R. F., Hynes, R. G.,
10
Jenkin, M. E., Rossi, M. J., and Troe, J.: Evaluated kinetic and photochemical data for at-mospheric chemistry: Volume I - gas phase reactions of Ox, HOx, NOx and SOx species, Atmos. Chem. Phys., 4, 1461–1738, doi:10.5194/acp-4-1461-2004, 2004.
Atkinson, R., Baulch, D. L., Cox, R. A., Crowley, J. N., Hampson, R. F., Hynes, R. G., Jenkin, M. E., Rossi, M. J., Troe, J., and IUPAC Subcommittee: Evaluated kinetic and
photo-15
chemical data for atmospheric chemistry: Volume II – gas phase reactions of organic species, Atmos. Chem. Phys., 6, 3625–4055, doi:10.5194/acp-6-3625-2006, 2006.
Carter, W. P. L. and Atkinson, R.: Alkyl nitrate formation from the atmospheric pho-tooxidation of alkanes – a revised estimation method, J. Atmos. Chem., 8, 165–173, doi:10.1007/bf00053721, 1989.
20
Curran, H. J.: Rate constant estimation for C1 to C4 alkyl and alkoxyl radical decomposition, Int. J. Chem. Kinet., 38, 250–275, doi:10.1002/kin.20153, 2006.
Day, D. A., Wooldridge, P. J., Dillon, M. B., Thornton, J. A., and Cohen, R. C.: A ther-mal dissociation laser-induced fluorescence instrument for in situ detection of NO2, per-oxy nitrates, alkyl nitrates, and HNO3, J. Geophys. Res.-Atmos., 107, ACH 4-1–ACH 4-14,
25
doi:10.1029/2001jd000779, 2002.
Droege, A. T. and Tully, F. P.: Hydrogen-atom abstraction from alkanes by OH. 3. Propane, J. Phys. Chem., 90, 1949–1954, doi:10.1021/j100400a042, 1986.
Edwards, P. M., Young, C. J., Aikin, K., deGouw, J., Dubé, W. P., Geiger, F., Gilman, J., Helmig, D., Holloway, J. S., Kercher, J., Lerner, B., Martin, R., McLaren, R., Parrish, D. D.,
30
win-ACPD
14, 17401–17438, 2014Low temperatures enhance organic nitrate formation
L. Lee et al.
Title Page
Abstract Introduction
Conclusions References
Tables Figures
◭ ◮
◭ ◮
Back Close
Full Screen / Esc
Printer-friendly Version Interactive Discussion
Discussion
P
a
per
|
Discus
sion
P
a
per
|
Discussion
P
a
per
|
Discussion
P
a
per
|
ter: simulations of a snow-free season in the Uintah Basin, Utah, Atmos. Chem. Phys., 13, 8955–8971, doi:10.5194/acp-13-8955-2013, 2013.
Farmer, D. K., Perring, A. E., Wooldridge, P. J., Blake, D. R., Baker, A., Meinardi, S., Huey, L. G., Tanner, D., Vargas, O., and Cohen, R. C.: Impact of organic nitrates on urban ozone produc-tion, Atmos. Chem. Phys., 11, 4085–4094, doi:10.5194/acp-11-4085-2011, 2011.
5
Gery, M. W., Fox, D. L., Jeffries, H. E., Stockburger, L., and Weathers, W. S.: A continuous stirred tank reactor investigation of the gas-phase reaction of hydroxyl radicals and toluene, Int. J. Chem. Kinet., 17, 931–955, doi:10.1002/kin.550170903, 1985.
Goldan, P. D., Kuster, W. C., Williams, E., Murphy, P. C., Fehsenfeld, F. C., and Meagher, J.: Nonmethane hydrocarbon and oxy hydrocarbon measurements during the 2002 New
Eng-10
land Air Quality Study, J. Geophys. Res.-Atmos., 109, D21309, doi:10.1029/2003jd004455, 2004.
Grund, C. J., Banta, R. M., George, J. L., Howell, J. N., Post, M. J., Richter, R. A., and Weick-mann, A. M.: High-resolution Doppler lidar for boundary layer and cloud research, J. Atmos. Ocean. Tech., 18, 376–393, doi:10.1175/1520-0426(2001)018<0376:hrdlfb>2.0.co;2, 2001.
15
Kliner, D. A. V., Daube, B. C., Burley, J. D., and Wofsy, S. C.: Laboratory investigation of the cat-alytic reduction technique for measurement of atmospheric NOy, J. Geophys. Res.-Atmos., 102, 10759–10776, doi:10.1029/96jd03816, 1997.
Luke, W. T., Dickerson, R. R., and Nunnermacker, L. J.: Direct measurements of the photolysis rate coefficients and Henry law constants of several alkyl nitrates, J. Geophys. Res.-Atmos.,
20
94, 14905–14921, doi:10.1029/JD094iD12p14905, 1989.
Neuman, J. A., Aikin, K. C., Atlas, E. L., Blake, D. R., Holloway, J. S., Meinardi, S., Nowak, J. B., Parrish, D. D., Peischl, J., Perring, A. E., Pollack, I. B., Roberts, J. M., Ryerson, T. B., and Trainer, M.: Ozone and alkyl nitrate formation from the Deepwater Horizon oil spill at-mospheric emissions, J. Geophys. Res.-Atmos., 117, D09305, doi:10.1029/2011jd017150,
25
2012.
Perring, A. E., Bertram, T. H., Wooldridge, P. J., Fried, A., Heikes, B. G., Dibb, J., Crounse, J. D., Wennberg, P. O., Blake, N. J., Blake, D. R., Brune, W. H., Singh, H. B., and Cohen, R. C.: Airborne observations of total RONO2: new constraints on the yield and lifetime of isoprene nitrates, Atmos. Chem. Phys., 9, 1451–1463, doi:10.5194/acp-9-1451-2009, 2009.
30
ACPD
14, 17401–17438, 2014Low temperatures enhance organic nitrate formation
L. Lee et al.
Title Page
Abstract Introduction
Conclusions References
Tables Figures
◭ ◮
◭ ◮
Back Close
Full Screen / Esc
Printer-friendly Version Interactive Discussion
Discussion
P
a
per
|
Discus
sion
P
a
per
|
Discussion
P
a
per
|
Discussion
P
a
per
|
persistence of ΣRONO2 in the Mexico City plume, Atmos. Chem. Phys., 10, 7215–7229,
doi:10.5194/acp-10-7215-2010, 2010.
Perring, A. E., Pusede, S. E., and Cohen, R. C.: An observational perspective on the atmo-spheric impacts of alkyl and multifunctional nitrates on ozone and secondary organic aerosol, Chem. Rev., 113, 5848–5870, doi:10.1021/cr300520x, 2013.
5
Roberts, J. M., Osthoff, H. D., Brown, S. S., Ravishankara, A. R., Coffman, D., Quinn, P., and Bates, T.: Laboratory studies of products of N2O5uptake on Cl−containing substrates, Geo-phys. Res. Lett., 36, L20808, doi:10.1029/2009gl040448, 2009.
Rosen, R. S., Wood, E. C., Wooldridge, P. J., Thornton, J. A., Day, D. A., Kuster, W., Williams, E. J., Jobson, B. T., and Cohen, R. C.: Observations of total alkyl nitrates
dur-10
ing Texas Air Quality Study 2000: implications for O3 and alkyl nitrate photochemistry, J. Geophys. Res., 109, D07303, doi:10.1029/2003jd004227, 2004.
Schnell, R. C., Oltmans, S. J., Neely, R. R., Endres, M. S., Molenar, J. V., and White, A. B.: Rapid photochemical production of ozone at high concentrations in a rural site during winter, Nat. Geosci., 2, 120–122, doi:10.1038/ngeo415, 2009.
15
Thaler, R. D., Mielke, L. H., and Osthoff, H. D.: Quantification of nitryl chloride at part per trillion mixing ratios by thermal dissociation cavity ring-down spectroscopy, Anal. Chem., 83, 2761– 2766, doi:10.1021/ac200055z, 2011.
Thornton, J. A., Wooldridge, P. J., and Cohen, R. C.: Atmospheric NO2: in situ
laser-induced fluorescence detection at parts per trillion mixing ratios, Anal. Chem., 72, 528–539,
20
doi:10.1021/ac9908905, 2000.
ACPD
14, 17401–17438, 2014Low temperatures enhance organic nitrate formation
L. Lee et al.
Title Page
Abstract Introduction
Conclusions References
Tables Figures
◭ ◮
◭ ◮
Back Close
Full Screen / Esc
Printer-friendly Version Interactive Discussion
Discussion
P
a
per
|
Discus
sion
P
a
per
|
Discussion
P
a
per
|
Discussion
P
a
per
|
Table 1.Median OH reactivity and associated formation rates at local noon.
Compound OH Reactivity p(ΣANs)∗ p(O3)∗
Class (s−1) (ppt h−1) (ppt h−1)
Alkane C1–C11 5.02 172 1760
Alkene C2-C3 0.15 0.71 44
Alkyne C2 0.013 0 2.4
Aromatic C6–C9 0.58 0.90 120
Alcohol C1–C2 0.31 0 48
Ketone C3–C4 0.0084 ∼0 0.37
Aldehyde C1–C4 0.44 0 130
CO 0.95 0 150
NO 0.61 0 0
NO2 0.82 0 0
Total 8.90 174 2250
∗Median noon time [OH]
ACPD
14, 17401–17438, 2014Low temperatures enhance organic nitrate formation
L. Lee et al.
Title Page
Abstract Introduction
Conclusions References
Tables Figures
◭ ◮
◭ ◮
Back Close
Full Screen / Esc
Printer-friendly Version Interactive Discussion
Discussion
P
a
per
|
Discus
sion
P
a
per
|
Discussion
P
a
per
|
Discussion
P
a
per
|
Table 2.Summary of specific organic nitrate and ozone yield calculated at 0◦C.
Compound Class α γ Compound Class α γ
Alkane 0.22 2.25 Alkene 0.031 1.94
methane ∼0 2 ethene 0.025 1.95
ethane 0.019 1.96 propene 0.05 1.9
propane 0.045 1.92
iso-butane 0.11 2.6 Alkyne 0 1.2
n-butane 0.114 2.17 ethyne ∼0 1.2
iso-pentane 0.21 2.46
n-pentane 0.2 2.19 Aromatic 0.01a 1.3b
2,2-dimethylpropane 0.25 3.1
n-hexane 0.42 2.62 Alcohol 0 1
2,2-dimethylbutane 0.36 2.7 methanol ∼0 1
2-methylpentane 0.29 2.2 ethanol ∼0 1.05
3-methylpentane 0.33 2.34
methyl-cyclopentane 0.29 2.9 Ketone 0.077 3.72
Cyclohexane 0.33 2 acetone 0.021 4
methyl-cyclohexane 0.58 2.4 methylethylketone 0.11 3.56
ethyl-cyclohexane 0.5 2.25
dimethyl-cyclohexane 0.67 1.8 Aldehyde 0 1.96
heptane 0.6 2.2 formaldehyde 0 1
octane 0.6 1.86 acetaldehyde 0 3
nonane 0.62 1.52 propanal 0.019 3
decane 0.74 1.43 butanal 0.045 2.91
undecane 0.81 1.2 methacrolein 0.05 2.45
aPreviously assumed value of 0.1 is due to contribution of nitrobenzene which we do not detect in
ΣANs channel.
ACPD
14, 17401–17438, 2014Low temperatures enhance organic nitrate formation
L. Lee et al.
Title Page
Abstract Introduction
Conclusions References
Tables Figures
◭ ◮
◭ ◮
Back Close
Full Screen / Esc
Printer-friendly Version Interactive Discussion
Discussion
P
a
per
|
Discus
sion
P
a
per
|
Discussion
P
a
per
|
Discussion
P
a
per
|
Table 3.Expected maximum Ox(NO2+O3) concentration under UBWOS condition.
Conditiona UBWOS 2012 photolysis×2
base condition and mixing÷2
αcalculated at 273 Kb 57 ppb 140 ppb
αcalculated at 300 Kb 64 ppb 165 ppb
error 7 ppb 25 ppb
aAssuming background O
ACPD
14, 17401–17438, 2014Low temperatures enhance organic nitrate formation
L. Lee et al.
Title Page
Abstract Introduction
Conclusions References
Tables Figures
◭ ◮
◭ ◮
Back Close
Full Screen / Esc
Printer-friendly Version Interactive Discussion
Discussion
P
a
per
|
Discus
sion
P
a
per
|
Discussion
P
a
per
|
Discussion
P
a
per
|
01/20 01/24 01/28 02/01 02/05 02/09 02/13 02/17 02/21 02/25 02/29
Local date (MST) 0
2 4 6 8 10 12 14 16 18
m/s
Wind Speed
01/20 01/24 01/28 02/01 02/05 02/09 02/13 02/17 02/21 02/25 02/29
0 10 20 30 40 50
ppb
Ozone
01/20 01/24 01/28 02/01 02/05 02/09 02/13 02/17 02/21 02/25 02/29
0 2 4 6
ppb
ANs
01/20 01/24 01/28 02/01 02/05 02/09 02/13 02/17 02/21 02/25 02/29
0 10 20 30 40 50
ppb
NO2
ACPD
14, 17401–17438, 2014Low temperatures enhance organic nitrate formation
L. Lee et al.
Title Page
Abstract Introduction
Conclusions References
Tables Figures
◭ ◮
◭ ◮
Back Close
Full Screen / Esc
Printer-friendly Version Interactive Discussion
Discussion
P
a
per
|
Discus
sion
P
a
per
|
Discussion
P
a
per
|
Discussion
P
a
per
|
6 12 18 24
Time of day (Hour) 0.5
1 1.5 2 2.5
ANs (ppb)
10 15 20 25 30 35 40
Ozone, NO
2
(ppb)
ANs Ozone 5 NO2
ACPD
14, 17401–17438, 2014Low temperatures enhance organic nitrate formation
L. Lee et al.
Title Page
Abstract Introduction
Conclusions References
Tables Figures
◭ ◮
◭ ◮
Back Close
Full Screen / Esc
Printer-friendly Version Interactive Discussion
Discussion
P
a
per
|
Discus
sion
P
a
per
|
Discussion
P
a
per
|
Discussion
P
a
per
|
01/24 01/26 01/28 01/30 02/01 02/03 02/05 02/07 02/09 02/11 02/13 02/15 02/17 02/19
Date, marker at midnight
0 0.05 0.1 0.15 0.2 0.25
N
it
ra
te
Y
ie
ld
⟨α⟩
⟨α⟩ daytime average
⟨α⟩ @ 300K daytime average
ACPD
14, 17401–17438, 2014Low temperatures enhance organic nitrate formation
L. Lee et al.
Title Page
Abstract Introduction
Conclusions References
Tables Figures
◭ ◮
◭ ◮
Back Close
Full Screen / Esc
Printer-friendly Version Interactive Discussion
Discussion
P
a
per
|
Discus
sion
P
a
per
|
Discussion
P
a
per
|
Discussion
P
a
per
|
6 12 18 24
Time of day (Hour) 0
0.5 1 1.5 2
Rate (ppb/hour)
0 5x10⁵ 1x10⁶ 1.5x10⁶ 2x10⁶ 2.5x10⁶ 3x10⁶ 3.5x10⁶
OH concentration (1/cm
3) VOC consumption
OH