Brazilian Journal of Physics, vol. 39, no. 1, March, 2009 31
Characterization Of Oil Shale Residue And Rejects From Irati Formation By Electron Paramagnetic
Resonance
∗S.L. Cogo, A.M. Brinatti, and S.C. Saab†
Universidade Estadual de Ponta Grossa, Departamento de F´ısica, Av. Carlos Cavalcanti, 4748, 84030-900, PR, Brazil
M.L. Sim˜oes and L. Martin-Neto
Embrapa Instrumentac¸˜ao Agropecu´aria, P.O. Box. 741, 13560-970, S˜ao Carlos, SP, Brazil
J.A. Rosa
IAPAR - Unidade Regional de Pesquisa Centro-Sul BR 376 - Km 496, PO Box 129, 84001-970, Ponta Grossa, PR, Brazil
Y.P. Mascarenhas
Instituto de F´ısica de S˜ao Carlos, Universidade de S˜ao Paulo, Caixa Postal 369, CEP 13560-970, S˜ao Carlos, SP, Brazil.
(Received on 26 June, 2008)
In this study, sedimentary organic matter of oil shale rejects, calschist, shale fine and the so called retorted shale from Irati formation was characterized. EPR was used to analyse the samples regarding loss of signal in
g=2.003 associated to the organic free radical with the calcined samples and washing with hydrogen peroxide. The radical signal was detected in all samples, however, for the calschist and shale fine samples another signal was identified at g=2.000 which disappeared when the sample was heated at 4000C. Hydrogen peroxide washing was also performed and it was noted that after washing the signal appeared aroundg=2.000 for all samples, including retorted shale, which might be due to the quartzE1defect.
Keywords: Oil shale; EPR; Quartz.
1. INTRODUCTION
The pyrobituminous shale, as it is best known, is an oily sedimentary rock, which contains bitumen and kerogen, an or-ganic complex that when heated decays and produces several products, residues and rejects.
According to conventional Geology, the Formation is a sed-imentary Bay that marked the Permian Period and its deposi-tion might have occurred in shallow sea water, in largely con-fined bays, in a climate suitable to calcarium precipitation and physico-chemical conditions favorable to the accumulation of organic matter, which generate pyrobitumen [1]. The Irati for-mation presents defined layers, which vary in thickness from 5.5 m to 3.5 m with 15% organic matter content intercalated by deposits rich in carbonates. In the region of S˜ao Mateus do Sul, Parana State, southern Brazil, there are oil shale forma-tions, called Irati Formation.
In 1970 a mineral (shale) exploration program was estab-lished, the Petrosix [1,2]. The mill which processes 1660 tons of “raw shale”, firstly mined and crushed, then taken to the re-torter, where it is pyrolized, cooked at about 5000C releasing the contained organic matter and leaving behind 1376 tons of the residue called retorted shale. Besides the residue, retorted shale, the Petrosix extraction process generates a large amount of rejects, mainly shale fines (less than 0.25 inch) with an oil content of about 15%, and calschist.
In Brazil, the oil shale has been produced since the end of XVIII century, however, very little is known about its residue (retorted shale) and rejects (calschist and shale fine), which
∗This work is part of the project “Use of subproducts of the processing of the
pyrobituminous shale in the agriculture”, agreement Petrobras-IAPAR
†Electronic address:[email protected]
together represent 82% of the total. They constitute a double problem, both contaminating the environment and contributing to higher oil and gas extraction costs [2].
The literature presents some works with shale and also with the retorted residue, however, there are no works with calschist and shale fine. Adams et al. (2005) [3] analyzing oil shale showed that Multivariate calibration modelling has proved to be effective and efficient tool combined with DRIFTS for pre-dicting oil content from oil shale.
Sousa et al. (1997) [4] showed that the oil shale free rad-ical transformation (production and decomposition) mecha-nism can be described as: Ai⇒Bi ⇒Ci whereBi are
para-magnetic species andAieCi are diamagnetic species.
Work-ing with Electron Paramagnetic Resonance (EPR) on retorted shale samples Sousa et al. (1994) [5] analyzed the effects pro-duced on the retorted shale samples at temperatures from 100 a 10000C. They showed that the resonance signal ing=4.2 associated to the ionFe3+with 5/2 spin, presents a decrease in the samples line width of the samples heated at 9000C e 1000 0C, indicating the appearance of a glass phase.
The Electron Paramagnetic Resonance (EPR) is used in this work [6] to characterize the sedimentary organic matter ob-tained from the Irati Formation, observing the organic radical signal of shale residue in the Petrosix process, also called re-torted shale, as well as the rejects called shale fine and calschist which did not undergo the process.
2. MATERIAL AND METHODS
32 S.L. Cogo et al.
with hydrogen peroxide to eliminate part of the organic mat-ter of the samples. During the washing 1 g of sample for 10 mL ofH2O2was used, each sample underwent 40 washings.
The samples were put in quartz tube with about 20 mg of non-calcined samples, non-calcined samples and washed with Hydro-gen peroxide.
EPR spectra were recorded for freeze-dried at room tem-perature in X Band (9.4 GHz). Experimental conditions were: modulation frequency of 100 kHz; microwave power (0.2 mW) in order to avoid semiquinone-type free radicals signal satura-tion, adequate modulation amplitude (0.1 mT) and time con-stant (2.56 ms) that was 1/4 of the conversion time to guaran-tee no signal deformation by increasing line width. The central field was 338 mT, with 5 mT scanning and modulation ampli-tude de 0.1 mT peak to peak (Hpp). A patterned sampleCr3+
withg=1.9797 was added to the sample in the resonant cav-ity, in order to determine the g value for each sample [7].
The X-Ray Diffraction (XRD) analyses were carried out using an automatic horizontal diffractometer, rotating anode RIGAKU ROTAFLEX generator, Ru-200B model, with CuKα radiation (λkα1=1.54433, ˚Aλkα2=1.54051 ˚A) operating at 50 kV and 100 mA, in the continuous scanning mode with speed of 2◦/min., within the range of 50≤2θ≤=1000, with
divergence slit (DS): 1.000, reception slit (RS): 0.300, scatter-ing slit (SS): 1.000and the samples were powdered and sieved
(53µm aperture) and were placed on the sample holder and lightly pressed.
3. RESULTS AND DISCUSSION
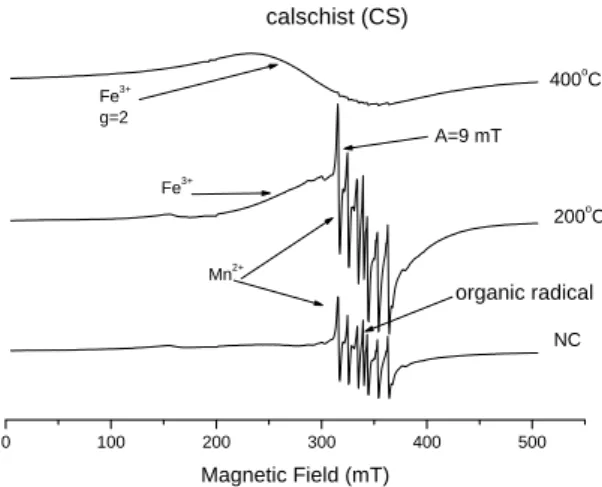
Figure 1 presents the CS sample spectra without calcination and with the calcined samples at 200 0C and 400 0C (simi-lar signals occurred for the SF and RS). The appearance of resonance signal ing=2 ofFe3+with large line width was noticed due to the dipolar interaction between the ferromag-netic structures when the sample was calcined at 4000C. Such result confirms what was verified by Fonseca et al. (1984) [8] and Sousa et al. (1994) [6] when they worked with RS sam-ples, those authors attributed theFe3+signal to the oxidation ofFe2+found in (Fe2S3) pyrite and the generation ofFe3+in
hematite (Fe2O3). TheFe3+signal can be observed ing=4.3
associated to theFe3+ion with 5/2 spin which can occupy ei-ther tetrahedral or octahedral sites of silicate structures. [5]
The spectrum also shows (NC and 2000C) a sextet of lines
centered atg=2.00 with a hyperfine coupling constant (A) of 9 mT generated byMn2+ions with 5/2 nuclear spin [2].
The organic radical spectra for the non-calcined samples, for the three samples: calschist, shale fine and retorted shale, are shown in Figure 2a. The signal for the retorted shale presents a characteristic similar to the organic radical with value ing=2.003 [8] and line width about 5.5 G. The sig-nal for calschist and shale fine present the sigsig-nal ing=2.003, however, there is another signal ing=2.000. There were no changes in the spectra obtained from samples heated at 2000C (Figure 2b) emphasizing that the organic matter related to the organic radical is stable at this temperature once the free rad-ical signal ing=2.003 increased in relation to the spectra at room temperature. Figure 2c shows the spectra after the sam-ples were heated at 4000C. It is possible to observe that the
signal aroundg=2.000 disappears, the organic radical signal
0 100 200 300 400 500
A=9 mT
organic radical
Mn2+ Fe3+
Fe3+
g=2
calschist (CS)
NC
200o
C
400oC
Magnetic Field (mT)
FIG. 1: EPR signals for the calschist sample with variation of mag-netic field (B) 500 mT at non calcined (NC) 2000C and 4000C. The Fe3+signal for the three calcination temperatures. At 4000C the gain in signal is lower, however, the intensity ofFe3+signal is higher.
becomes noisier highlighting decrease in the signal to noise ratio. When samples were heated at 7000C, organic radical signal was not observed (data not shown) indicating loss of organic radical due to samples calcination.
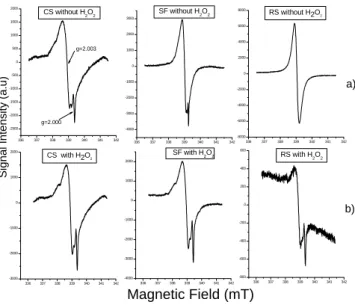
The spectra of samples washed with hydrogen peroxide are shown in Figure 3 together with the non-calcined samples. The signal around g=2.000 is observed to increase in calschist and shale fine samples and also appeared in the retorted shale sam-ple. Souza et. al (1994) [5] working with retorted shale did not identify the signal ing=2.000 since this signal only ap-pears when the part of organic matter that contains the organic radical ing=2.003 is extracted. This is only possible when the sample is washed with hydrogen peroxide as shown in Fig-ure 3.
The signal around g =2.000 can be due to the quartz as it was also proposed by Bayer et al. (2000) [9] when studying soil physical fractions (oxisol) and identifying the organic signal due to the semiquinone radical and a signal in g=2.000. S. Botis (2005) [10] employing the EPR data reveal the presence of six paramagnetic defects: one oxy-gen vacancy center (E1), three silicon vacancy hole centers
O32−/H−(I).O32−/H+(II).O32−/M+and twoO−2 peroxy cen-ters, in the Athabasca quartz.
Brazilian Journal of Physics, vol. 39, no. 1, March, 2009 33
336 337 338 339 340 341 342 -2500 -2000 -1500 -1000 -500 0 500 1000 1500 2000
336 337 338 339 340 341 342 -4000 -3000 -2000 -1000 0 1000 2000 3000
336 337 338 339 340 341 342 -8000 -6000 -4000 -2000 0 2000 4000 6000 8000 g=2.000 g=2.003 a)
CS-non-calcined SF - non-calcined
S igna l In te nsit y (a. u )
Magnetic Field (mT)
RS - non-calcined
336 337 338 339 340 341 342 -4000 -3000 -2000 -1000 0 1000 2000 3000
336 337 338 339 340 341 342 -6000 -4000 -2000 0 2000 4000 6000
336 337 338 339 340 341 342 -10000 -5000 0 5000 10000 Si g nal I n tensi ty (a. u
) CS- 200o
C SF - 200o C
b)
Magnetic Field (mT)
RS - 200o C
336 337 338 339 340 341 342 -600 -400 -200 0 200 400
336 337 338 339 340 341 342 -600 -400 -200 0 200 400 600
336 337 338 339 340 341 342 -500 -400 -300 -200 -100 0 100 200 300 400 S igna l In te nsit y (a. u )
CS - 400oC
SF - 400o C
c)
Magnetic Field (mT)
RS - 400oC
FIG. 2: Signals in theg=2.003 and 2.000 regions of samples CS, SF, RS: a) non-calcined; b) calcined at 2000C; c) calcined at 4000C. The signal disappears in the 2.000 region at 4000C.
336 337 338 339 340 341 342 -800 -600 -400 -200 0 200 400 600
336 337 338 339 340 341 342 -4000 -3000 -2000 -1000 0 1000 2000
336 337 338 339 340 341 342 -3000 -2000 -1000 0 1000 2000
336 337 338 339 340 341 342 -2500 -2000 -1500 -1000 -500 0 500 1000 1500 2000
336 337 338 339 340 341 342 -8000 -6000 -4000 -2000 0 2000 4000 6000 8000
336 337 338 339 340 341 342 -4000 -3000 -2000 -1000 0 1000 2000 3000 Si gna l In tens it y (a. u )
RS with H2O2
SF with H2O2
CS with H2O2 g=2.000
g=2.003
Magnetic Field (mT) CS without H2O2
a) RS without H2O2
b) SF without H2O2
FIG. 3: Signals in theg=2.003 and 2.000 region: a) non-treated; b) treated withH2O2. showing the appearance of signal in the 2.000 region for the RS sample.
4. CONCLUSIONS
The spectra of EPR of the samples of CS, SF and RS showed the sign ofFe3+,Mn2+and organic free radical. It was iden-tified one signal characteristic similar of organic radical with value ing=2.003. The samples de CS and SF were observed
the presence of another signal ing=2.00043, in the samples
0 20 40 60 80 100
0 2 4 6 8 10 12 14 PY 3 1 1 PY
3 1 1
PY
2 0 0
KG 0 0 2 KG
1 0 0
KG 0 0 1 2 0 4 _
3 3 1
_
2 2 1 1 3
0
0 2 3
0 3
1
1 2 2
_
1 2 1
_
1 1
2
2 0 0
_ 1 1 1 0 1 2 1 0 0 1 1 0 ; P Y
2 1 0
1 0 1
In te nsit y /c. p.s. 10 -3 degree 2theta
FIG. 4: XRD analysis of the non-calcined RS sample showing quartz as principal mineral and respective peaks indicated withhklindexes, kaolin group (label: KG) and pyrite (PY) indicated with label and indexeshkl.
non-calcined and calcined. Through washes withH2O2 the
34 S.L. Cogo et al.
[1] http://www2.petrobras.com.br/minisite/refinarias/
petrosix/portugues/processo/index.asp acesso in 05-29-2008. [2] A.S. Mangrich, L.C. Tessaro, A. Dos Anjos, F. Wypych, J.F.
Soares Environmental Geology40, 1030 (2001).
[3] M.J. Adams, A. Waja, S. Bhargava, S. Grocott and M. Romeo Fuel84, 1991 (2005).
[4] J.J.F. Sousa, N.V. Vugman and C. Costa Neto. Organic Geo-chemistry26, 183 (1997).
[5] J.J.F. Sousa, L. M. Diehl, N. V. Vugman, M. V. A. Fonseca and C. Costa Neto Anais da Academia Brasileira de Ciˆencias66, 13 (1994).
[6] C. P. POOLE Jr. Electron spin resonance: a comprehensive trea-tise on experimental techniques. New York, Wiley-Interscience, (1967) 921p.
[7] M.L. Sim˜oes, W.T.L. da Silva, S. C. Saab, L. M. Santos and
L. Martin-Neto Revista Brasileira de Ciˆencia do Solo31, 1319 (2007).
[8] A. Marchand and J. Conard Electron paramagnetic resonance in kerogen studies. In: B. Durant, ed. kerogen; insoluble organic matter from sedimentary rocks. Paris, Technip, (1980) 243p. [9] C. Bayer, L. Martin-Neto, S. C. Saab and J. Mielniczuk Revista
Brasileira de Ciˆencia do Solo24, 11 (2000).
[10] S. Botis S. M. Nokhrin, Y. Pan, Y. Xu, T. Bonli and V. Sopuck The Canadian Mineralogist43;1565 (2005).
[11] G.W. Brindley and G. Brown (eds.) Crystal Structures of Clay Minerals and Their X-ray Identification. London, Mineralogical Society, (1980) 495p.