Layla dos Santos Mendes
Two Essays on Contingent Convertible
Bonds and their Impacts on Future
Financial Crises
Layla dos Santos Mendes
Two Essays on Contingent Convertible
Bonds and their Impacts on Future
Financial Crises
Thesis presented as a requirement to
obtain-ing the Master’s Degree in Administration.
Funda¸c˜ao Getulio Vargas
Supervisor: Jos´e Fajardo
”Nothing interesting happens in the
comfort zone”
Contents
1 Introduction 3
2 Contingent Convertible (CoCo) bonds 5
2.1 Characteristics . . . 5
2.2 Advantages and disadvantages . . . 6
2.3 Analysis of CoCo bond issues . . . 7
3 Essay 1: Propensity of bank to issue CoCo bonds 10 3.1 Sample . . . 11
3.1.1 Summary statistics . . . 12
3.2 Model . . . 12
3.3 Results . . . 13
3.4 Robustness . . . 14
4 Essay 2: CoCo bonds and future crises 15 4.1 Model specification with CoCo bonds . . . 18
4.2 Sample . . . 19
4.3 Results . . . 19
4.3.1 Regulatory requirement . . . 20
5 Conclusion 21
Abstract
The objective of this thesis is to improve the understanding of the determinants of
CoCo bond issuance and their effects in a financial distress scenario. The results
suggest that the propensity of banks to issue CoCo bonds is different when
compar-ing developed and emergcompar-ing countries. The banks in the BRICS and other emergcompar-ing
countries that issued CoCo bonds are typically large and have high leverage, aiming
to meet the Basel III rules and replace debt with equity funding. I also propose a
model that simulates the capital shortfall that each bank needs in a future crisis
using the CoCo bond trigger. As results, the issuance of CoCo bonds could avoid
12 bankruptcies when using the market value measures in a sample of 40 banks in
the world. In complement, the regulatory requirement is fixed at 8% for minimum
total capital by Basel III, but the model suggests an optimal value exists for each
bank. In the end, I find that issuing CoCo bonds is an important and possible tool
for banks to restructure their debt levels and protect against future crises.
1
Introduction
The collapse of Lehman Brothers in 2008 triggered the world’s biggest financial crisis
since the crash in 1929. The years leading up to the 2008 crisis saw a flood of irresponsible
mortgage lending in America, excess savings in Asia, and a pattern of European banks
borrowing in American money markets and using the funds to buy doubtful securities (The
Economist, 2013). Years of low inflation and stable growth ”The Great Moderation”
-fostered complacency and risk-taking.
In a globalized economy with increased presence of transnational corporations, the
crisis spread worldwide, affecting mainly the European Union’s economy. Many market
players suffered huge losses or went bankrupt and governments were called upon to
inter-vene. Specialists and analysts questioned the external capital input in banks to avoid their
bankruptcy (bail-outs) - especially by governments. These specialists suggested bail-in
rescue policies, meaning internal mechanisms to solve their financial distress.
In this context, the Basel Committee on Banking Supervision, created in 1975,
sub-mitted the Basel III accord - a comprehensive set of reform measures to strengthen the
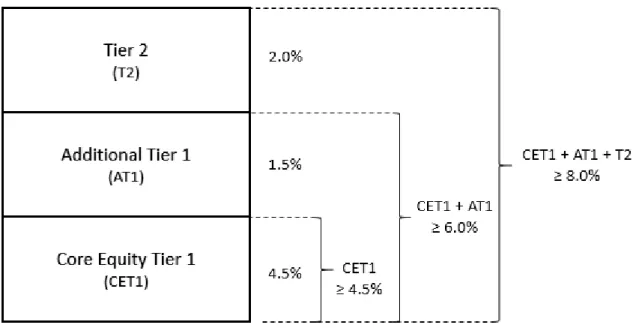
regulation, supervision and risk management of the banking sector (BIS, 2011). The
main proposition of Basel III is to increase the bank-level of regulatory capital, which
can be decomposed into Tier 1, additional Tier 1 and Tier 2 (see more in Fig. 5 in the
appendix). Tier 1 capital is high-quality capital that is able to absorb losses in a going
concern context whereas the Tier 2 capital is supposed to absorb losses in a gone concern
context (De Spiegeleer and Schoutens, 2011). This regulatory framework classified hybrid
instruments, called contingent convertible bonds (CoCo bonds), in the additional Tier 1
or Tier 2 categories, according to trigger levels.
Issuance of CoCo bonds can be a bail-in solution for banks in crisis, allowing them to
borrow money whereby the investors can transform this debt into equity if a pre-specified
trigger event occurs. In other words, CoCo bonds are debt instruments that can mostly
a pre-agreed threshold.
However, it remains unclear if CoCo bonds will be effective in loss absorption for issuers
in the event of another financial distress (Vall´ee, 2015; Avdjiev et al., 2015). This is an
important question considering there are varying amounts of regulatory discretion built
into triggers and the equity conversion or write-down mechanisms that could influence
the results. As of this writing, no bank issuer has used the trigger, so the real efficiency of
CoCo bonds has not yet been measured. It is a recent subject and there are few published
studies about the CoCo market and its efficiency to reduce banks’ risks.
In light of this situation, the research objective of essay 1 is to comprehend the
de-terminants that affect the propensity of banks to issue CoCo bonds. Furthermore, there
is a lack of research about the CoCo bonds issued by the banks of BRICS countries.
Although most empirical research about the theme is focused on developed countries,
BRICS’s banks - especially those in China and India - were responsible for the biggest
aggregate amount of bonds issued in the period 2009-2015. Therefore, I discuss the
moti-vation for BRICS’s banks to issue CoCo bonds and I compare these banks’ determinants
to issue these bonds with those of developed and other emerging countries.
Beyond the CoCo bond emission mechanism, there is a need to understand whether
CoCo bonds are an effective bail-in mechanism, especially by satisfying liquidity or
regu-latory adequacy requirements. To fill this gap, in essay 2 I propose a model that simulates
the capital shortfall that each bank needs in a future crisis using the CoCo bond trigger
or regulatory change scenarios considering CoCo bond conversion.
The thesis is organized as follows. Section 2 describes CoCo bond market. In Section
3, I study the propensity of banks to issue CoCo bonds. Section 4 discusses the validity
of issuing these bonds to avoid bankruptcy in a future crisis. The last section presents
2
Contingent Convertible (CoCo) bonds
CoCos are instruments similar to corporate bonds where the investor has the right to
convert the bond into shares (De Spiegeleer et al., 2014). This mechanism permits the
firm to continue operating with an adequate level of loss-absorbing capacity (Flannery,
2014). In this line, it is important to delve more deeply in the concept of this derivative,
evaluating its utility, focusing on what kind of situations where it can be implemented,
and discussing the advantages and disadvantages. Moreover, it is important to consider
data on the CoCo issuance in several countries in the world.
2.1
Characteristics
CoCo bonds are designed to provide a source of capital to banks in distress when
private investors are reluctant to supply external capital (Avdjiev et al., 2015). That is,
they are a kind of bail-in mechanism allowing banks to be safer and diminishing the risks
of default. Besides that, CoCos are a hybrid type of investment. These hybrid types of
investment instruments are composed by at least two components. In the case of CoCo
bonds, the components are the liabilities and equity reflected on the balance sheet. CoCos
initially act as regular bonds and pay coupons, but they can be converted into shares (not
paying coupons, only dividends) when there is a trigger. In some cases, the CoCo can
also suffer a write down.
The CoCo contract is based on trigger events. These events are contractual
pre-determined values that recapitalize the bank by a haircut (write-down) to the bonds or
their conversion into shares. These triggers, in turn, can occur during a general market
crisis or a moment of specific financial distress affecting the issuing bank. Thus, depending
on the contract, four of these types of triggers can be chosen by banks: market-based,
accounting, multivariate and regulatory triggers (De Spiegeleer and Schoutens, 2013). A
market-based trigger occurs when the share price decreases to the level defined in the
level stipulated. The regulatory trigger is an imposition of the bank regulator when it
believes the bank has become non-viable. The bank can combine some types in micro
and macro triggers, using a multivariate trigger.
As mentioned before, CoCos are convertible bonds developed to help banks to not
insolvency during an emergency such as a financial distress. However, the decision of
each bank to issue the CoCo depends on how advantageous or disadvantageous these
issues will be for them.
2.2
Advantages and disadvantages
Regarding the advantages of issuing CoCo bonds, there are explicit guarantees defined
in the CoCo contract. Since investors take on the risk of receiving bad shares, the bank
may offer higher coupons to them. There is a high probability of moderate gains and a low
probability of high losses, so the gain is limited but the losses are unlimited (De Spiegeleer
and Schoutens, 2011). Another advantage is that once triggered, the conversion into equity
happens fast and gives a clear signal to the market (De Spiegeleer and Schoutens, 2011).
This should take the volatility out of the share price and the credit default swap spreads.
That is, the bank transmitted the message that it is being protected from unforeseen
insolvency situations, because swaps of debt (CoCos) for shares improve the financial
health of the bank. Indeed, if problems occur, the conversion should improve the capital
structure of the bank, working to restore market confidence in the bank.
On the other hand, a critique of CoCos is that instead of giving protection to the
market regarding stress of the bank, it may increase the volatility of the share price. If
a trigger event appears to be approaching or the likelihood of conversion is perceived as
increasing, investors can dynamically hedge the equity exposure embedded in the CoCo by
taking a short position in the underlying shares. An inherent problem with this hedging
strategy is that the investors are forced to sell more shares when the share price weakens,
referred to as the death-spiral effect (Corcuera et al., 2014). Another concern is that if
banks are allowed to invest in CoCos of financial institution without limitation, there could
be a knock-on effect similar to what rocked the banking system in 2008 (De Spiegeleer and
Schoutens, 2011). Namely, the trigger activation could create more triggers by a domino
effect or contagious effect. At least, the conversion could induce dilution of the equity
stakes of existing shareholders, depending on the conversion mechanism used.
2.3
Analysis of CoCo bond issues
The advantages and disadvantages of issuing CoCo bonds can be evaluated in practice
by observing the volume of CoCo issues in the last six years of several banks in the world
market. The data were extracted from the Bloomberg database on June 16, 2016. The
sample is comprised of 286 bonds from 28 countries.
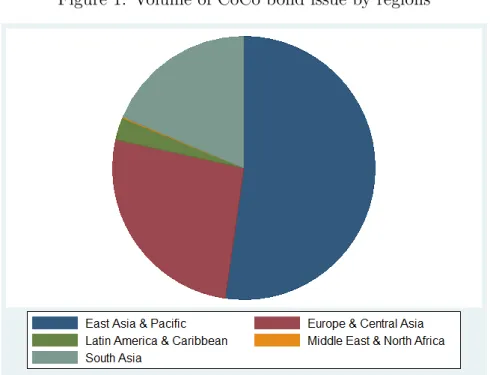
After the financial crisis of 2008 and the Basel III recommendations, European banks
increased their issuance of CoCo bonds. Nevertheless, currently countries of East Asia
and the Pacific represent more than 50% by value of the CoCo bonds issued around the
world, followed by Europe and Central Asia and then South Asia, as shown in Fig. 1.
With respect to the volume of CoCo bonds issued by countries, China is the country
with the largest volume of this hybrid instrument, with approximately USD 374 billion,
as shown in Fig. 2. This issuance has been driven by the need to replace previous
subordinated debt which is not in line with the current Basel III rules (Financial Times,
2015).
Following the same pattern, India is in second place in the volume of CoCo ranking,
with approximately USD 136 billion. The Reserve Bank of India (RBI) has already
recognized CoCo bonds as Additional Tier I instruments in its Basel III Guidelines (RBI,
2014).
Brazil is another emerging country that increased the volume of CoCo issuance in
Figure 1: Volume of CoCo bond issue by regions
Source: Bloomberg, author’s calculations.
need of Brazilian banks to capitalize since they have to reinforce their balance sheets by
2019, when the Basel III rules will be fully implemented in Brazil (CONTRAF, 2014).
However, according to Assossia¸c˜ao Brasileira Bancos ABBC (2013), Brazilian banks are
not expected to be major players in CoCo bond issuance, due to several reasons. Among
these are that Brazilian institutions are in general already well capitalized, even under
the stricter rules of Basel III; banks, especially in the private sector, have reduced their
lending with the recent (and still ongoing as of this writing) recession; and the Basel rules
limit the use of debt securities in the capital composition.
Is important to mention that bank in two other BRICS countries - Russia and South
Africa – have not issued any CoCo bonds yet.
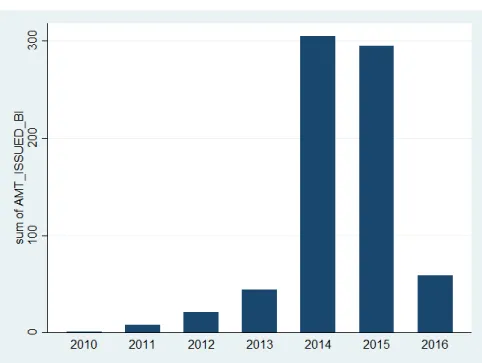
From the observation of CoCo bond issuance by year, it is possible to notice that
2014 was the year of highest volume, as shown in Fig. 3. This was an increase of 593%
compared to 2013. In 2015, the total volume issued was approximately USD 295 billion,
which was the second highest amount in the observed period. A possible explanation for
this phenomenon is that Chinese and Indian banks started to issue CoCo bonds for the
Figure 2: Volume of CoCo bond issue by country
Source: Bloomberg, author’s calculations.
Figure 3: Volume of CoCo bond issue by year
In conclusion, according to Financial Times (2016), the expectation for the future
scenario is that most of banks will continue to issue AT1 over the coming years, since
they are generally cheaper than equity, have tax advantages and count towards leverage
ratio requirements.
The next section intends to clarify the propensity of banks to issue CoCo bonds, that
is, what the determinants are for a bank to issue this type of bond. Besides the evaluation
of CoCo volume in the world scenario, it is also important to discuss the bank features
and financial distress measures that can influence the probability of issuance.
3
Essay 1: Propensity of bank to issue CoCo bonds
Studies of CoCo issuance are important to obtain a meaningful idea about the
propen-sity of banks to issue CoCo bonds. This topic has only recently been addressed in the
literature. Avdjiev et al. (2015),for instance, analyze banks’ motives for issuing CoCos as
well as the impact of this issuance on bank CDS spreads and equity prices. The dataset
consists entirely of post-crisis CoCos issued between 2009 and 2013. They find that the
effect of CoCo issuance on bank funding costs depends crucially on contractual features
and bank characteristics. Additionally, their essay shows a negative impact on issuer’s
CDS spreads, while issuing CoCos with principal write-down has less of an impact.
Also, Vall´ee (2015) explores the effects of liability management exercises (LMEs) to
gain insight into the effects of triggering contingent capital instruments. He analyzes which
bank characteristics are associated with implementing LMEs. The results show that large
banks, which are also the better positioned for cross-selling, do not seem reluctant to
implement these transactions.
In complementation, Martynova and Perotti (2015) study the way the design of bank
contingent capital affects risk incentives. In other words, the study explicitly investigates
how contingent capital affect the bank risk choices, the necessary feature for its optimal
debt that can be bailed-in upon default, as it actively discourages ex ante risk choices.
However, when purchasing a CoCo bond, the investor bets that the probability of
bankruptcy of the bank is low. This situation occurs because the bond’s conversion after
the trigger involves financial losses. In this way, it is necessary to check if the bank is
experiencing financial distress. This information helps the investor to understand the
probability of conversion.
The concept of financial distress is linked to idea that certain banks have a high
probability of failing to meet their financial obligations, thus the stocks of these financially
distressed companies tend to move together. In this respect, several measures of financial
distress have been developed, such as accounting variables to predict the probability of
bank failure (Zmijewski, 1984) and indexes, like Altman’s Z-score (Altman et al., 2000).
In this context, this section analyzes, through an exploratory study, the bank
charac-teristics that affect the propensity of issuing CoCo bonds.
3.1
Sample
The dataset used is from Bloomberg, of banks in advanced and emerging economies.
The data indicate the features of CoCos issued and characteristics of the issuing banks.
The sample period is between 2009 and 2015, with annual frequency.
The sample contains 2552 banks from 130 countries. To limit the influence of outliers,
I winsorized all variables in the model at the 1st and 99th percentiles. That is, I replaced
any observation below the 1st percentile with the 1st percentile, and any observation
above the 99th percentile with the 99th percentile.
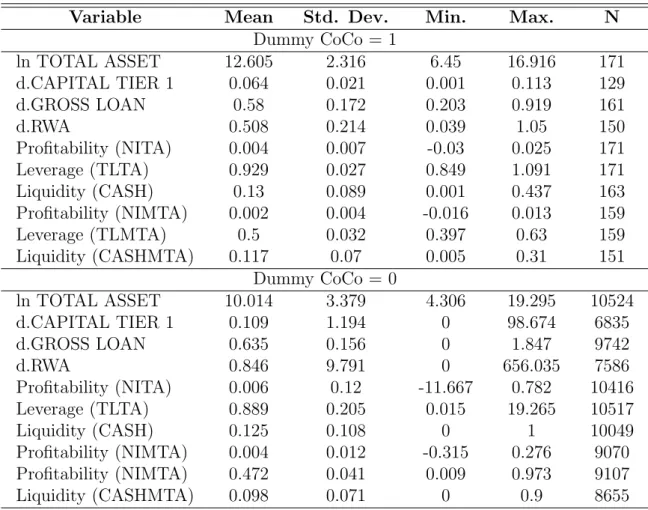
3.1.1 Summary statistics
Table 4 summarizes the properties of the main explanatory variables. Group 0 in
Table 4 describes the average period of independent variables for banks that did not issue
CoCo bonds. Group 1 describes a smaller sample of almost 90 banks that issued CoCo
bonds in period after the 2008 crisis.
[Insert Table 4]
Table 5 shows the correlation between the variables proposed in the model. The
explanatory variables have low pairwise correlation, suggesting these variables are not
multicollinear.
[Insert Table 5]
3.2
Model
The present study is exploratory, so the objective is to analyze if the correlations of
banks’ propensity to issue CoCo bonds persists across time. I used logistic regression of
panel data, estimated by maximum likelihood. The simplification of the model is shown
in equation 1.
P(yit= 1|xit) = Λ(δBankF eaturesit+γF inancialDistressit). (1)
The dependent variable in the logistic estimation (Yit) is a binary variable which
assumes the value 1 if the bank issued a CoCo Bond in the year, and 0 otherwise. On the
side of the explanatory variables, Λ is the cumulative distribution function (cdf) of the
logistic distribution, where Λ(x′
itβ) = τ
1−τ, with τ = e x′
itβ. The vector of bank features
is δ that affect the likelihood of issuing a CoCo bond, according to the framework of
Avdjiev et al. (2015). The variables are: total assets, risk-weighted assets, tier 1 capital
and gross loans. Since these variables have high correlation, the last three variables are
variable of financial distress, namely the relative likelihood of bankruptcy. The measures
are profitability (NITA), leverage (TLTA), and liquidity (CASH), in accordance with
Shumway (2001). In addition, Campbell et al. (2008) suggests using the equity component
of total assets at market value, adding the book value of liabilities, because market prices
more rapidly incorporate new information about the firm’s prospects or more accurately
reflect intangible assets of the firm. More details about how the measures were calculated
are in the appendix.
3.3
Results
In this section, I estimate the probability of a bank’s issuing a CoCo bond from
bank characteristics and financial distress measures through logistic regression 1 with
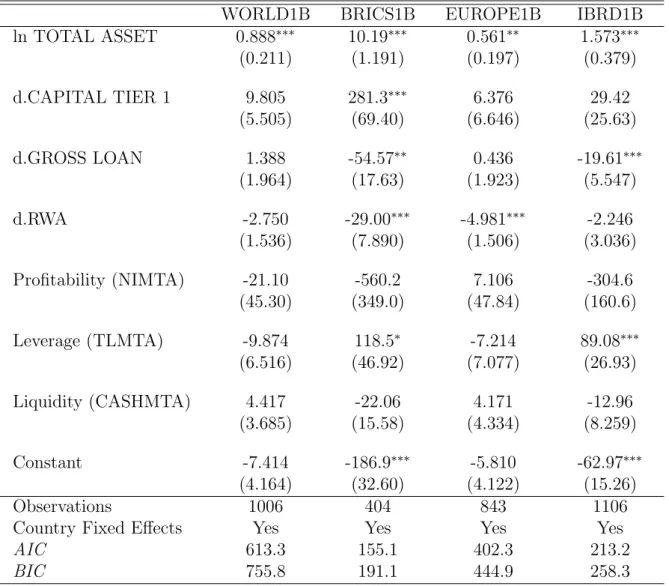
panel data, in the period from 2009 to 2015. Tables 6 and 7 show the results, where
the models were estimated using random effects, clustered standard errors and country
fixed effects. Each column represents the estimation by different criteria, which are: all
banks in the sample, only BRICS 2, only European countries and only emerging countries
3, respectively. This segmentation is based on the volume of CoCo bonds issued per
country.
[Insert Tables 6 and 7]
Table 6 shows the regressions with financial distress measures calculated according to
Shumway (2001), namely the index used only book value in its composition. On the other
hand, Table 7 shows the regressions with financial distress measures calculated at market
value according to Campbell et al. (2008).
The Total Assets variable was positive and significant at 5% level in all models. This
means that as the size of the bank increases, the propensity to issue a CoCo bond rises.
1
I have redone the tests using probit estimations, with similar results.
2
Denomination of five countries among the fastest growing emerging markets: Brazil, Russia, India, China and South Africa
3
Interpreting the marginal effect in the first column, when an increase of one unit in ln.
Total Assets causes the probability of issuing a CoCo bond to increase by 2.1%, keeping
other variables constant. The coefficients of marginal effects are shown in Table 8.
For European banks, the results showed that rising value of Risk Weighted Assets
decreased the probability of CoCo issuance. The best-capitalized banks and those with
high RWA levels are less likely to issue these hybrid instruments. The financial distress
measures in both tables were not significant.
In turn, for BRICS banks, Leverage (TLMTA) was positive and significant, meaning
that more indebted banks are more likely to issue CoCo bonds. This corroborates the fact
that banks of the BRICS countries are trying to meet the Basel III rules and replacing
subordinated debt with additional Tier 1 debt. In addition to bank size and financial
distress, the variable Tier 1 Capital was positive and significant and Total Loans and
RWA were negative and significant.
Emerging countries followed the same pattern as the BRICS, with total assets and
leverage variables positive and significant. Nevertheless, the other variables (Tier 1
Cap-ital and RWA) were not significant, so no increase in the likelihood of banks in these
countries to issue CoCo bonds was noted.
3.4
Robustness
The sample is composed of banks from different countries, each of which has its
par-ticularities regarding regulation, economic model, social policy, etc. In order to minimize
these contrasts, I separated the sample into three groups (BRICS, Europe, IBRD) because
of the broadly similar economic structures and governmental regulations. Moreover, I ran
the model with a dummy variable for each country. Thus, each country had its own
intercept, increasing the explanatory power of the model and avoiding omitted variable
bias.
according to contract design, namely I used the capital type after CoCo trigger activation.
Thus, I formed two sub-samples ”Equity conversion” and the ”Write Down”. This division
enabled assessing the heterogeneity in the sample. Of course, write-downs are riskier for
the investors and demand higher premiums and larger collateral.
[Insert Table 9]
In the same way, I used the status of Basel III rules implementation 4 to divide the
sample into countries that have and have not adopted these rules. The dummy variable
is based on the report of the Bank for International Settlements BIS (2016). Thus, I
estimated the model in equation 1. The results are shown in Table 10. For the countries
that have adopted Basel III rules, the results were the same as in the previous tables,
namely the Total Asset variable was positive and significant.
[Insert Table 10]
With this approach, it is possible to see the determinants of CoCo issuance in both
ways that they can be issued. By comparing the differences between both groups, I was
also able to draw better conclusions about the causal mechanisms behind the decision of
a bank to issue CoCo or not.
4
Essay 2: CoCo bonds and future crises
In a crisis scenario where the CoCo trigger can be activated, the question arises of
whether the bond will be able to absorb the losses given the volume that was issued.
Regulatory agencies should encourage the use of financial instruments that can minimize
the impacts of economic and systemic risks, ex ante of stress events.
A crisis is interpreted here as undercapitalization of the financial sector (Acharya
et al., 2012). In practice, financial firms can fail per se, but in the context of firms’ overall
4
contribution to system-wide failure, this is systemic risk.
However, issuing CoCo bonds is a way for banks to protect against this uncertainty
scenario. But the natural question that arises is: How much capital would be necessary
to bail-in banks after a crisis? To account for potential losses in future stress scenarios,
Acharya et al. (2016) employ stressed capital shortfall measures.
The first measure is Book Capital Shortfall, based on book value of equity and assets,
while the least stringent benchmark is leverage ratio (book equity/assets) of 4% and the
most stringent benchmark is a 7%. The authors suggest an alternative measure replacing
book value by market value. Figure 4 illustrates the capital shortfall aggregate by BRICS
countries. It shows that Chinese banks aggregated in the sample are in distress because
their value is below the threshold over time. In contrast, Brazilian banks in the aggregate
are not in financial distress, since the line is above the threshold, meaning that Brazilian
banks have surplus capital and less debt.
Figure 4: Book Capital Shortfall
The other measure is that developed by Acharya et al. (2010, 2012) from a model in
which a group of banks set leverage levels and choose asset positions in a broader economic
threshold. The calculation of SRISK is analogous to the stress tests that are regularly
applied to financial firms. It is used to estimate losses in a stress scenario and determine
the capital shortfall between a prudential capital requirement and the remaining equity
after losses (Brownlees and Engle, 2016).
SRISKit =Et−1(CapitalShortf alli|Crisis). (2)
Based on a panel of financial institutions indexed by i = 1, ..., I observed at times
t = 1, ..., T, the model aims to estimate the capital shortfall over a potentially long time
period (for instance six months), so it needs time series methods able to deliver estimates
of marginal expected shortfall (MES) (Brownlees and Engle, 2010). This approach consists
of a bivariate process of firm and market returns. Therefore, it is a factor model that
allows dependence between market and idiosyncratic firm shocks over time.
M ESit1−1(C) = Et−1(rit|rmt< C) (3)
=σitEt−1(ρitǫmt+
q 1−ρ2
itξit|ǫmt< C/σmt (4)
=σitρitEt−1(ǫmt|ǫmt < C/σmt+σit
q 1−ρ2
itEt−1ξit|ǫmt< C/σmt). (5)
The model is estimated in two steps, first using GARCH models 5 to obtain the
volatilities. Then, it uses a DCC specification to obtain the correlations. The parameter
C denotes the most pessimistic scenarios for the market return, which can be considered
a crisis. According to Acharya Acharya et al. (2012), when the index falls 40 percent over
the next six months, this is a crisis.
The expected loss of equity or market value is the Long-Run Marginal Expected
Short-fall (LRMES), which consists of an average of fractional returns of the bank in simulated
5
In GARCH models, the parameters rit is the return on bank share price and ξit is the firm error
in estimation; rmt is the return on market index andǫmt is the market error. The symbols σrefers the
crisis scenarios. Alternatively, the authors suggest the LRMES without simulation,
ap-proximated as 1−exp(−18∗M ES), where MES is the one-day loss expected if market
returns are less than -2 percent (Acharya et al., 2012).
In the end, Capital Shortfall of firmi on day t is defined by
SRISKit =kDit−(1−k)(1−LRM ESit)Wit (6)
SRISKit =kDit−(1−k)(1−LRM ESit)Eit, (7)
whereDit is the book value of debt,Wit is the market value of equity, Eit is the book
value of equity and, kis a prudential management measure restricting each institution’s
equity as a fraction of its assets. The model assumes that in case of a systemic event, the
debt cannot be renegotiated.
4.1
Model specification with CoCo bonds
However, this model does not depict the value of the capital shortfall in crisis scenarios,
when the bank can activate the CoCo trigger, by reducing the book value of debt and
increasing the equity.
I assume that in crisis scenarios, the CoCo trigger is activated, thus the contractual
stipulation is automatically carried out and CoCo bond is converted into equity. 6 At this
moment, the previous value of the CoCo bond in Liabilities on the balance sheet moves
to equity or is written down. Adding these assumptions to the model above of capital
shortfall, the new specification using the market value analysis is:
SRISKcocoit =k(Dit−Cit)−(1−k)(1−LRM ESit)Wit, (8)
6
whereCit is the value of CoCo bond that the bank i issue at time t. It is noteworthy
that Cit can change according to the bond’s currency or the market where it was issued.
This means Cit=CoCoF aceV alueit/ExchangeRatet.
On the other hand, the procedure to calculate the capital shortfall of book value can
vary according to contract design. This means whether the CoCo bond will convert into
equity or be written down. But it is necessary to analyze the conversion rate in the
contract, since that conversion into shares could be at par or under face value of the
bond issued. Thus Cit = α(CoCoF aceV alue/ExchangeRate) where α corresponds to a
conversion rate.
SRISKcocoit=k(Dit−Cit)−(1−k)(1−LRM ESit)(Eit+Cit) (9)
SRISKcocoit=k(Dit−Cit)−(1−k)(1−LRM ESit)Eit. (10)
4.2
Sample
The sample is composed of 40 banks that issued CoCo bonds from 12 countries whose
banks have issued CoCo bonds in recent years (according to Fig. 2). The data were
collected from Bloomberg in the period between June 30, 2011 and June 30, 2016. I
extracted daily returns of banks and the market index 7, and the quarterly book equity
and debt, at market value. All data were converted to U.S. dollars.
4.3
Results
To exemplify the model results, I estimated the capital shortfall (SRISK) for situations
when a bank has a CoCo bond or not. I assumed the conversion rate is at par (α = 1)
and the exchange rate is that of June 30, 2016. Tables 12 and 13 present the results using
book and market value, respectively, in the model estimation.
7
Table 1: Countries Frequency
Country Freq.
Brazil 2
Britain 4
China 12
France 3
Germany 1
Italy 1
Netherlands 1
Norway 5
Spain 4
Sweden 4
Switzerland 3
Total 40
[Insert Tables 12 and 13]
Table 12 shows that in a hypothetical crisis, 9 of the 40 banks (22,5%) in the sample
could avoid bankruptcy, six (15%) of them by their own capital surplus and three (7.5%)
by the CoCo bond trigger. This analysis is based on the book equity of the banks.
The evaluation based on market value is more sensitive and faster to respond to
economic changes. The results are presented in Table 13. Of the 40 banks analyzed, 38
(95%) are able to avoid a collapse. In this case, 26 banks (65%) have capital surplus and
12 (30%) could be saved by CoCo bonds issued and triggered.
These results confirm that in both cases, despite the greater relevance when market
value is used, CoCo bonds can help banks to prevent bankruptcy during a crisis in the
next six months.
4.3.1 Regulatory requirement
According to BIS (2011), the minimum total core capital is 8%, so in the model above
the constantk assumes this value. However, it is reasonable to calculate the breakeven
point for this constant, since each bank has its own particularities in capital structure and
decision making. In this way, the regulatory compliance in the model requires that
in a distress scenario.
k = Eit(1−LRM ESit)
Dit+Eit(1 +LRM ESit)
(11)
k = Wit(1−LRM ESit)
Dit+Wit(1 +LRM ESit)
. (12)
Table 14 shows the results of optimal k for two different measures, the first column
using the book value as a parameter and the second column using market value.
[Insert Table 14]
The results suggest that the breakeven point of k is different for each bank, with a
mini- mum value is 0.12% and maximum of 15.29%. This proves that fixing a percentage
of capital requirement is arbitrary, because of the high variance of k values for banks in
the sample. Since a fixed value does consider the features of a particular crisis situation,
a floatingk is a suggestion for regulators to analyze the impact of capital requirements. 8
5
Conclusion
In this dissertation I analyzed whether issuing CoCo bonds is an efficient instrument
to help a wide range of banks or if only ”too big to fail” banks can benefit from it.
The results of Essay 1 suggest that the propensity of banks to issue CoCo bonds is
different when comparing developed and emerging countries. The results show that in the
BRICS and other emerging countries, the banks that issued CoCo bonds are large (”too
big to fail”) and have high leverage, so they are using the issuance of CoCo bonds mainly
in an attempt to join the Basel III rules and reduce indebtedness.
Essay 2 shows that in a sample of 40 banks, during financial distress in the next six
8
months, when analyzing the banks’ book value, issuance of CoCo bonds could of three
institutions – besides allowing six institutions to have a capital surplus. When I analyzed
the same sample by the banks’ market value, which is more reliable, the issuance of
CoCo bonds could avoid collapse of 12 institutions – besides allowing 26 banks to have
a capital surplus. In complementation, the percentage of regulatory requirement is fixed
at a minimum of 8% of total capital according to the BIS (2011), but the model suggests
an breakeven point exists for each bank. In the end, I find that issuing CoCo bonds can
be an important tool for bank debts restructuring and protection in a future crisis.
As study limitations I can mention the small number and quality of observations, since
it is a secondary dataset that can have some input errors. I can also mention
omitted-variable bias related with the wide range of related omitted-variables that could be important to
References
Acharya, V., Engle, R., and Richardson, M. (2012). Capital shortfall: A new approach to
ranking and regulating systemic risks. The American Economic Review, 102(3):59–64.
Acharya, V., Pierret, D., and Steffen, S. (2016). Capital shortfalls of european banks
since the start of the banking union. Technical report, Working Paper.
Acharya, V. V., Pedersen, L. H., Philippon, T., and Richardson, M. P. (2010). Measuring
systemic risk.
Altman, E. I. et al. (2000). Predicting financial distress of companies: revisiting the
z-score and zeta models. Stern School of Business, New York University, pages 9–12.
Assossia¸c˜ao Brasileira Bancos ABBC (2013). Bancos testam venda de ”coco bond”.
http://www.abbc.org.br/noticiasview.asp?idNoticia=4525. Accessed2016-06-28.
Avdjiev, S., Bolton, P., Jiang, W., Kartasheva, A., and Bogdanova, B. (2015). Coco bond
issuance and bank funding costs. BIS and Columbia University working paper.
BIS, B. (2011). Basel iii: International regulatory framework for banks.
http://www.bis.org/bcbs/basel3.htm. Accessed 2016-10-04.
BIS, B. (2016). Basel committee on banking supervision.
http://http://www.bis.org/bcbs/publ/d366.pdf. Accessed 2016-10-12.
Brownlees, C. T. and Engle, R. (2010). Volatility, correlation and tails for systemic risk
measurement. publisher not identified.
Brownlees, C. T. and Engle, R. F. (2016). Srisk: A conditional capital shortfall measure
of systemic risk. The Review of Financial Studies.
Campbell, J. Y., Hilscher, J., and Szilagyi, J. (2008). In search of distress risk. The
CONTRAF, C. (2014). Bancos iniciam corrida atr´as de capital por causa
de basileia.
http://www.contrafcut.org.br/noticias/bancos-iniciam-corrida-atras-de-capital-por-causa-de-basileia-3-b0c7. Accessed 2016-10-12.
Corcuera, J. M., De Spiegeleer, J., Fajardo, J., J¨onsson, H., Schoutens, W., and Valdivia,
A. (2014). Close form pricing formulas for coupon cancellable cocos.Journal of Banking
& Finance, 42:339–351.
De Spiegeleer, J. and Schoutens, W. (2011). Contingent convertible coco-notes:
Structur-ing & pricStructur-ing. Euromoney Books.
De Spiegeleer, J. and Schoutens, W. (2013). Multiple trigger cocos: Contingent debt
without death spiral risk. Financial Markets, Institutions & Instruments, 22(2):129–
141.
De Spiegeleer, J., Schoutens, W., and Van Hulle, C. (2014). The Handbook of Hybrid
Securities: convertible bonds, coco bonds and bail-in. John Wiley & Sons.
Financial Times (2015). Chinese banks issue most coco bonds.
https://next.ft.com/content/5a99b804-b135-11e4-9331-00144feab7de. Accessed
2016-06-28.
Financial Times (2016). Bank coco market faces uphill struggle.
https://next.ft.com/content/d4122d20-da14-11e5-98fd-06d75973fe09. Accessed
2016-06-28.
Flannery, M. J. (2014). Contingent capital instruments for large financial institutions: A
review of the literature. Annu. Rev. Financ. Econ., 6(1):225–240.
Martynova, N. and Perotti, E. C. (2015). Convertible bonds and bank risk-taking.
RBI, R. (2014). Implementation of basel iii capital regulations in india – amendments.
https://rbi.org.in/scripts/NotificationUser.aspx?Id=9202Mode=0. Accessed
Shumway, T. (2001). Forecasting bankruptcy more accurately: A simple hazard model*.
The Journal of Business, 74(1):101–124.
The Economist (2013). Crash course.
http://www.economist.com/news/schoolsbrief/21584534-effects-financial-crisis-are-still-being-felt-five-years-article. Accessed 2016-06-28.
Vall´ee, B. (2015). Contingent capital trigger effects: Evidence from liability management
exercises.
Zmijewski, M. E. (1984). Methodological issues related to the estimation of financial
A
Figures and Tables
Figure 5: Basel III capital requirements
Table 2: Frequency of banks by country
COUNTRY Freq. COUNTRY Freq. COUNTRY Freq.
ARGENTINA 7 GRENADA 1 PAPUA N.GUINEA 1
ARMENIA 3 GUAM 1 PARAGUAY 8
AUSTRALIA 31 HONDURAS 1 PERU 22
AUSTRIA 6 HONG KONG 6 PHILIPPINES 19
AZERBAIJAN 33 HUNGARY 1 POLAND 15
BAHAMAS 4 INDIA 43 PORTUGAL 2
BAHRAIN 13 INDONESIA 42 PUERTO RICO 3
BANGLADESH 32 IRAQ 22 QATAR 8
BARBADOS 2 IRELAND 3 ROMANIA 3
BELGIUM 6 ISRAEL 10 RUSSIA 50
BELIZE 1 ITALY 27 RWANDA 1
BENIN 1 IVORY COAST 3 SAUDI ARABIA 12
BERMUDA 1 JAMAICA 5 SENEGAL 1
BOLIVIA 9 JAPAN 95 SIERRA LEONE 1
BOSNIA-HERZE. 21 JORDAN 11 SINGAPORE 3
BOTSWANA 3 KAZAKHSTAN 14 SLOVAKIA 6
BRAZIL 22 KENYA 9 SOUTH AFRICA 7
BRITAIN 12 KUWAIT 10 SOUTH KOREA 13
BULGARIA 5 KYRGYZSTAN 4 SPAIN 10
BURKINA FASO 1 LAOS 1 SRI LANKA 18
CANADA 16 LEBANON 6 ST. KITTS & NEV 2
CAPE VERDE 2 LIECHTENSTEIN 2 SUDAN 1
CAYMAN ISLANDS 3 LITHUANIA 1 SWAZILAND 1
CHILE 8 MACEDONIA 14 SWEDEN 6
CHINA 26 MALAWI 4 SWITZERLAND 48
COLOMBIA 7 MALAYSIA 9 SYRIA 11
COSTA RICA 1 MALTA 4 Serbia 7
CROATIA 13 MAURITIUS 3 TAIWAN 19
CYPRUS 3 MEXICO 7 TANZANIA 5
CZECH 3 MOLDOVA 12 THAILAND 11
DEM.REP. CONGO 1 MONACO 1 TOGO 1
DENMARK 22 MONGOLIA 2 TRINIDAD AND TO 2
ECUADOR 8 MOROCCO 6 TUNISIA 11
EGYPT 12 Montenegro 13 TURKEY 15
EL SALVADOR 9 NAMIBIA 2 UAE 19
FAROE ISLANDS 1 NEPAL 94 UGANDA 2
FINLAND 3 NETHERLANDS 3 UKRAINE 84
FRANCE 17 NIGER REPUBLIC 1 UNITED STATES 1,104
GAMBIA 1 NIGERIA 17 VENEZUELA 7
GEORGIA 4 NORWAY 26 VIETNAM 9
GERMANY 8 OMAN 7 ZIMBABWE 3
GHANA 6 PAKISTAN 22 Zambia 5
GREECE 8 PALESTINE 7 Total 2,552
Table 3: Variables Definition
Variable Name Coding Definition Reference
Bank Features
Total Assets ln TOTAL ASSET The total of all short and long-term assets as reported on the
Balance Sheet. The variables was scalled by logarithm. Avdjiev et al. (2015)
Risk-weight assets d.RWA
This field returns the Risk-Weighted Assets, as disclosed by the company, that are used in the calculation of a bank’s Tier 1 and Total Capital Ratios. Risk-Weighted Assets is calculated by weighing each type of asset relative to its risk.
Avdjiev et al. (2015)
Capital Tier 1 d.CAPITAL TIER 1 The ratio of Tier 1 capital to risk-weighted assets. Avdjiev et al. (2015)
Gross loan d.GROSS LOAN
Includes direct financing lease receivables, receivable from cus-tomers and brokers/dealers in the brokerage industry, mort-gage loans and credit card receivables, automobile loans re-ceivables.
Avdjiev et al. (2015)
Financial distress
Profitability NITA N etIncomeit/T otalAssetsit Shumway (2001)
NIMTA N etIncomeit/(M Eit+T otalLiabilitiesit) Campbell et al. (2008)
Leverage TLTA T otalLiabilitiesit/T otalAssetsit Shumway (2001)
TLMTA T otalLiabilitiesit/(M Eit+T otalLiabilitiesit) Campbell et al. (2008)
Liquidity CASH CashandShortT ermInvestmentsit/T otalAssetsit Shumway (2001)
CASHMTA CashandShortT ermInvestmentsit/(M Eit +
T otalLiabilitiesit) Campbell et al. (2008)
Table 4: Summary statistics
Variable Mean Std. Dev. Min. Max. N
Dummy CoCo = 1
ln TOTAL ASSET 12.605 2.316 6.45 16.916 171
d.CAPITAL TIER 1 0.064 0.021 0.001 0.113 129
d.GROSS LOAN 0.58 0.172 0.203 0.919 161
d.RWA 0.508 0.214 0.039 1.05 150
Profitability (NITA) 0.004 0.007 -0.03 0.025 171
Leverage (TLTA) 0.929 0.027 0.849 1.091 171
Liquidity (CASH) 0.13 0.089 0.001 0.437 163
Profitability (NIMTA) 0.002 0.004 -0.016 0.013 159
Leverage (TLMTA) 0.5 0.032 0.397 0.63 159
Liquidity (CASHMTA) 0.117 0.07 0.005 0.31 151
Dummy CoCo = 0
ln TOTAL ASSET 10.014 3.379 4.306 19.295 10524
d.CAPITAL TIER 1 0.109 1.194 0 98.674 6835
d.GROSS LOAN 0.635 0.156 0 1.847 9742
d.RWA 0.846 9.791 0 656.035 7586
Profitability (NITA) 0.006 0.12 -11.667 0.782 10416
Leverage (TLTA) 0.889 0.205 0.015 19.265 10517
Liquidity (CASH) 0.125 0.108 0 1 10049
Profitability (NIMTA) 0.004 0.012 -0.315 0.276 9070
Profitability (NIMTA) 0.472 0.041 0.009 0.973 9107
Table 5: Cross-correlation table
Variables 1. 2. 3. 4. 5. 6. 7. 8. 9. 10.
1. ln TOTAL ASSET 1.000
2. d.CAPITAL TIER 1 -0.024 1.000
3. d.GROSS LOAN -0.160 0.015 1.000
4. d.RWA -0.020 0.778 0.022 1.000
5. Profitability (NITA) 0.036 0.002 -0.008 -0.001 1.000
6. Leverage (TLTA) 0.069 -0.023 0.108 -0.004 -0.880 1.000
7. Liquidity (CASH) 0.109 -0.006 -0.418 -0.006 0.026 -0.088 1.000
8. Profitability (NIMTA) 0.096 0.002 -0.033 -0.003 0.432 -0.342 0.079 1.000
9. Leverage (TLMTA) 0.144 -0.013 -0.034 -0.001 -0.059 0.235 -0.106 -0.198 1.000
10. Liquidity (CASHMTA) 0.169 -0.010 -0.406 -0.004 0.024 -0.059 0.947 0.085 0.082 1.000
Table 6: Results of estimation using book value in financial distress measures
WORLD1A BRICS1A EUROPE1A IBRD1A
ln TOTAL ASSET 0.997∗∗∗ 9.372∗∗∗ 0.659∗∗∗ 0.763∗
(0.203) (1.210) (0.179) (0.367)
d.CAPITAL TIER 1 4.989 150.5∗∗ 4.702 8.403
(3.123) (50.06) (4.942) (16.21)
d.GROSS LOAN 2.517 -27.62∗ 1.044 -12.75∗∗
(1.817) (12.22) (1.644) (4.613)
d.RWA -1.380 -14.72∗∗ -3.937∗∗ -0.328
(1.412) (5.592) (1.298) (1.868)
Profitability (NITA) -11.93 -259.1 -2.370 -75.27
(20.80) (167.0) (9.653) (62.48)
Leverage (TLTA) -1.463 25.52 2.218 21.48
(3.915) (17.73) (6.082) (11.26)
Liquidity (CASH) 2.354 -9.237 1.567 -4.436
(2.384) (8.826) (2.630) (3.838)
Constant -12.90∗∗ -155.7∗∗∗ -13.08∗ -28.94∗
(4.488) (23.25) (6.363) (12.66)
Observations 1125 496 984 1266
Country Fixed Effects Yes Yes Yes Yes
AIC 656.7 189.2 438.2 231.6
BIC 802.4 227.0 482.2 277.9
Table 7: Results of estimation using market value in financial distress measures
WORLD1B BRICS1B EUROPE1B IBRD1B
ln TOTAL ASSET 0.888∗∗∗ 10.19∗∗∗ 0.561∗∗ 1.573∗∗∗
(0.211) (1.191) (0.197) (0.379)
d.CAPITAL TIER 1 9.805 281.3∗∗∗ 6.376 29.42
(5.505) (69.40) (6.646) (25.63)
d.GROSS LOAN 1.388 -54.57∗∗ 0.436 -19.61∗∗∗
(1.964) (17.63) (1.923) (5.547)
d.RWA -2.750 -29.00∗∗∗ -4.981∗∗∗ -2.246
(1.536) (7.890) (1.506) (3.036)
Profitability (NIMTA) -21.10 -560.2 7.106 -304.6
(45.30) (349.0) (47.84) (160.6)
Leverage (TLMTA) -9.874 118.5∗ -7.214 89.08∗∗∗
(6.516) (46.92) (7.077) (26.93)
Liquidity (CASHMTA) 4.417 -22.06 4.171 -12.96
(3.685) (15.58) (4.334) (8.259)
Constant -7.414 -186.9∗∗∗ -5.810 -62.97∗∗∗
(4.164) (32.60) (4.122) (15.26)
Observations 1006 404 843 1106
Country Fixed Effects Yes Yes Yes Yes
AIC 613.3 155.1 402.3 213.2
BIC 755.8 191.1 444.9 258.3
Table 8: Marginal effects after logit
Book Value WORLD1A BRICS1A EUROPE1A IBRD1A
ln TOTAL ASSET .0214833 5.54e-11 .0163783 1.96e-11
d.CAPITAL TIER 1 .1075473 8.08e-10 .0688215 2.23e-10
d.GROSS LOAN .0542441 -1.12e-10 .0673122 -8.12e-11
d.RWA -.0297471 -7.37e-11 -.0313017 -1.93e-11
Profitability (NITA) -.257064 -1.38e-09 .0627374 -1.37e-09
Leverage (TLTA) -.0315339 1.85e-10 -.0824465 5.44e-11
Liquidity (CASH) .0507312 -8.13e-11 .1123856 -3.36e-11
Market Value WORLD1B BRICS1B EUROPE1B IBRD1B
ln TOTAL ASSET .0222636 1.23e-09 .0165482 8.79e-11
d.CAPITAL TIER 1 .2459212 3.78e-08 .1298369 1.54e-09
d.GROSS LOAN .0348157 -6.68e-09 .0474716 -4.23e-10
d.RWA -.0689743 -3.82e-09 -.0799792 -1.46e-10
Profitability (NIMTA) -.5291166 -7.71e-08 .283097 -1.13e-08
Leverage (TLMTA) -.2476483 2.01e-08 -.2906795 1.50e-09
Liquidity (CASHMTA) .110779 -4.27e-09 .1790441 -4.12e-10
Table 9: Results of estimation by contract design
Equity WriteDown Equity WriteDown
ln TOTAL ASSET 0.362 0.839∗∗∗ 0.247 0.891∗∗∗
(0.190) (0.241) (0.255) (0.261)
d.CAPITAL TIER 1 53.94∗∗ 90.39∗∗∗ 196.1∗∗ 99.27∗∗∗
(17.89) (23.30) (68.53) (25.07)
d.GROSS LOAN -2.356 -0.161 -0.650 -1.192
(2.447) (2.190) (3.718) (2.286)
d.RWA -1.074 -6.769∗∗ -6.781 -8.242∗∗
(2.692) (2.547) (3.660) (2.707)
Profitability (NITA) -134.1∗ 15.17
(65.44) (50.10)
Leverage (TLTA) 24.03 2.751
(14.21) (6.088)
Liquidity (CASH) -14.76∗∗ 6.762∗
(5.092) (2.929)
Profitability (NIMTA) -365.1∗ 25.37
(172.4) (103.4)
Leverage (TLMTA) 22.29 -4.942
(17.02) (7.641)
Liquidity (CASHMTA) -17.18 5.707
(9.144) (4.492)
Constant -27.94 -16.95∗ -20.58∗ -11.81∗
(14.52) (6.823) (10.20) (5.600)
Observations 177 228 165 221
Country Fixed Effects Yes Yes Yes Yes
AIC 192.6 260.2 164.1 251.2
BIC 243.4 339.1 210.7 329.3
Table 10: Results of estimation by Basel III rules implementation
BASEL III YES NO YES NO
ln TOTAL ASSET 1.154∗∗∗ 0.528 1.017∗∗∗ 0.495
(0.263) (0.354) (0.259) (0.365)
d.CAPITAL TIER 1 8.502 1.310 8.235 17.87
(5.670) (4.501) (5.784) (16.77)
d.GROSS LOAN 2.632 7.912 1.086 5.221
(2.056) (6.528) (2.171) (6.861)
d.RWA -1.418 -0.878 -2.867 -3.461
(1.784) (2.236) (1.951) (2.953)
Profitability (NITA) -33.24 8.617
(30.17) (29.31)
Leverage (TLTA) 1.463 -1.123
(6.368) (4.009)
Liquidity (CASH) 1.980 11.63
(2.691) (8.935)
Profitability (NIMTA) -67.45 11.36
(65.19) (71.55)
Leverage (TLMTA) -14.58 0.246
(8.806) (10.74)
Liquidity (CASHMTA) 4.399 7.967
(3.912) (12.24)
Constant -17.58∗ -12.79 -6.102 -10.90
(6.918) (8.622) (5.180) (9.558)
Observations 913 212 798 208
Country Fixed Effects Yes Yes Yes Yes
AIC 525.8 140.7 486.4 138.6
BIC 631.8 191.1 589.4 188.7
Table 11: Market index description by country
Country ID Definition
BRITAIN UKX Index
The FTSE 100 Index is a capitalization-weighted index of the 100 most highly capitalized companies traded on the London Stock Exchange. The equities use an investibility weighting in the index calculation. The index was developed with a base level of 1000 as of December 30, 1983.
FRANCE CAC Index
The CAC 40, the most widely-used indicator of the Paris market, reflects the performance of the 40 largest equities listed in France, measured by free-float market-capitalization and liquidity. The index was developed with a base level of 1,000 as of December 31, 1987.
GERMANY DAX Index
The German Stock Index is a total return index of 30 selected German blue chip stocks traded on the Frankfurt Stock Exchange. The equities use free float shares in the index calculation. The DAX has a base value of 1,000 as of December 31, 1987. As of June 18, 1999 only XETRA equity prices are used to calculate all DAX indices.
IRELAND ISEQ Index The ISEQ Overall Index is a capitalization-weighted index of all Official list equities in the Irish Stock Exchangebut excludes UK registered companies. The index has a base value of 1000 as of January 4, 1988.
ITALY FTSEMIB Index
The Index consists of the 40 most liquid and capitalized stocks listed on the Borsa Italiana. In the FTSE MIB Index foreign shares are eligible for inclusion. Secondary lines are not eligible for inclusion. The calculation and methodology is unchanged from S&P MIB Index.
NETHERLANDS AEX Index
The AEX-Index is a free-float adjusted market capitalization weighted index of the leading Dutch stocks traded on the Amsterdam Exchange. The index was adjusted to the Dutch Guilder fixing rate. The old value as of 12/31/98 was 1186.38 and the new value at start of trading on 1/4/99 was 538.36, after conversion. HP and GP can be adjusted back to Dutch Guilders by typing NLG.
NORWAY OSEAX Index
Oslo All-Share Index is a market capitalization weighted index that tracks the stock performance of all shares listed on the Exchange in its respective sectors. The index is classified based on the new GICS system. The index is developed on the base value of 100 as of December 29, 1995.
SPAIN IBEX Index
The IBEX 35 is the official index of the Spanish Continuous Market. The index is comprised of the 35 most liquid stocks traded on the Continuous market. It is calculated, supervised and published by the Sociedad de Bolsas. The equities use free float shares in the index calculation. The index was created with a base level of 3000 as of December 29, 1989.
SWEDEN OMX Index
The OMX Stockholm 30 Index consists of the 30 most actively traded stocks on the Stockholm Stock Exchange and is a market weighted price index. The composition of the OMXS30 index is revised twice a year. The index was developed with a base level of 125 as of September 30, 1986. Effective on April 27, 1998 there was a 4-1 split of the index value.
SWITZERLAND SMI Index The Swiss Market Index is an index of the largest and most liquid stocks traded on the Geneva, Zurich, and Basel
Stock Exchanges. The index has a base level of 1500 as of June 1988.
BRAZIL IBOV Index The Brazil IBrX Index is a total return index that measures the return of a theoretical portfolio composed of the
top 100 stocks traded on the Bovespa.
CHINA VA000001 Index
The Shanghai Stock Exchange Composite Index is a capitalization-weighted index. The index tracks the daily price performance of all A-shares and B-shares listed on the Shanghai Stock Exchange. The index was developed on December 19, 1990 with a base value of 100. Index trade volume on Q is scaled down by a factor of 1000.
INDIA SENSEX Index
The S&P BSE Sensex Index is a cap-weighted index. The index members have been selected on the basis of liquidity, depth, and floating-stock-adjustment depth and industry representation. Sensex has a base date and value of 100 in 1978-1979.
Available: http://www.bloomberg.com
Table 12: SRISK by Book Equity
Book Value
NAME LRMES SRISK SRISK with CoCo Loss absorption
Capital Surplus
BANCO SANTANDER SA 2.8939 -11,346,006,431.16 -20,135,358,241.73 77.47% LLOYDS BANKING GROUP PLC 2.8287 -2,765,924,589.45 -15,883,186,646.84 474.25%
BARCLAYS PLC 3.3445 -7,096,935,289.18 -33,406,394,267.21 370.72%
ROYAL BANK OF SCOTLAND GROUP 2.4907 -880,135,900.16 -5,452,184,500.16 519.47%
UNICREDIT SPA 3.8394 -10,854,695,004.67 -11,087,614,444.67 2.15%
SPAREBANKEN SOR 0.0515 -81,298,629.15 -84,254,069.95 3.64%
Bank distress - CoCo Bond bail-in
IND & COMM BK OF CHINA-A 0.027 9,109,179,257.23 -2,765,953,732.80 -130.36% BANK OF CHINA LTD-H 0.0372 5,475,729,831.99 -9,041,212,124.00 -265.11%
BANCO POPULAR ESPANOL 0.4263 617,257,799.40 -224,293,943.41 -136.34%
Bank distress - not CoCo bail-in
HSBC HOLDINGS PLC 0.3611 11,465,531,996.04 791,956,149.45 -93.09%
BANCO SANTANDER BRASIL-UNIT 0.5359 744,907,647.18 112,352,331.94 -84.92%
ING GROEP NV-CVA 2.0211 3,035,580,851.00 741,903,851.00 -75.56%
HUAXIA BANK CO LTD-A 0.0394 6,190,657,297.38 3,291,614,181.22 -46.83% BANCO BILBAO VIZCAYA ARGENTA 1.3192 5,831,496,259.75 3,615,426,605.48 -38.00% SHANGHAI PUDONG DEVEL BANK-A 0.0548 14,602,409,173.38 10,317,772,215.30 -29.34% AGRICULTURAL BANK OF CHINA-A 0.0303 40,715,271,924.80 29,018,364,877.12 -28.73%
SOCIETE GENERALE SA 2.7263 2,010,841,536.79 1,462,228,576.79 -27.28%
CHINA EVERBRIGHT BANK CO-A 0.0453 12,159,778,264.69 9,277,063,006.77 -23.71% BANK OF NINGBO CO LTD -A 0.0744 3,143,158,179.68 2,463,628,816.69 -21.62% CREDIT SUISSE GROUP AG-REG 1.8753 3,844,994,664.86 3,131,235,715.35 -18.56% CHINA CONSTRUCTION BANK-H 0.0285 17,196,909,276.92 14,226,880,276.92 -17.27%
UBS GROUP AG-REG 1.7044 6,039,630,999.02 5,009,033,068.73 -17.06%
BANK OF COMMUNICATIONS CO-H 0.0338 14,782,517,515.78 12,408,702,715.78 -16.06% LUZERNER KANTONALBANK AG-REG 0.038 134,189,057.86 112,900,569.86 -15.86%
BANKINTER SA 0.7029 581,313,153.54 503,038,667.58 -13.47%
BANK OF BEIJING CO LTD -A 0.0366 5,513,629,972.31 4,801,465,949.40 -12.92% INDUSTRIAL BANK CO LTD -A 0.0374 20,446,361,063.38 18,558,385,374.20 -9.23%
BNP PARIBAS 2.3919 5,376,210,664.88 5,069,750,944.88 -5.70%
BANCO DO BRASIL S.A. 0.7545 13,549,208,297.69 13,049,208,297.69 -3.69%
CREDIT AGRICOLE SA 0.9696 18,033,766,869.48 17,472,140,949.48 -3.11%
NORDEA BANK AB 0.8641 7,147,005,712.68 6,949,901,532.68 -2.76%
DEUTSCHE BANK AG-REGISTERED 1.381 17,371,750,636.09 16,927,643,023.39 -2.56%
SPAREBANK 1 NORD-NORGE 0.3366 32,498,426.38 31,688,063.58 -2.49%
SKANDIABANKEN ASA 0.2941 345,684,693.85 341,871,221.85 -1.10%
SPAREBANKEN VEST 0.1308 363,098,675.71 360,000,229.71 -0.85%
SVENSKA HANDELSBANKEN-A SHS 0.7168 29,828,606,692.67 29,732,606,692.67 -0.32% SKANDINAVISKA ENSKILDA BAN-A 0.9286 29,323,593,097.87 29,235,593,097.87 -0.30% SWEDBANK AB - A SHARES 1.0176 28,063,712,309.63 27,991,568,309.63 -0.26%
SPAREBANK 1 SMN 0.3885 300,695,290.25 300,218,606.25 -0.16%
BANK OF NANJING CO LTD -A 0.0586 4,412,284,334.29 4,405,311,858.73 -0.16%
Table 13: SRISK by Market Value
Market Value
NAME LRMES SRISK SRISK with CoCo Loss absorption
Capital Surplus
IND & COMM BK OF CHINA-A 0.03 -2,805,227,768,809.08 -2,806,201,978,825.08 0.03% CHINA CONSTRUCTION BANK-H 0.03 -1,936,977,953,220.00 -1,937,221,953,220.00 0.01% BANK OF CHINA LTD-H 0.04 -1,741,311,948,568.21 -1,742,514,458,629.01 0.07% AGRICULTURAL BANK OF CHINA-A 0.0303 -2,186,531,365,841.55 -2,187,493,951,441.55 0.04% BANK OF COMMUNICATIONS CO-H 0.0338 -791,823,102,551.62 -792,019,102,551.62 0.02% SHANGHAI PUDONG DEVEL BANK-A 0.05 -633,067,370,489.88 -633,428,340,089.88 0.06%
NORDEA BANK AB 0.86 -915,522,215.59 -1,112,626,395.59 21.53%
INDUSTRIAL BANK CO LTD -A 0.04 -684,493,950,129.66 -684,650,370,289.66 0.02% SVENSKA HANDELSBANKEN-A SHS 0.7168 -58,457,153,943.27 -58,553,153,943.27 0.16% CHINA EVERBRIGHT BANK CO-A 0.05 -441,110,056,887.69 -441,350,703,287.69 0.05% BANK OF BEIJING CO LTD -A 0.04 -239,998,517,126.60 -240,057,475,494.60 0.02%
HUAXIA BANK CO LTD-A 0.04 -267,370,102,906.31 -267,610,749,306.31 0.09%
HSBC HOLDINGS PLC 0.36 -1,526,901,874,221.65 -1,528,180,552,586.23 0.08% BANK OF NANJING CO LTD -A 0.06 -118,991,036,150.36 -118,991,625,734.04 0.00% BANK OF NINGBO CO LTD -A 0.07 -96,230,479,237.21 -96,288,835,989.21 0.06%
BANCO DO BRASIL S.A. 0.75 -74,401,136,234.93 -74,901,136,234.93 0.67%
CREDIT AGRICOLE SA 0.9696 -23,573,159,738.30 -24,134,785,658.30 2.38%
SPAREBANK 1 SMN 0.3885 -7,004,289,995.67 -7,004,766,679.67 0.01%
BANCO POPULAR ESPANOL 0.4263 -85,772,307,523.05 -85,883,073,723.05 0.13%
SKANDIABANKEN ASA 0.2941 -4,799,140,496.22 -4,802,953,968.22 0.08%
BANKINTER SA 0.7029 -19,355,898,621.66 -19,373,621,213.66 0.09%
SPAREBANK 1 NORD-NORGE 0.3366 -5,147,599,623.74 -5,148,409,986.54 0.02%
LUZERNER KANTONALBANK AG-REG 0.038 -31,250,847,468.37 -31,272,135,956.37 0.07%
SPAREBANKEN VEST 0.1308 -12,466,521,200.10 -12,469,619,646.10 0.02%
SPAREBANKEN SOR 0.0515 -9,045,453,650.22 -9,048,409,091.02 0.03%
Bank distress - CoCo Bond bail-in
BANCO SANTANDER SA 2.89 2,274,660,316,479.03 -2,245,144,396,280.63 -198.70%
BNP PARIBAS 2.39 2,258,049,551,332.03 -2,208,528,994,764.67 -197.81%
UBS GROUP AG-REG 1.70 470,835,740,831.51 -449,345,806,387.41 -195.44%
LLOYDS BANKING GROUP PLC 2.83 1,677,403,051,608.06 -1,658,763,755,130.69 -198.89%
ING GROEP NV-CVA 2.02 900,477,603,512.19 -880,540,671,445.63 -197.79%
BANCO BILBAO VIZCAYA ARGENTA 1.32 240,808,351,235.72 -224,676,324,433.80 -193.30%
BARCLAYS PLC 3.34 1,983,568,023,896.76 -1,953,661,385,220.75 -198.49%
SOCIETE GENERALE SA 2.73 2,088,796,263,734.62 -2,055,696,975,107.42 -198.42% ROYAL BANK OF SCOTLAND GROUP 2.49 974,664,379,112.59 -954,512,043,050.51 -197.93% CREDIT SUISSE GROUP AG-REG 1.88 644,537,409,429.77 -626,580,978,404.87 -197.21% DEUTSCHE BANK AG-REGISTERED 1.381 449,149,773,807.51 -407,806,091,288.36 -190.80%
UNICREDIT SPA 3.84 2,291,767,826,824.00 -2,271,830,250,929.21 -199.13%
Bank distress - not CoCo bail-in
SWEDBANK AB - A SHARES 1.0176 33,042,599,504.30 23,606,735,370.58 -28.56% SKANDINAVISKA ENSKILDA BAN-A 0.93 11,775,304,672.17 11,687,304,672.17 -0.75%
Table 14: Optimal K
NAME COUNTRY CAPITAL TYPE LRMES Optimal K
AGRICULTURAL BANK OF CHINA-A CHINA Equity Conversion 0.030 6.55%
BANCO BILBAO VIZCAYA ARGENTA SPAIN Equity Conversion 1.319 2.52%
BANCO DO BRASIL S.A. BRAZIL Permanent Write Down 0.755 1.48%
BANCO POPULAR ESPANOL SPAIN Equity Conversion 0.426 5.39%
BANCO SANTANDER BRASIL-UNIT BRAZIL Equity Conversion 0.536 7.11%
BANCO SANTANDER SA SPAIN Equity Conversion 2.894 13.27%
BANK OF BEIJING CO LTD -A CHINA Equity Conversion 0.037 6.14%
BANK OF CHINA LTD-H CHINA Equity Conversion 0.037 7.79%
BANK OF COMMUNICATIONS CO-H CHINA Equity Conversion 0.034 6.76%
BANK OF NANJING CO LTD -A CHINA Equity Conversion 0.059 5.10%
BANK OF NINGBO CO LTD -A CHINA Equity Conversion 0.074 5.48%
BANKINTER SA SPAIN Equity Conversion 0.703 1.87%
BARCLAYS PLC BRITAIN Equity Conversion 3.345 11.27%
BNP PARIBAS FRANCE Temporary Write Down 2.392 6.38%
CHINA CONSTRUCTION BANK-H CHINA Equity Conversion 0.029 7.42%
CHINA EVERBRIGHT BANK CO-A CHINA Equity Conversion 0.045 5.85%
CREDIT AGRICOLE SA FRANCE Temporary Write Down 0.970 0.12%
CREDIT SUISSE GROUP AG-REG SWITZERLAND Permanent Write Down 1.875 4.87%
DEUTSCHE BANK AG-REGISTERED GERMANY Temporary Write Down 1.381 1.44%
HSBC HOLDINGS PLC BRITAIN Equity Conversion 0.361 4.99%
HUAXIA BANK CO LTD-A CHINA Equity Conversion 0.039 6.17%
IND & COMM BK OF CHINA-A CHINA Equity Conversion 0.027 7.74%
INDUSTRIAL BANK CO LTD -A CHINA Equity Conversion 0.037 5.61%
ING GROEP NV-CVA NETHERLANDS Equity Conversion 2.021 5.72%
LLOYDS BANKING GROUP PLC BRITAIN Equity Conversion 2.829 10.07%
LUZERNER KANTONALBANK AG-REG SWITZERLAND Partial Permanent Write Down 0.038 5.39%
NORDEA BANK AB SWEDEN Temporary Write Down 0.864 0.63%
ROYAL BANK OF SCOTLAND GROUP BRITAIN Equity Conversion 2.491 8.63%
SHANGHAI PUDONG DEVEL BANK-A CHINA Equity Conversion 0.055 6.19%
SKANDIABANKEN ASA NORWAY Temporary Write Down 0.294 4.73%
SKANDINAVISKA ENSKILDA BAN-A SWEDEN Temporary Write Down 0.929 0.37%
SOCIETE GENERALE SA FRANCE Temporary Write Down 2.726 7.11%
SPAREBANK 1 NORD-NORGE NORWAY Temporary Write Down 0.337 7.76%
SPAREBANK 1 SMN NORWAY Temporary Write Down 0.389 6.52%
SPAREBANKEN SOR NORWAY Temporary Write Down 0.052 8.51%
SPAREBANKEN VEST NORWAY Temporary Write Down 0.131 6.49%
SVENSKA HANDELSBANKEN-A SHS SWEDEN Temporary Write Down 0.717 1.25%
SWEDBANK AB - A SHARES SWEDEN Equity Conversion 1.018 0.09%
UBS GROUP AG-REG SWITZERLAND Permanent Write Down 1.704 3.88%
UNICREDIT SPA ITALY Temporary Write Down 3.839 15.29%