HESSD
8, 3543–3570, 2011Analyses of impacts of China’s international trade
Z. Y. Zhang et al.
Title Page
Abstract Introduction
Conclusions References
Tables Figures
◭ ◮
◭ ◮
Back Close
Full Screen / Esc
Printer-friendly Version Interactive Discussion
Discussion
P
a
per
|
Dis
cussion
P
a
per
|
Discussion
P
a
per
|
Discussio
n
P
a
per
|
Hydrol. Earth Syst. Sci. Discuss., 8, 3543–3570, 2011 www.hydrol-earth-syst-sci-discuss.net/8/3543/2011/ doi:10.5194/hessd-8-3543-2011
© Author(s) 2011. CC Attribution 3.0 License.
Hydrology and Earth System Sciences Discussions
This discussion paper is/has been under review for the journal Hydrology and Earth System Sciences (HESS). Please refer to the corresponding final paper in HESS if available.
Analyses of impacts of China’s
international trade on its water resources
and uses
Z. Y. Zhang1,2, H. Yang3, M. J. Shi1,2, A. J. B. Zehnder4,5, and K. C. Abbaspour3
1
Graduate University of Chinese Academy of Sciences, 100049, Beijing, China
2
Research Centre on Fictitious Economy & Data Science, Chinese Academy of Sciences, 100190, Beijing, China
3
Swiss Federal Institute of Aquatic Science and Technology, 8600, D ¨ubendorf, Switzerland
4
Nanyang Technological University (NTU), 639798, Singapore
5
Alberta Water Research Institute (AWRI), Edmonton, AB T5N 1M9, Canada Received: 24 March 2011 – Accepted: 28 March 2011 – Published: 12 April 2011 Correspondence to: H. Yang ([email protected])
HESSD
8, 3543–3570, 2011Analyses of impacts of China’s international trade
Z. Y. Zhang et al.
Title Page
Abstract Introduction
Conclusions References
Tables Figures
◭ ◮
◭ ◮
Back Close
Full Screen / Esc
Printer-friendly Version Interactive Discussion
Discussion
P
a
per
|
Dis
cussion
P
a
per
|
Discussion
P
a
per
|
Discussio
n
P
a
per
|
Abstract
This study provides an insight into the impact of China’s international trade of goods and services on its water resources and uses. Virtual water flows associated with China’s international trade are quantified in an input-output framework. The analysis is scaled down to the sectoral and provincial levels to trace the origins and destinations 5
of virtual water flows associated with the international trade. The results reveal that China is a net virtual water exporter of 4.7×10¹⁰m3year−1, accounting for 2.1% of
its total water resources and 8.9% of the total water use. Water scarce regions tend to have higher percentages of virtual water export relative to their water resources and water uses. In the water scarce Huang-Huai-Hai region, the net virtual water 10
export accounts for 7.9% of the region’s water resources and 11.2% of its water uses. For individual sectors, major net virtual water exporters are those where agriculture provides raw materials in the initial process of the production chain and/or pollution intensity is high. The results suggest that China’s economic gains from being a world “manufacture factory” have come at a high cost to its water resources and through 15
pollution to its environment.
1 Introduction
International trade between countries entails flows of virtual water, i.e., the water used for the production of traded products (Allan, 1993; Hoekstra and Hung, 2005; Yang et al., 2006). An inflow of virtual water through trade reduces the pressure on domes-20
tic water resources, whereas an outflow of virtual water adds to the pressure. With the world markets crammed with “made in China” products on the one hand and the increasingly severe water stress and pollution endured in most parts of China on the other, the impact of China’s international trade of goods and services on its water re-sources and uses warrants a scrutiny.
HESSD
8, 3543–3570, 2011Analyses of impacts of China’s international trade
Z. Y. Zhang et al.
Title Page
Abstract Introduction
Conclusions References
Tables Figures
◭ ◮
◭ ◮
Back Close
Full Screen / Esc
Printer-friendly Version Interactive Discussion
Discussion
P
a
per
|
Dis
cussion
P
a
per
|
Discussion
P
a
per
|
Discussio
n
P
a
per
|
There is a large literature on the investigation of the role of virtual water trade in ad-dressing water scarcity and in redistributing water resources (virtually). Studies on the relevant issues have hitherto mostly concerned with agricultural products due to their high water intensity in production and large share in total water use. For instance, Yang and Zehnder (2002) estimated the volume of virtual water embedded in food imports 5
into the countries in the southern Mediterranean region. They highlighted that food im-ports were imperative for compensating water resources deficiency in these countries. The major components of the virtual water flows were investigated at the global level by Zimmer and Renault (2003). This analysis was further refined by Hoekstra and Hung (2005). They quantified the volumes of virtual water flows between nations related to 10
international crop trade and analyzed virtual water balance in relation to national water needs and water availability. Yang et al. (2006) assessed the efficiency of the water use embodied in the international food trade from the perspectives of exporting and import-ing countries. Hoekstra and Chapagain (2007) and Chapagain and Hoekstra (2008) examined the water consumption in individual countries with distinction of internal and 15
external water sources. The results show that worldwide, about 16% of the water use is for the production of goods and services that are for export.
Recent years have seen some studies extending the assessment of virtual water flows associated with the international trade to all the sectors of an economy. Zhao et al. (2009) quantified China’s virtual water trade for each individual sector using an 20
input-output model. They found that China as a whole is a net virtual water exporter, although the agricultural sector is a net importer. Using the similar approach, Dietzen-bacher and Velazquez (2007) assessed the virtual water embodied in the trade of 25 sectors in the Andalusian economy system and the findings reveal Andalusia as a net virtual water exporter. So far, however, studies on virtual water flows associated with 25
international trade of all the sectors in a national economy remain few.
HESSD
8, 3543–3570, 2011Analyses of impacts of China’s international trade
Z. Y. Zhang et al.
Title Page
Abstract Introduction
Conclusions References
Tables Figures
◭ ◮
◭ ◮
Back Close
Full Screen / Esc
Printer-friendly Version Interactive Discussion
Discussion
P
a
per
|
Dis
cussion
P
a
per
|
Discussion
P
a
per
|
Discussio
n
P
a
per
|
studies have been conducted at the country level or for a single region. For a country like China which is vast in territory and uneven in water resources distribution, treating the country as a whole overlooks the regional variations in water endowments and the impacts of virtual water trade on regional water resources and uses. A sub-country study is more pertinent to reflect the specific local conditions and regional water prob-5
lems. Thirdly, the hitherto studies generally lack the specification of the origins of the virtual water export and the destinations of the virtual water import for a given coun-try. The specification of the origins/destinations of the virtual water export/import is important for identifying the prominent regions influencing national virtual water trade patterns and the regions where water resources and uses are significantly affected by 10
their trade patterns.
This paper aims to quantify the virtual water flows associated with China’s inter-national trade of goods and services in a framework of input-output model. All the economic activities in the national economy are considered in the assessment. The analysis is scaled down to the provincial level to specify the impact of virtual water 15
trade of individual economic sectors on water resources and uses across regions. The results of this study help a better understanding of China’s water problems and pro-vide scientific references for supporting policies to alleviate the negative impact of its international trade on water resources and uses in different regions.
2 Data and methodology
20
2.1 Data
The main data foundation of this study is the 2002 regional input-output tables of 30 provinces, autonomous regions and municipalities in mainland China. Tibet is not in-cluded due to data unavailability. For simplicity, these 30 administrative entities are all called provinces in this study. In the original provincial input-output table, there are 60 25
HESSD
8, 3543–3570, 2011Analyses of impacts of China’s international trade
Z. Y. Zhang et al.
Title Page
Abstract Introduction
Conclusions References
Tables Figures
◭ ◮
◭ ◮
Back Close
Full Screen / Esc
Printer-friendly Version Interactive Discussion
Discussion
P
a
per
|
Dis
cussion
P
a
per
|
Discussion
P
a
per
|
Discussio
n
P
a
per
|
this study, considering the sector correspondence between regional input-output tables and the data of sectoral direct freshwater use, the 60 sectors are aggregated into 20 sectors, including 1 primary sector, 16 secondary sectors and 3 tertiary sectors (Ta-ble 1). The national average sectoral direct freshwater uses for a monetary unit of production are from Zhao et al. (2009).
5
In this study, water use in industrial sectors is defined as the freshwater intake during the whole production process. In agriculture, water use is the irrigation water supply to the field. Water use defined here differs from water consumptive use which refers to water consumed (hence no longer available for other uses) during the production processes. In both agriculture and industrial sectors, part of the water is returned to the 10
natural water systems through percolation and/or drainage and wastewater discharge. The return flow is not considered in this study because of the lack of data on the return rate and the pollution intensity of wastewater in individual sectors.
In this study, water resources and water uses concern only blue water, i.e., the sur-face and ground water. Soil moisture, the so-called green water is not considered. The 15
definition of blue and green water follows that by Falkenmark and Rockstr ¨om (2006). The exclusion of green water is mainly for the content consistency of water use across economic sectors. Except for the agricultural sector and the sectors where agriculture provides raw materials in the production processes, all the other sectors use exclu-sively blue water, which has the possibility of choosing alternative water sources and 20
thus the opportunity cost is high in relation to green water. Green water use is typically 60–80% of the water use in the agricultural sector; if green water is not utilized for plant growth it mainly evaporates and is lost for local use. Including green water in water use accounting greatly increases the share of agricultural water use in total water use. Mixing blue and green water in the analysis could derive misleading conclusions in as-25
HESSD
8, 3543–3570, 2011Analyses of impacts of China’s international trade
Z. Y. Zhang et al.
Title Page
Abstract Introduction
Conclusions References
Tables Figures
◭ ◮
◭ ◮
Back Close
Full Screen / Esc
Printer-friendly Version Interactive Discussion
Discussion
P
a
per
|
Dis
cussion
P
a
per
|
Discussion
P
a
per
|
Discussio
n
P
a
per
|
2.2 Methodology
2.2.1 The basic mathematical structure of the input-output model
Input-output table/model, firstly developed by Leontief (1941), represents the monetary transactions of goods and services among different sectors of economic system. It pro-vides a technique to specify how the substances flow among sectors through supplying 5
inputs (including water) for the outputs (where the virtual water is embedded) in the economic system. Since the information on interconnections and interdependences of economic units are essential to the determination of the virtual water content of a prod-uct, the input-output model is a practical tool in the virtual water trade estimation.
The basic mathematical structure of the input-output system consists of n linear 10
equations as shown in Eq. (1), depicting how the productions of an economy depend on inter-sectoral relationships and final demand.
xi= n
X
j=1
xi j+yi (1)
Where n is the number of economic sectors; xi is the total output of sector i; xi j is
the inter-sectoral monetary flows from sector i to sector j. yi is the final demand of
15
sectori.
The direct input refers to the input provided by a sector for the production of another sector in the last stage of the production chain and it numerically equals to the elements of the inter-sectoral flow matrix (i.e., xi j is the direct input from sector i to sector j). The direct input coefficientαi j indicates the amount of input from sector i required to 20
increase one monetary unit output of sectorj (Eq. 2).
αi j=xxi j
j
HESSD
8, 3543–3570, 2011Analyses of impacts of China’s international trade
Z. Y. Zhang et al.
Title Page
Abstract Introduction
Conclusions References
Tables Figures
◭ ◮
◭ ◮
Back Close
Full Screen / Esc
Printer-friendly Version Interactive Discussion
Discussion
P
a
per
|
Dis
cussion
P
a
per
|
Discussion
P
a
per
|
Discussio
n
P
a
per
|
Therefore, Eq. (1) can be rewritten so as to include the direct input coefficientαi j:
xi= n
X
j=1
αi jxj+yi (3)
Equation (3) can be shown as follows in matrix notation:
X=AX+Y (4)
WhereX,AandYare respectively the matrixes of output, direct input coefficients and 5
final demand.
Assuming the matrixAof direct input coefficients is constant, it is possible to change Eq. (4) into a demand-driven format:
X=(I−A)−1Y, B=(I−A)−1=bi j
(5)
Where (I−A)−1 is known as Leontief inverse matrix;bi j denotes how much output of
10
sectori is required to meet one monetary unit of the final demand of sectorj. Thus, the link between final demand and corresponding direct and indirect production has been built up with Leontief inverse matrix as the bridge.
2.2.2 Direct water use coefficient (DWUC) and total water use coefficient
(TWUC)
15
In order to combine the monetary trade with the associated water use, the essential step is to derive DWUC, the amount of direct water intake to produce one monetary unit of output, representing the direct or the first round effects of the sectoral interaction in the economy (Bouhia, 2001; Hubacek and Sun, 2005). DWUC can be expressed as Eq. (6).
20
W=
ωj
, ωj=
wj
HESSD
8, 3543–3570, 2011Analyses of impacts of China’s international trade
Z. Y. Zhang et al.
Title Page
Abstract Introduction
Conclusions References
Tables Figures
◭ ◮
◭ ◮
Back Close
Full Screen / Esc
Printer-friendly Version Interactive Discussion
Discussion
P
a
per
|
Dis
cussion
P
a
per
|
Discussion
P
a
per
|
Discussio
n
P
a
per
|
Where W is the matrix of DWUC (measured in m3/104Yuan in this study); ωj is the DWUC of sectorj;ωj is calculated by dividing the freshwater use of sectorj wj by total output of sectorj xj (in monetary term).
TWUCδj, an indicator of the total water consumption throughout the whole produc-tion chain, can be achieved by multiplying DWUCωj with the Leontief inverse matrix 5
[bi j].
D=
δj, δj=
X
i
ωi×bi j (7)
Where D is the matrix of TWUC, which links the monetary product trade with their corresponding total amount of water use.
2.2.3 The water use to meet domestic final demand
10
The water use to meet domestic final demand can be obtained by multiplying TWUC with final demand:
T=htsji, tjs=δjS·yjS (8)
WhereT is the matrix of water use for domestic final demand;tjs is the water use for final demand of sectorj in regionS;δjS is the TWUC of sectorj in regionS;yjS is the 15
final demand of sectorj in regionS.
HESSD
8, 3543–3570, 2011Analyses of impacts of China’s international trade
Z. Y. Zhang et al.
Title Page
Abstract Introduction
Conclusions References
Tables Figures
◭ ◮
◭ ◮
Back Close
Full Screen / Esc
Printer-friendly Version Interactive Discussion
Discussion
P
a
per
|
Dis
cussion
P
a
per
|
Discussion
P
a
per
|
Discussio
n
P
a
per
|
2.2.4 Virtual water trade accounting
In the virtual water trade analysis, the virtual water export can be obtained through Eq. (9).
U=huSji, ujS=δjS×eSj (9)
WhereUis the matrix of the virtual water export;uSj is the virtual water export of sector 5
j in region S; δjS is the TWUC of sector j in region S; eSj is the export of sector j in regionS.
The regional input-output tables used in this study are characterized as import-competitive table. The underlying assumption is that the import is import-competitive with domestic supplies and thus can be incorporated into domestic supplies of final de-10
mand as well as the intermediate demand. The import consisting of the two parts can be expressed as:
mSj =mSj(in)+mSj(f) (10)
WheremSj is the total import of sectorj in regionS;mSj(in)is the import for the
interme-diate demand of sectorj in regionS;mSj(f) is the import for the final demand of sector 15
jin regionS. The two parts are determined using a distributing coefficientβjS.
βjS= y
S j n
P
i=1
xSji+yjS
(11)
WhereβjS is the distribution proportion of the final demand part in the total import of sector j in region S; yjS is the final demand of sector j in region S; Pn
i=1x
S ji is the
HESSD
8, 3543–3570, 2011Analyses of impacts of China’s international trade
Z. Y. Zhang et al.
Title Page
Abstract Introduction
Conclusions References
Tables Figures
◭ ◮
◭ ◮
Back Close
Full Screen / Esc
Printer-friendly Version Interactive Discussion
Discussion
P
a
per
|
Dis
cussion
P
a
per
|
Discussion
P
a
per
|
Discussio
n
P
a
per
|
Thus,vjS(f), the virtual water imported for final demand, can be obtained by
multiply-ing the import incorporated in final demandmSj(f)with the corresponding TWUCδjS as shown in Eq. (12).
vjS(f)=δjS·mSj(f) (12)
While the virtual water imported for intermediate use and consumed by domestic final 5
demand can be derived through Eq. (13):
vjS(in)=δjS·mSj(in)·ηSj (13)
WhereηSj is an adjusting coefficient derived as an adjusting coefficient derived as the proportion of the outcome of final demand minus export over the final demand of final demand, representing that only a portion of virtual water embodied in intermediate 10
input will be used for domestic final demand.
The virtual water import with the two parts can be obtained as:
V=hvjSi,vjS=vjS(in)+vjS(f) (14)
WhereVis the matrix of virtual water import;vjS is the virtual water import of sectorj in
regionS;vjS(in)is the virtual water import for intermediate demand of sectorj in region 15
S;vjS(f) is the virtual water import for final demand of sectorj in regionS.
3 Results
3.1 Virtual water import and export in individual sectors
HESSD
8, 3543–3570, 2011Analyses of impacts of China’s international trade
Z. Y. Zhang et al.
Title Page
Abstract Introduction
Conclusions References
Tables Figures
◭ ◮
◭ ◮
Back Close
Full Screen / Esc
Printer-friendly Version Interactive Discussion
Discussion
P
a
per
|
Dis
cussion
P
a
per
|
Discussion
P
a
per
|
Discussio
n
P
a
per
|
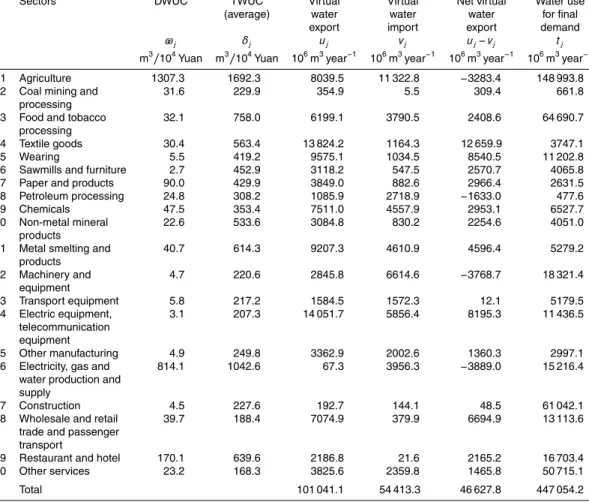
Eqs. (6) and (7), DWUC and TWUC for each sector are calculated. The virtual wa-ter import and export in each sector are derived by multiplying the import and export values with TWUC.
TWUC is higher than DWUC in all the sectors. This is expected because DWUC only accounts for the water use at the last stage of the production chain, whereas TWUC is 5
the accumulated water use in the whole production chain.
Sector 1 (agriculture) has the highest water-intensity, with DWUC of 1307.3 m3/104Yuan and TWUC of 1692.3 m3/104Yuan. This is followed by Sector 16 (electricity, gas and water production and supply) where DWUC and TWUC are 814.1 m3/104Yuan and 1042.6 m3/104Yuan, respectively. It is noticed that the 10
difference between DWUC and TWUC in these two sectors are relatively small in comparison to the differences in other sectors. The high DWUC indicates that the direct water use is the major form of water use in Sector 1 and Sector 16. In contrast, most manufacturing industry sectors have large indirect water consumption. For manufacturing sectors like Sector 3 (food and tobacco processing), Sector 4 (textile 15
goods), Sector 5 (wearing), Sector 6 (sawmills and furniture) and Sector 10 (non-metal mineral products), the shares of the direct water use in the total water use of the whole production chain are lower than 5%. Hence, over 95% of the water use in these sectors occurred in an indirect way, i.e., in the previous processing stages prior to the final stage.
20
The total amount of virtual water import is 5.4×10¹⁰m3year−1, whereas the total
virtual water export is 1.0×10¹¹m3year−1. Hence, China turns out to be a net virtual
water exporter of 4.7×10¹⁰m3year−1in view of the whole national economy.
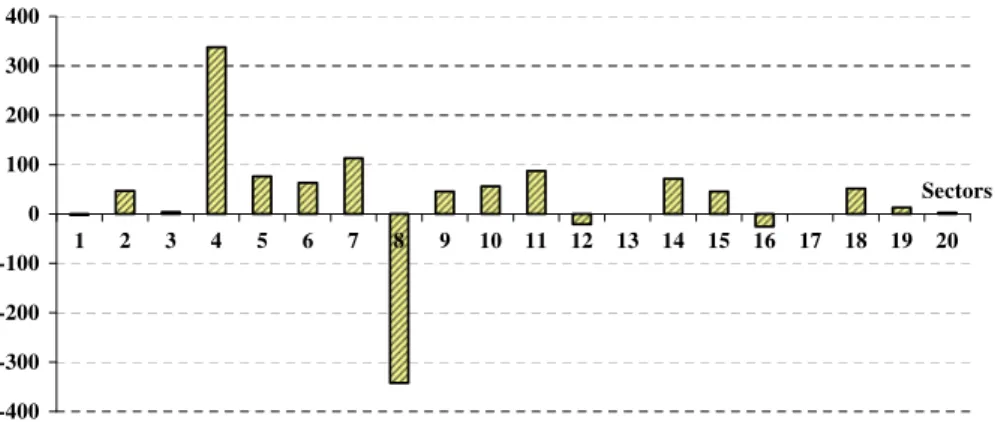
For individual sectors, the virtual water trade balance varies. Sector 1 (agriculture), Sector 8 (petroleum processing), Sector 12 (machinery and equipment) and Sector 16 25
(electricity, gas and water production and supply) are the net importers of virtual water. The other 16 sectors are net exporters.
HESSD
8, 3543–3570, 2011Analyses of impacts of China’s international trade
Z. Y. Zhang et al.
Title Page
Abstract Introduction
Conclusions References
Tables Figures
◭ ◮
◭ ◮
Back Close
Full Screen / Esc
Printer-friendly Version Interactive Discussion
Discussion
P
a
per
|
Dis
cussion
P
a
per
|
Discussion
P
a
per
|
Discussio
n
P
a
per
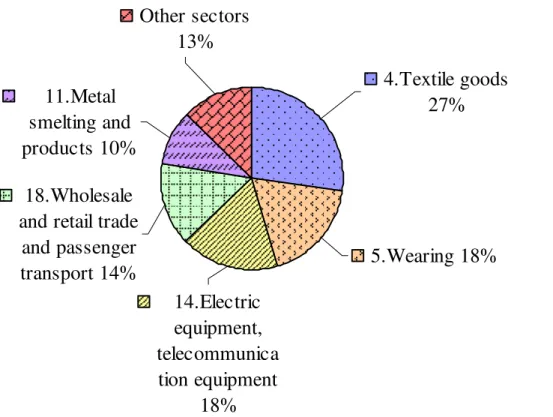
|
and Sector 11 (metal smelting and products) are the five major net virtual water ex-porters (Fig. 1). These sectors are the mainstay industries in China, greatly contribut-ing to China’s role as the “world manufacturcontribut-ing factory”. Their total net virtual water export amounts to 4.1×10¹⁰m3year−1, or 87% of the total net virtual water export of
the country. 5
The ratio of the net virtual water export to water use for domestic final demand indi-cates how the water use is distributed between domestic demand and external (abroad) demand (export). At the national level, the ratio is 10.4%, indicating that a considerable amount of water use in China is for the production of goods and services for export.
Sector 4 (textile goods) has the highest ratio of net virtual water export to water 10
use for final demand, 337.9% (Fig. 2). This suggests that the textile goods are mostly exported to other countries. Besides, Sector 7 (paper and products), Sector 11 (metal smelting and products) and Sector 5 (wearing) are also of high ratios, respectively 112.7%, 87.1% and 76.2%. Sector 8 (petroleum processing) is the major net virtual water importer with the ratio of−342%. Petroleum, an important intermediate material
15
for industries, is badly needed to support the continuous economic growth in China. The domestic production is far short to meet the demand. The dependence on import is large and increasing over the years.
3.2 Regional variations in virtual water trade
With significant discrepancies in natural conditions and economic development levels 20
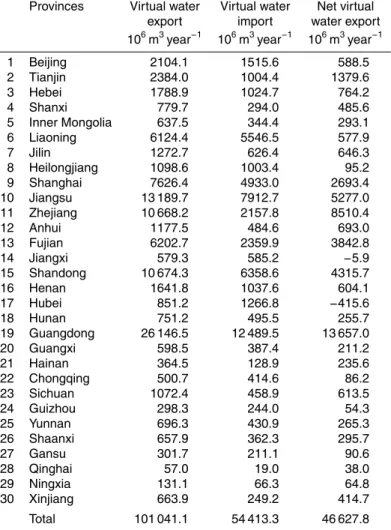
among regions, the virtual water trade patterns also appear to show spatial variations. Table 2 provides the quantity of virtual water trade of individual provinces associated with their international trade of final products.
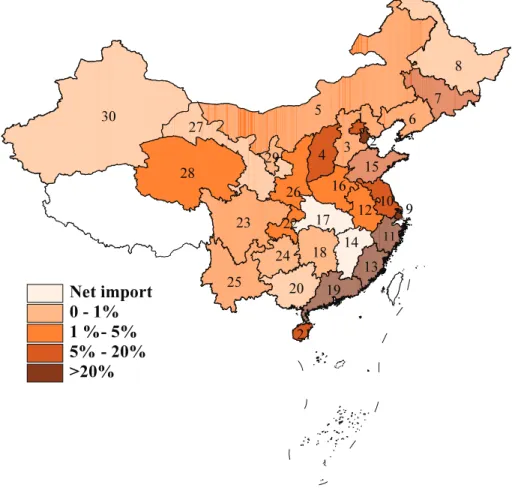
Except for Jiangxi and Hubei, all the other provinces are net virtual water exporters. Guangdong is the largest net virtual water exporter with the net virtual water export of 25
1.4×10¹⁰m3year−1, accounting for 29% of the total net virtual water export of China.
HESSD
8, 3543–3570, 2011Analyses of impacts of China’s international trade
Z. Y. Zhang et al.
Title Page
Abstract Introduction
Conclusions References
Tables Figures
◭ ◮
◭ ◮
Back Close
Full Screen / Esc
Printer-friendly Version Interactive Discussion
Discussion
P
a
per
|
Dis
cussion
P
a
per
|
Discussion
P
a
per
|
Discussio
n
P
a
per
|
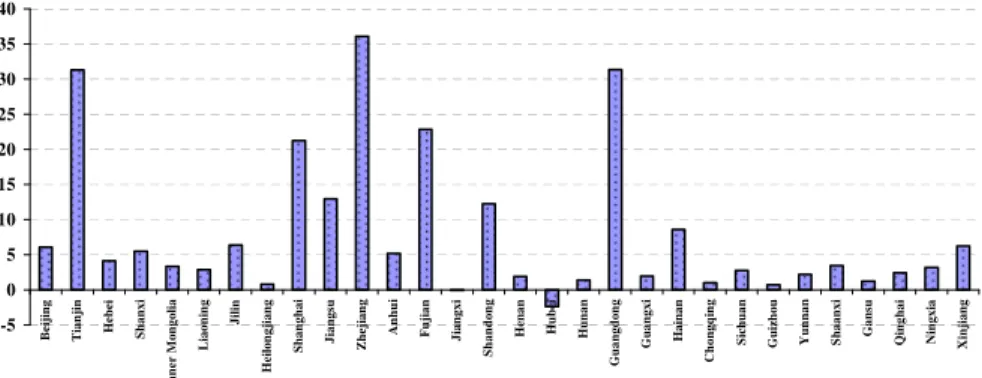
With two exceptions, all other provinces are net virtual water exporters (Fig. 2, Ta-ble 2). Some provinces have very high ratios, implying an export oriented economy. The ratio of Zhejiang is 36%, the highest among all the provinces. Generally, the provinces in the Eastern Coastal area of China have relatively higher ratios, consistent with their roles as the major contributors of the national economy and export in China. 5
3.3 Sectoral virtual water trade in selected water scarce provinces
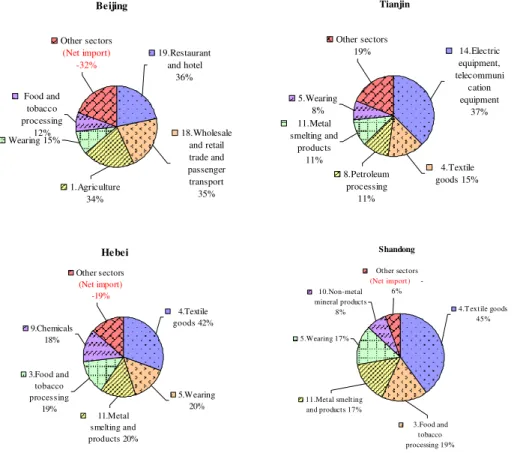
As a large country, water resources endowments vary across provinces. Provinces in the north in general are water scarce. It is interesting to take a closer look at the virtual water trade patterns of the water scarce provinces to gain some insights into the impact of the international trade on their water resources. Figure 4 shows the major exporting 10
sectors in 4 extreme water scarce provinces, Beijing, Tianjin, Hebei, and Shandong. The net virtual water export in these 4 provinces accounts for 15.1% of the total net virtual water export of China, whereas the sum of their water resources is only 2.2% of the national total.
Figure 4 presents the share of the first 5 major net virtual water exporting sectors in 15
total net virtual water export in the selected provinces. Apart from Sector 4 and Sector 5, (textile and wearing sectors) there are significant variations in other major sectors in the selected provinces. They reflect the sectoral specialization in these provinces. For example, the net virtual water export in Beijing mainly concentrates in the sectors re-lated to services (Sector 18 and Sector 19). In Tianjin, Sector 14 (electrical goods and 20
communication equipments) and Sector 8 (petroleum processing) have large shares in net virtual water export. The large net virtual water export in Sector 8 corresponds to Tianjin’s role as one of the most important petroleum production bases in China. Tianjin’s advantage in port transportation conditions facilitates the export of petroleum products. In Shandong, the net virtual water export is highly concentrated in the five 25
major exporting sectors. The share of the remaining sectors is−6%, meaning that the
HESSD
8, 3543–3570, 2011Analyses of impacts of China’s international trade
Z. Y. Zhang et al.
Title Page
Abstract Introduction
Conclusions References
Tables Figures
◭ ◮
◭ ◮
Back Close
Full Screen / Esc
Printer-friendly Version Interactive Discussion
Discussion
P
a
per
|
Dis
cussion
P
a
per
|
Discussion
P
a
per
|
Discussio
n
P
a
per
|
4 Discussion
4.1 The scale of virtual water export and impact on domestic water resources
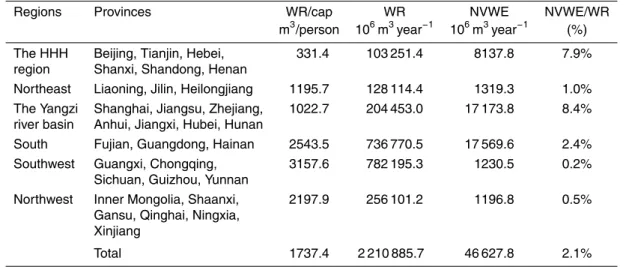
The results reveal that China is a net virtual water exporter. Given the total water re-sources of 2.2×10¹²m3year−1(average of 2002–2009), the net virtual water export is
about 2.1% of the total water resources of the country. This is seemingly a small per-5
centage. However, not all the water resources of the country are accessible because of geographical, topographical and other barriers. This is particularly the case for the abundant water resources in the southwest part of the country, which are generally not accessible for other regions. Looking into individual regions, the situation differs largely. In the Huang-Huai-Hai region (the HHH region), which is extremely water scarce, the 10
net virtual water export is about 7.9% of the water resources of the region. 17.5% of China’s net virtual water export is from this region. Hence, the impact of China’s in-ternational trade on its water resources is much more significant when reviewed at the regional level (Table 3).
It should be pointed out that a country or region’s international trade occurs for mul-15
tiple reasons, including economic development, political motivation, social considera-tion, historical trend, natural endowments (apart from water), technology, etc., rather than the water resources concern only. Even for the water sufficient regions, it is im-prudent to claim that virtual water export is laudable because of the needs to consider trade-offs between the economic well-being and the state of the environment. The re-20
sults from this study indicate that it is important to incorporate virtual water trade into the strategic water and trade planning in China, particularly for the regions with server water scarcity.
4.2 Impact of the international trade on water uses
According to the Chinese statistics, the total water use in China is 5.5×10¹¹m3year−1.
25
HESSD
8, 3543–3570, 2011Analyses of impacts of China’s international trade
Z. Y. Zhang et al.
Title Page
Abstract Introduction
Conclusions References
Tables Figures
◭ ◮
◭ ◮
Back Close
Full Screen / Esc
Printer-friendly Version Interactive Discussion
Discussion
P
a
per
|
Dis
cussion
P
a
per
|
Discussion
P
a
per
|
Discussio
n
P
a
per
|
use. In other words, 8.9% of the water use in China is for the production of goods and services for export. For individual provinces, variations are significant (Fig. 5). It is noticeable that some water scarce provinces, such as Beijing, Tianjin, Jiangsu, Shandong, have large shares. In Tianjin, an extremely water scarce area, 63% of the water use is “exported” in the form of virtual water. In Beijing and Shandong, the shares 5
are 17.9% and 20%, respectively. Hence, the virtual water export in these provinces has significant impact on their water uses. With strong export-driving growth mode, it is expected that water demand will continue to increase, putting further pressure on their already stressed water resources.
The total water use for meeting the domestic final demand in China is 4.5×
10
1011m3year−1 based on the data in 2002 (Table 1) and the total water use is ap-proximately 5.5×10¹¹m3year−1 in 2002 (China Statistical Bureau, 2003). The gap is
1.0×10¹¹m3year−1. This means that China uses about 24% more water than that
required by its people for the final demand. Subtracting the net virtual water export of 4.7×10¹⁰m3year−1, there is a missing amount of 6.1×10¹⁰m3year−1in the national
15
water balance. This is about 10.9% of the total water use of the country. The “missing” water may be partly attributed to the return flow, treated water and water loss during the supply and use. Even when the statistical errors and lumping errors are considered, the unproductive losses are still expected to be significant. Hence, reducing losses in the overall water management and water supply system could make a significant 20
contribution to the alleviation of water stress in China.
4.3 Sectoral scrutiny
The net virtual water export is highly concentrated in Sector 4 (textile goods), Sector 5 (wearing), Sector 14 (electrical goods and communication equipments) (Fig. 1). The three sectors account for 63% of total net virtual water export of the country. These 25
HESSD
8, 3543–3570, 2011Analyses of impacts of China’s international trade
Z. Y. Zhang et al.
Title Page
Abstract Introduction
Conclusions References
Tables Figures
◭ ◮
◭ ◮
Back Close
Full Screen / Esc
Printer-friendly Version Interactive Discussion
Discussion
P
a
per
|
Dis
cussion
P
a
per
|
Discussion
P
a
per
|
Discussio
n
P
a
per
|
sectors is rather high in water scarce provinces. The results suggest that the interna-tional trade patterns and structure of the whole country and individual provinces have been shaped mainly by other factors, rather than water resources endowments.
The study finds that the agriculture sector is a net importer of virtual water at the national level, which is consistent with the results in other studies (Hoekstra and Hung, 5
2002; Zhao et al., 2009). However, it is not the case for all the provinces. Our study reveals that provinces like Fujian, Anhui, Hubei, Hunan, and Sichuan are net exporters in the agricultural sector.
It is worth noting that Food and tobacco processing, Textile, and Wearing are typical downstream industries of agriculture, i.e., using raw materials from agriculture in the 10
initial stage of their production processes. Although the agricultural sector is a net im-porter in China, its downstream industries are not (Table 1). The situation suggests that part of the imported virtual water from agriculture is re-exported through the exports of products in the downstream sectors.
The international trade partners in China contribute to its sober water situation not 15
only in quantity, but also in quality. The wastewater discharge from Food and tobacco processing, Textile, and Wearing, Paper and products, and Metal smelting and products and Smelting process accounts for 53% of China’s total industrial wastewater discharge (China Statistical Bureau, 2009). Small scale and low technology are the common features of enterprises in these sectors, and they are notorious for releasing heavily 20
polluted waste water often without any treatment (Wang et al., 2008). In essence, China is exporting a large amount of virtual fresh water to other countries while at the same time keeping heavily polluted water to itself. The results suggest that China’s economic gains from being a world “manufacture factory” have been attained at a high cost to its water resources and through pollution to its environment.
25
4.4 Concluding remarks
HESSD
8, 3543–3570, 2011Analyses of impacts of China’s international trade
Z. Y. Zhang et al.
Title Page
Abstract Introduction
Conclusions References
Tables Figures
◭ ◮
◭ ◮
Back Close
Full Screen / Esc
Printer-friendly Version Interactive Discussion
Discussion
P
a
per
|
Dis
cussion
P
a
per
|
Discussion
P
a
per
|
Discussio
n
P
a
per
|
in 2002. The difference stemmed primarily from the regional discrepancy incorporated in the assessment process. Regional discrepancy in TWUC was not considered in Zhao’s study, while partly considered in ours as specified in Eq. (9) to Eq. (14). Be-sides, Zhao’s result was obtained based on the national Input-output table, whereas this study is a provincial-level analysis using the provincial IO tables in which the re-5
gional technology variations are embodied. This difference indicates the importance to take into consideration the regional discrepancies in the virtual water trade assess-ment.
Despite the effort to incorporate regional discrepancies, some limitations remain. Due to data constraint, the assessment does not fully differentiate the regional discrep-10
ancy in water use efficiency. As shown in Eq. (7), the regional TWUC variation consists of regional technology variation reflected by Leontief inverse matrix [bi j] and regional water intensity variation reflected by DWUC ωj. In this study, the national average DWUCs for individual sectors are used for all the provinces due to the unavailability of provincial DWUC data. This substitution may cause overestimations of the virtual water 15
embodied in the products from the water use efficient provinces as well as underes-timations of the virtual water embodied in the products from the water use inefficient provinces. Therefore, the lacking information makes it difficult to exactly quantify the overall impact on the national virtual water trade figures.
This study is a first attempt to use the input-output model to investigate the virtual 20
water flows associated with China’s international trade of goods and services with re-gional specifications. The accounting process used here adopts some assumptions due to data constraint. Improvements would need a more reliable data base on the regional disparity of water use efficiency containing also information on return flows and waste water treatment.
25
HESSD
8, 3543–3570, 2011Analyses of impacts of China’s international trade
Z. Y. Zhang et al.
Title Page
Abstract Introduction
Conclusions References
Tables Figures
◭ ◮
◭ ◮
Back Close
Full Screen / Esc
Printer-friendly Version Interactive Discussion
Discussion
P
a
per
|
Dis
cussion
P
a
per
|
Discussion
P
a
per
|
Discussio
n
P
a
per
|
References
Allan, J. A.: “Virtual water”: a long term solution for water short Middle Eastern economies?, Occasional paper, Water Issues Group, Sch. of Orient. and Afr. Stud., King’s College, Lon-don, UK, 1997.
Allan, J. A.: Fortunately there are substitutes for water otherwise our hydro-political futures
5
would be impossible, ODA, Priorities for water resources allocation and management, ODA, London, 13–26, 1993.
Bouhia, H.: Water in the Macro Economy: Integrating Economics and Engineering into an Analytical Model, Ashgate Publishing Limited, Aldershot, UK, 2001.
Brown, S., Schreier, H., and Lavkulich, L. M.: Incorporating virtual water into water
manage-10
ment: a British Columbia example, Water. Resour. Manage., 23, 2681–2696, 2009.
Chapagain, A. K. and Hoekstra, A. Y.: The water footprint of coffee and tea consumption in the Netherlands, Ecol. Econ., 64, 109–118, 2007.
Chapagain, A. K. and Hoekstra, A. Y.: The global component of freshwater demand and supply: an assessment of virtual water flows between nations as a result of trade in agricultural and
15
industrial products, Water. Int., 33, 19–32, 2008.
Chapagain, A. K., Hoekstra, A. Y., Savenije, H. H. G., and Gautam, R.: The water footprint of cotton consumption: An assessment of the impact of worldwide consumption of cotton products on the water resources in the cotton producing countries, Ecol. Econ., 60, 186– 203, 2006.
20
China State Statistical Bureau: China Statistical Yearbook, China Statistics Press, Beijing, China, 2003 and 2009.
Dietzenbacher, E. and Velazquez, E.: Analysing Andalusian virtual water trade in an input-output framework, Reg. Stud., 41, 185–196, 2007.
Falkenmark, M. and Rockstr ¨om, J.: The new blue and green water paradigm: breaking new
25
ground for water resources planning and management, J. Water Resour. Plann. Manage., 132(3), 129–132, 2006.
Fraiture, C., Cai, X., Amarasinghe, U., Rosegrant, M., and Molden, D.: Does International Ce-real Trade Save Water? The Impact of Virtual Water Trade on Global Water Use, Compre-hensive Assessment Research Report 4, International Water Manage. Institute, Colombo,
30
2004.
HESSD
8, 3543–3570, 2011Analyses of impacts of China’s international trade
Z. Y. Zhang et al.
Title Page
Abstract Introduction
Conclusions References
Tables Figures
◭ ◮
◭ ◮
Back Close
Full Screen / Esc
Printer-friendly Version Interactive Discussion
Discussion
P
a
per
|
Dis
cussion
P
a
per
|
Discussion
P
a
per
|
Discussio
n
P
a
per
|
Econ., 61, 159–170, 2007.
Hoekstra, A. Y. and Chapagain, A. K.: Water footprints of nations: water use by people as a function of their consumption pattern, Water Resour. Manage., 21(1), 35–48, 2007. Hoekstra, A. Y. and Hung, P. Q.: Virtual water trade: a quantification of virtual water flows
between nations in relation to international crop trade, Value of Water Research Report
5
Series No. 11, UNESCO-IHE, Delft, The Netherlands, 2002.
Hoekstra, A. Y. and Hung, P. Q.: Globalization of water resources: international virtual water flows in relation to crop trade, Global. Environ. Chang., 15, 45–56, 2005.
Hoekstra, A. Y., Chapagain, A. K., Aldaya, M. M., and Mekonnen, M. M.: Water Footprint Manual State of the Art 2009, Water Footprint Network. Enschede, The Netherlands, 2009.
10
Hubacek, K. and Sun, L.: Economic and societal changes in China and their effects on water use: a scenario analysis, in: Consumption and the Environment, edited by: Hertwich, E., J. Ind. Ecol., 9, 1–2, 2005.
Kumar, M. D. and Singh, O. P.: Virtual water in global food and water policy making: Is there a need for rethinking?, Water Resour. Manage., 19, 759–789, 2005.
15
Lenzen, M.: Understanding virtual water flows: a multi-region input-output case study of Victo-ria, Water. Resour. Res., 45, W09416, doi:10.1029/2008WR007649, 2009.
Leontief, W.: The Structure of the American Economy, Oxford University Press, Oxford, 1941. Liu, J. G. and Savenije, H. H. G.: Time to break the silence around virtual-water imports, Nature,
453, 587, 2008.
20
Liu, J. G., Zehnder, A. J. B., and Yang, H.: Historical trends in China’s virtual water trade, Water. Int., 32, 78–90, 2007.
Oki, T. and Kanae, S.: Virtual water trade and world water resources, Water. Sci. Technol., 49, 203–209, 2004.
Renault, D.: Value of virtual water in food: Principles and virtues, in: Virtual Water Trade,
25
Proceedings of the International Expert Meeting on Virtual Water Trade, edited by: Hoek-stra, A. Y., UNESCOIHE Inst. for Water Educ., Delft, Netherlands, 77–91, 2003.
Renault, D.: Virtual water value in food supply management, Houille Blanche, 80–85, 2003. Velazquez, E.: Water trade in Andalusia. Virtual water: an alternative way to manage water
use, Ecol. Econ., 63, 201–208, 2007.
30
Wang, M., Webber, M., Finlayson, B., and Barnett, J.: Rural industries and water pollution in China, J. Environ. Manage., 86, 648–659, 2008.
HESSD
8, 3543–3570, 2011Analyses of impacts of China’s international trade
Z. Y. Zhang et al.
Title Page
Abstract Introduction
Conclusions References
Tables Figures
◭ ◮
◭ ◮
Back Close
Full Screen / Esc
Printer-friendly Version Interactive Discussion
Discussion
P
a
per
|
Dis
cussion
P
a
per
|
Discussion
P
a
per
|
Discussio
n
P
a
per
|
Resourc., 16, 516–520, 2001.
Yang, H., Reichert, P., Abbaspour, K. C., and Zehnder, A. J. B.: A water resources threshold and its implications for food security, Environ. Sci. Technol., 37, 3048–3054, 2003.
Yang, H., Wang, L., Abbaspour, K. C., and Zehnder, A. J. B.: Virtual water trade: an assessment of water use efficiency in the international food trade, Hydrol. Earth Syst. Sci., 10, 443–454,
5
doi:10.5194/hess-10-443-2006, 2006.
Yang, H. and Zehnder, A. J. B.: Water scarcity and food import: A case study for southern Mediterranean countries, World. Dev., 30, 1413–1430, 2002.
Yang, H. and Zehnder, A.: “Virtual water”: an unfolding concept in integrated water resources management, Water. Resour. Res., 43, W12301, doi:10.1029/2007WR006048, 2007.
10
Zhao, X., Chen, B., and Yang, Z. F.: National water footprint in an input-output framework – a case study of China 2002, Ecol. Model., 220, 245–253, 2009.
Zhao, X., Yang, H., Yang, Z. F., Chen, B., and Qin, Y.:, Applying the input-output method to account for water footprint and virtual water trade in the Haihe River Basin in China, Environ. Sci. Technol., 44(23), 9150–9156, 2010.
15
HESSD
8, 3543–3570, 2011Analyses of impacts of China’s international trade
Z. Y. Zhang et al.
Title Page
Abstract Introduction
Conclusions References
Tables Figures
◭ ◮
◭ ◮
Back Close
Full Screen / Esc
Printer-friendly Version Interactive Discussion
Discussion
P
a
per
|
Dis
cussion
P
a
per
|
Discussion
P
a
per
|
Discussio
n
P
a
per
|
Table 1.Detailed results of sectoral virtual water trade accounting.
Sectors DWUC TWUC Virtual Virtual Net virtual Water use
(average) water water water for final
export import export demand
ωj δj uj vj uj−vj tj m3/104Yuan m3/104Yuan 106m3year−1
106m3year−1
106m3year−1
106m3year−1
1 Agriculture 1307.3 1692.3 8039.5 11 322.8 −3283.4 148 993.8
2 Coal mining and 31.6 229.9 354.9 5.5 309.4 661.8
processing
3 Food and tobacco 32.1 758.0 6199.1 3790.5 2408.6 64 690.7
processing
4 Textile goods 30.4 563.4 13 824.2 1164.3 12 659.9 3747.1
5 Wearing 5.5 419.2 9575.1 1034.5 8540.5 11 202.8
6 Sawmills and furniture 2.7 452.9 3118.2 547.5 2570.7 4065.8
7 Paper and products 90.0 429.9 3849.0 882.6 2966.4 2631.5
8 Petroleum processing 24.8 308.2 1085.9 2718.9 −1633.0 477.6
9 Chemicals 47.5 353.4 7511.0 4557.9 2953.1 6527.7
10 Non-metal mineral 22.6 533.6 3084.8 830.2 2254.6 4051.0
products
11 Metal smelting and 40.7 614.3 9207.3 4610.9 4596.4 5279.2
products
12 Machinery and 4.7 220.6 2845.8 6614.6 −3768.7 18 321.4
equipment
13 Transport equipment 5.8 217.2 1584.5 1572.3 12.1 5179.5
14 Electric equipment, 3.1 207.3 14 051.7 5856.4 8195.3 11 436.5
telecommunication equipment
15 Other manufacturing 4.9 249.8 3362.9 2002.6 1360.3 2997.1
16 Electricity, gas and 814.1 1042.6 67.3 3956.3 −3889.0 15 216.4
water production and supply
17 Construction 4.5 227.6 192.7 144.1 48.5 61 042.1
18 Wholesale and retail 39.7 188.4 7074.9 379.9 6694.9 13 113.6
trade and passenger transport
19 Restaurant and hotel 170.1 639.6 2186.8 21.6 2165.2 16 703.4
20 Other services 23.2 168.3 3825.6 2359.8 1465.8 50 715.1
Total 101 041.1 54 413.3 46 627.8 447 054.2
HESSD
8, 3543–3570, 2011Analyses of impacts of China’s international trade
Z. Y. Zhang et al.
Title Page
Abstract Introduction
Conclusions References
Tables Figures
◭ ◮
◭ ◮
Back Close
Full Screen / Esc
Printer-friendly Version Interactive Discussion
Discussion
P
a
per
|
Dis
cussion
P
a
per
|
Discussion
P
a
per
|
Discussio
n
P
a
per
|
Table 2.Virtual water trade at the provincial level (106m3year−1).
Provinces Virtual water Virtual water Net virtual
export import water export
106m3year−1
106m3year−1
106m3year−1
1 Beijing 2104.1 1515.6 588.5
2 Tianjin 2384.0 1004.4 1379.6
3 Hebei 1788.9 1024.7 764.2
4 Shanxi 779.7 294.0 485.6
5 Inner Mongolia 637.5 344.4 293.1
6 Liaoning 6124.4 5546.5 577.9
7 Jilin 1272.7 626.4 646.3
8 Heilongjiang 1098.6 1003.4 95.2
9 Shanghai 7626.4 4933.0 2693.4
10 Jiangsu 13 189.7 7912.7 5277.0
11 Zhejiang 10 668.2 2157.8 8510.4
12 Anhui 1177.5 484.6 693.0
13 Fujian 6202.7 2359.9 3842.8
14 Jiangxi 579.3 585.2 −5.9
15 Shandong 10 674.3 6358.6 4315.7
16 Henan 1641.8 1037.6 604.1
17 Hubei 851.2 1266.8 −415.6
18 Hunan 751.2 495.5 255.7
19 Guangdong 26 146.5 12 489.5 13 657.0
20 Guangxi 598.5 387.4 211.2
21 Hainan 364.5 128.9 235.6
22 Chongqing 500.7 414.6 86.2
23 Sichuan 1072.4 458.9 613.5
24 Guizhou 298.3 244.0 54.3
25 Yunnan 696.3 430.9 265.3
26 Shaanxi 657.9 362.3 295.7
27 Gansu 301.7 211.1 90.6
28 Qinghai 57.0 19.0 38.0
29 Ningxia 131.1 66.3 64.8
30 Xinjiang 663.9 249.2 414.7
HESSD
8, 3543–3570, 2011Analyses of impacts of China’s international trade
Z. Y. Zhang et al.
Title Page
Abstract Introduction
Conclusions References
Tables Figures
◭ ◮
◭ ◮
Back Close
Full Screen / Esc
Printer-friendly Version Interactive Discussion
Discussion
P
a
per
|
Dis
cussion
P
a
per
|
Discussion
P
a
per
|
Discussio
n
P
a
per
|
Table 3.Net virtual water export and water resources in different regions.
Regions Provinces WR/cap WR NVWE NVWE/WR
m3/person 106m3year−1 106m3year−1 (%)
The HHH Beijing, Tianjin, Hebei, 331.4 103 251.4 8137.8 7.9%
region Shanxi, Shandong, Henan
Northeast Liaoning, Jilin, Heilongjiang 1195.7 128 114.4 1319.3 1.0%
The Yangzi Shanghai, Jiangsu, Zhejiang, 1022.7 204 453.0 17 173.8 8.4%
river basin Anhui, Jiangxi, Hubei, Hunan
South Fujian, Guangdong, Hainan 2543.5 736 770.5 17 569.6 2.4%
Southwest Guangxi, Chongqing, 3157.6 782 195.3 1230.5 0.2%
Sichuan, Guizhou, Yunnan
Northwest Inner Mongolia, Shaanxi, 2197.9 256 101.2 1196.8 0.5%
Gansu, Qinghai, Ningxia, Xinjiang
HESSD
8, 3543–3570, 2011Analyses of impacts of China’s international trade
Z. Y. Zhang et al.
Title Page
Abstract Introduction
Conclusions References
Tables Figures
◭ ◮
◭ ◮
Back Close
Full Screen / Esc
Printer-friendly Version Interactive Discussion
Discussion
P
a
per
|
Dis
cussion
P
a
per
|
Discussion
P
a
per
|
Discussio
n
P
a
per
|
11.Metal
smelting and
products 10%
18.Wholesale
and retail trade
and passenger
transport 14%
14.Electric
equipment,
telecommunica
tion equipment
18%
5.Wearing 18%
4.Textile goods
27%
Other sectors
13%
HESSD
8, 3543–3570, 2011Analyses of impacts of China’s international trade
Z. Y. Zhang et al.
Title Page
Abstract Introduction
Conclusions References
Tables Figures
◭ ◮
◭ ◮
Back Close
Full Screen / Esc
Printer-friendly Version Interactive Discussion
Discussion
P
a
per
|
Dis
cussion
P
a
per
|
Discussion
P
a
per
|
Discussio
n
P
a
per
|
-400 -300 -200 -100 0 100 200 300 400
1 2 3 4 5 6 7 8 9 10 11 12 13 14 15 16 17 18 19 20
Sectors
(%)
HESSD
8, 3543–3570, 2011Analyses of impacts of China’s international trade
Z. Y. Zhang et al.
Title Page Abstract Introduction Conclusions References Tables Figures ◭ ◮ ◭ ◮ Back Close
Full Screen / Esc
Printer-friendly Version Interactive Discussion Discussion P a per | Dis cussion P a per | Discussion P a per | Discussio n P a per | -5 0 5 10 15 20 25 30 35 40 Be ijin g Tia n ji n He b ei Sha nxi Inne r M o ngo li a Li a o n in g Jilin Heilon g jian g S h a n gh ai J ian gs u Zh ej ian g Anhui Fu ji a n J ian gx i Sha ndo ng He na n H ube i Hun a n G u a n gd on g Gua n gx i Ha in a n C h on gq in g Si ch uan Guiz h o u Yu nnan Sh aa nxi Ga n su Qi n g h a i N in gxia Xi nj ia ng (%)
HESSD
8, 3543–3570, 2011Analyses of impacts of China’s international trade
Z. Y. Zhang et al.
Title Page Abstract Introduction Conclusions References Tables Figures ◭ ◮ ◭ ◮ Back Close
Full Screen / Esc
Printer-friendly Version Interactive Discussion Discussion P a per | Dis cussion P a per | Discussion P a per | Discussio n P a per | Tianjin Beijing Other sectors 19% Other sectors (Net import) -32% 14.Electric equipment, telecommuni cation equipment 37% 19.Restaurant and hotel 36% Food and tobacco processing 12% 5.Wearing 8% 11.Metal smelting and products 11% 18.Wholesale and retail trade and passenger transport 35% Wearing 15% 4.Textile goods 15% 8.Petroleum processing 11% 1.Agriculture 34% Shandong Hebei Other sectors (Net import) -19% 4.Textile goods 42% 5.Wearing 20% 11.Metal smelting and products 20% 3.Food and tobacco processing 19% 9.Chemicals 18% Other sectors
(Net import) -6% 10.Non-metal mineral products
8% 4.T extile goods 45%
5.Wearing 17%
11.Metal smelting and products 17%
3.Food and tobacco processing 19%
HESSD
8, 3543–3570, 2011Analyses of impacts of China’s international trade
Z. Y. Zhang et al.
Title Page
Abstract Introduction
Conclusions References
Tables Figures
◭ ◮
◭ ◮
Back Close
Full Screen / Esc
Printer-friendly Version Interactive Discussion
Discussion
P
a
per
|
Dis
cussion
P
a
per
|
Discussion
P
a
per
|
Discussio
n
P
a
per
|