E
NERGY AND
E
NVIRONMENT
Volume 3, Issue 4, 2012 pp.541-552
Journal homepage: www.IJEE.IEEFoundation.org
Life cycle assessment (LCA) of an energy recovery plant in
the olive oil industries
Francesca Intini
1, Silvana Kühtz
1, Gianluca Rospi
21
Dep. Engineering and Environmental Physics, Faculty of Engineering, University of Basilicata, Italy.
2
Dep. Engineering and Environmental Physics, Faculty of Architecture, University of Basilicata, Italy.
Abstract
To reduce the GHG emissions in the UE and to increase the produced energy it is important to spread out decentralized technologies for renewable energy production. In this paper a power plant fed with biomass is studied, in particular the biomass considered is the waste of the olive oil industries. This study focuses on the possibility of using the de-oiled pomace and waste wood as fuel. A life cycle assessment (LCA) of a biomass power plant located in the South of Italy was performed. The global warming potential has been calculated and compared with that of a plant for energy production that uses refuse derived fuel (RDF) and that of one that uses coal. The LCA shows the important environmental advantages of biomass utilization in terms of greenhouse gas emissions reduction. An improved impact assessment methodology may better underline the advantages due to the biomass utilization.
Copyright © 2012 International Energy and Environment Foundation - All rights reserved.
Keywords: LCA; De-oiled pomace; GWP.
1. Introduction
Renewable energy sources are an obvious choice for countries with advanced economies as well as emerging countries. Biomass is one of the cheapest forms of renewable energy. Olive trees represent a characteristic element in the Italian countryside landscape as they are cultivated in 18 regions out of 20 [1]. The contribution of olive trees to the economy of entire regions, particularly in the south of Italy, is of extreme importance in terms of employment as well as soil and environmental protection. Italy is the second largest world olive oil producer after Spain and it is the highest consumer country. Since consumption is higher than production, Italy is also the country which imports the most olive oil.
On average, olive production represents around 4.2% of the value of national agriculture (production at base prices 2000/2001). This percentage rises to 10% in Sicily, 25 % in Calabria and 35% in Puglia, the most productive regions. All together, they reach almost 70%. Overall, the olive sector makes up around 1% of the total value of agricultural production in the north and the centre of the country.
Pomace is commonly used for extracting crude olive-pomace oil for producing fodder, for thermal energy recovery or as a fertilizer. With the extracting phase the de-oiled pomace is produced and burned in the furnaces.
This study aims to analyse the environmental advantage (in terms of GWP, Global Warming Potential) deriving from the use of de-oiled pomace (60%) and waste wood (40%) in an energy plant based on site-specific data and information, and to compare its environmental impact with that generated by the recovery of RDF and of coal combustion.
In the literature there are several studies on the de-oiled pomace.
In particular, [4] and [5] analyzed the use of the olive oil industry waste as fuel to obtain thermal or electric energy through combustion.
Russo et al. [6], showed that the recovery of olive pit and solid wastes offers environmental advantages with respect to other alternative fuels, in particular with wood pellets.
The interest in understanding comprehensively the environmental costs and benefits of biomass use is increasing and for this reason several studies based on the life cycle assessment (LCA) approach have been published. But to our knowledge no-one of them gives results for olive waste to energy recovery comparing the plants we have compared. Therefore with the present study we intend to evaluate environmental consequences of the energy production from de-oiled pomace in each stage of life cycle, utilizing the LCA methodology.
2. Biomass energy and GHG
Biomass means the biodegradable fraction of products, waste and residues from biological origin from agriculture (including vegetal and animal substances), forestry and related industries including fisheries and aquaculture, as well as the biodegradable fraction of industrial and municipal waste [7]. A wide range of biomass sources can be used to produce bioenergy in a variety of forms. For example, food, fibre, and wood process waste from industrial sectors, agricultural waste and forest waste can be utilized to generate electricity and heat.
EU–27 installed capacity for electricity generation from renewable sources increased by 54 % from 1997 to 2007 [8]. This increase was mainly due to wind capacity, which recorded a twelvefold increase over this period. Wood capacity and the capacity of other renewable sources – geothermal, photovoltaic, municipal solid waste and biogas – exhibited an almost threefold and a fivefold increase respectively. In 2007, 58 % of the total EU-27 renewable capacity was concentrated in four countries (Germany, Spain, France and Italy).
In Italy, the national overall target for the share of energy from renewable sources in gross final consumption of energy in 2020 is 17% [7].
Biomass is usually fed into the system as chips, pellets or briquettes [9]. Biomass can also be burned with coal in a boiler of a conventional power plant to yield steam and electricity. Co-firing biomass with coal is currently the most cost-efficient way of incorporating renewable technologies into conventional power production because much of the existing power plant infrastructure can be used without significant modifications.
Biomass for bioenergy purposes can be obtained in two ways: from residues and from dedicated energy crops. In this context, the concept of multifunctionality in agriculture, which introduces other roles for the primary sector than those strictly related to food production, allows farmers to enter a new market, agro-energy market, through the creation of chains designed to meet energy demand (see Figure 1).
The source of biomass has a big impact on GHG balance outcomes. Biomass residues are not produced specifically for use as an energy resource. They are the result of economic activity and production of goods in almost all economic sectors, so their utilization as energy sources does not usually increase environmental pressures.
3. LCA methodology
The potential environmental benefits, in terms of GHG savings that can be obtained from replacing fossil fuels with biomass sources, are one of the main driving forces for the promotion of bioenergy. Life Cycle Assessment (LCA) is considered to be the appropriate method for evaluating the GHG performance of bio-energy compared to that of fossil alternatives. The GHG balance of bio-energy systems differs depending on the type of feedstock, carbon stock changes due to land use change, transport, processing of the feedstocks and conversion technologies to produce heat or electricity.
In this study, the methodology used is the LCA technique, based on ISO 14040 [10] and ISO 14044 [11]. This assessment methodology is based on the identification of energy and materials used and emissions released to the environment. The core of the concept is the assessment of the impacts at each stage of the product life cycle [12].
An LCA study consists of four phases:
1. goal and scope definition: define and describe the object of the analysis, establish the context in which the assessment is developed, discuss assumptions and data quality, identify system boundaries and environmental effects. The object of study is described in terms of a so-called functional unit;
2. inventory analysis: data collection and modelling must be related to the functional unit defined in the goal and scope definition;
3. impact assessment: assessment of the potential impacts associated with the identified forms of resource use and environmental emissions;
4. interpretation: interpretation of the results from the previous phases of the study in relation to the objectives of the study.
The general framework of a Life Cycle Impact (LCI) Assessment method is composed of mandatory elements (classification and characterisation) that convert LCI results into an indicator for each impact category, and optional elements (normalization and weighting) that lead to a unique indicator across impact categories using numerical factors based on value-choices [13].
In most LCA studies, assumptions are made and the system boundaries are modified in order to leave some elements out. Results of the LCA are often used for process optimisation. The applicability depends greatly on the model of the process that has been adopted at the beginning of the study, which is frequently too simplified.
3.1 LCA application to the specific case
The goal of this LCA study is to compare the Global Warming Potential over 100 years (both direct and indirect impacts) of the energy plant fuelled by vegetal biomass with the energy plant fuelled by RDF or coal. The considered energy plant is a thermal power plant that produces only electricity sold directly to the national transmission system using as fuel biomasses, de-oiled pomace and wood waste. The existing plant, located in Italy, produces a gross electrical power equal to 12 MWe and the exhaust gases are utilized for the production of the steam in the closed cycle.
According to the standard ISO 14044, the functional unit is defined as the reference unit through which the system performance is quantified in an LCA. In this LCA study, the chosen functional unit is 1 kWh because the biomass is produced in the same site where the energy plant works.
Several industrial LCA studies have shown that the environmental load from the production of capital goods is insignificant when compared to their operation stage [14, 15].
The data collection has been performed on site, analyzed and completed with the direct involvement of the managers responsible of the different plant’s departments.
The method utilized to evaluate the environmental performance is global warming potentials (GWPs).
GWPs for greenhouse gases are expressed as CO2-equivalents and are developed by the IPCC
(Intergovernmental Panel on Climate Change) for time horizons of 100 years [16]. Carbon dioxide equivalency is a quantity that describes, for a given mixture and amount of greenhouse gas, the amount of CO2 that would have the same global warming potential (GWP), when measured over a specified
The system boundaries take into account the phases of treatment and processing of fuel burned into the energy plant (see Figure 2).
Figure 2. Scheme of the energy plant under analysis
The system boundary is defined knowing that the input of recycled materials to a product system is included in the data set without adding the data on environmental impacts caused in earlier life cycles. In the waste case the environmental impact connected to the treatment of wastes rests with the generator of the waste whereas the environmental impact connected to the processing of the waste into a resource for a subsequent user rests with the user of the resulting resource. The delineation between two product systems is considered to be the point where the waste has its “lowest market value”. This means that the generator of the waste has to carry the full environmental impact until the point in the product´s life cycle where the waste is transported to a scrap yard or gate of a waste processing plant (collection site). This approach is called the “Polluter-Pays (PP) allocation method” [17] and this is what we used in this work. The inputs are allocated on the various production steps according to defined procedures. Where possible, the allocation is avoided or at least follows a procedure based on the mass criteria. Allocation should reflect the physical relationship between the environmental burdens imposed, and the functions delivered by the system.
SimaPro 7.2.3 was used as a supporting tool in order to implement the LCA model and carry out the assessment [18]. The analysis uses the database Ecoinvent 2.2 [19].
The virgin pomace, waste of the olive oil mill production, undergoes drying and extracting pretreatment, is then transformed in the de-oiled pomace and qualifies as a renewable fuel in the Italian normative Decree 152/06. The virgin pomace is produced in the plant near the site of energy plant, so that the impact of the transport is zero.
With the extraction process of virgin pomace, the products are:
• olive-pomace oil obtained from olive pomace previously dried by extraction with solvent;
• exhausted pomace, which consists of dry pomace, residue of the extraction process of olive-pomace oil.
4. From residues to energy
4.1 The pomace drying
The pomace -drying process reduces the humidity rate to about 10% by applying a hot air current. The objective of the drying is to block the fermentation processes that happened in the virgin pomace and further allow the extraction of pomace oil. In Table 1 the inventory per 1 kg of the dry pomace is illustrated.
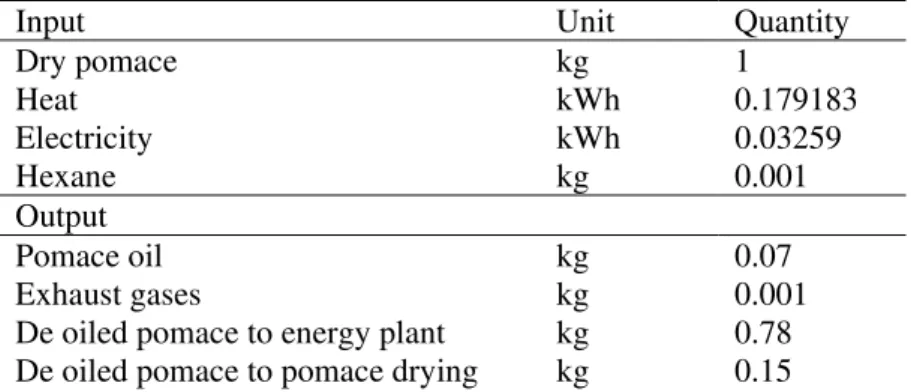
4.2 The oil extraction process
Table 1. Input-output table of the drying process per 1 kg of the dry pomace
Input Unit Quantity
Virgin pomace kg 2
Fuel kg 0.15
Electricity kWh 0.0325896
Output
Steam kg 1
Exhaust gases kg 0.144
Ash kg 0.006
Dry pomace kg 1
Table 2. Input-output table of the oil extraction process per 1 kg of the finished product
Input Unit Quantity
Dry pomace kg 1
Heat kWh 0.179183
Electricity kWh 0.03259
Hexane kg 0.001
Output
Pomace oil kg 0.07
Exhaust gases kg 0.001
De oiled pomace to energy plant kg 0.78
De oiled pomace to pomace drying kg 0.15
The environmental impact of the distillation phase has been added to the environmental impact of the pomace oil production. The distillation phase generates 72.8 g CO2 per kg of pomace oil.
4.3 The energy plant
The biomass energy recovery plant includes some non-hazardous waste. In particular energy recovery (heat or electricity) from residues of oil production represents a step towards to the environmental objectives of reducing wastes of the agriculture sector. The exhausted pomace is characterized by a low calorific value of 4000 kcal/kg and by a low content of nitrogen and sulphur. The advantages of products with high energy content are: the reduction of mass and volume of solid waste, the reduction of pollutants and the potential recovery of energy that can be sold.
The process of recovering wood waste is taken from the Ecoinvent Database. In this case the impact of the procurement has been measured. In one year the number of travels is equal to 1335 with an average distance equal to 100 km. In Table 3 the inventory of 1 MWh of produced electricity is illustrated.
Table 3. The input/output of the biomass energy recovery plant of 1 MWh of produced electricity is illustrated
Input Unit Quantity
De oiled pomace t 0.540975
Waste wood t 0.342315
air Sm3 4224
urea t 0.001
water m3 0.1
transport km 1.35
Output
Electricity MWh 1
exhaust gases t 0.796465
water m3 0.097561
ash t 0.088329
4.4 RDF production and combustion
The RDF production consists of a sorting process, which produces RDF bales and ferrous materials, and a biological treatment process which produces a stabilized organic fraction (SOF) [20]. Mixed waste, delivered by garbage trucks, is dumped on the tipping floor of the storage building where any unwanted items can be removed. A flail mill provides for the bag opening and for a size reduction of the input material. The oversize fraction is then sent to a magnetic separation, and finally, to a manual screening. A secondary screening is performed on the undersize fraction and allows the separation of a fraction larger than 60mm and a finer fraction which is sent for biological treatment. The production of 1kg of RDF is obtained with an overall efficiency of 40% and an electric energy consumption of 0.083 MJ (Table 4).
Table 4. Inventory of the production of 1 kg of RDF
Input Unit Quantity
Waste kg 1 kg
Water kg 0.088 kg
Metals g 0.3
PE g 0.16 g
Diesel MJ 0.01 MJ
Electricity MJ 0.083 MJ
Output
CO2 g 200 g
Waste kg 0.05 kg
RDF kg 0.4 kg
SOF Kg 0.37
Metals kg 0.05
The stage of RDF combustion is composed of three sections: combustion, energy recovery and gas treatment. For each section several technologies and design layout are possible. The plant under analysis has three parallel lines, each with a capability of 27t/h and characterized by a mobile grate, consisting of a series of alternate fixed and mobile bars where the fuel undergoes the primary stages of combustion. Table 5 shows the inventory of direct environmental burdens related to the combustion of one kg of RDF.
Table 5. Inventory of the combustion of 1 kg of RDF
Input Unit Quantity
RDF kg 1
Air kg 10.6
Water kg 0.158
CaO kg 0.025
Sodium silicate kg 0.0015
Urea kg 0.003
Heat by methane MJ 0.036
Output
Electricity MJ 4.09
CO2 g 1515
H2O g 679
Oxygen g 839
N2 g 8249
NOx mg 3335
SO2 mg 333
HCl mg 167
Dust mg 83
TOC mg 4
CO mg 167
5. Impact assessment
The phase of life cycle impact assessment aims to quantify the relative importance of all environmental burdens contained in an LCI and at aggregating them to a single indicator, GWP100.
On the types and quantities of gases emitted into the atmosphere, expressed in terms of emissions of greenhouse gases, it is possible to determine the environmental effects of the different production phases of the considered case by using conversion factors expressed in. For the production of 1 kWh in the plant under analysis 0.0597 kgCO2eq/kWh are given out and for the production of 1 kWh by combustion of
RDF 1.61 kgCO2eq/kWh. The process impact distributions are showed in Figures 3 and 4.
Figure 3. The process impact distribution for 1kWh of electricity by energy plant (60% de-oiled pomace and 40% waste wood)
Figure 4. The process impact distribution for 1kWh of electricity by RDF
The first observation by the analysis of the plant under consideration is that the heat for the pomace oil extraction does not generate an environmental impact because the heat is produced by the recovery of the hot exhaust gases in the energy plant. Therefore there is a saving equal to 0.05 kgCO2eq per 1 kg of
de-oiled pomace produced.
6. Interpretation of the results
In the assessment of the GHG savings of the bioenergy system, the definition of the fossil reference system is very important. For instance, fossil-derived electricity can be assumed to be produced from oil, natural gas, coal or other sources, all of which have different GHG emission factors. In order to compare the bioenergy system with the best available fossil technologies, the coal thermo plant is compared with the energy plant under analysis and the RDF recovery plant.
Knowing the production of electricity per kilogram of fuel, it is possible to determine the emissions of CO2eq per 1 kWh of energy produced.
The CO2eq emissions per kg of coal are assumed to be equal to 2.624 kgCO2eq [21]. A lower calorific
value of coal equal to 6728 kcal / kg and a value of electrical efficiency in a solid fuel power plant equal to 2574 kcal/kg are considered [22]. The coal extraction phase emissions by underground mines are estimated in the Italian area equal to 0.05995 kgCO2eq/kWh.
If we compare the plant under analysis with the coal energy plant there is a net saving equal to 0.9497 kg CO2eq for each produced kWh (see Table 6).
Table 6. kgCO2eq saved from the energy plant (60% de-oiled pomace and 40% waste wood)
Fuel kg/kWh kgCO2eq per kg of fuel kgCO2eq/kWh
Mix actual plant 0.885 0.0612 0.0542
coal + extraction coal 0.382 2.624 1.0039
If we compare the case c with the coal energy plant there is a net saving equal to 0.163 kg CO2eq for
each produced kWh (see Table 7).
Table 7. kgCO2eq per each produced kWh
Fuel kg/kWh kgCO2eq per kg of fuel kgCO2eq/kWh
case c 0.87 0.96 0.8439
coal + extraction coal 0.382 2.624 1.003
If other alternatives are considered, for instance the sending to disposal, the valorisation of the RDF contributes to avoid 290g of CO2eq per 1 kg of RSU to disposal. Knowing that 1 kg of RDF is produced
by 2.5 kg of urban waste, the GHG saved is 725 gCO2eq per 1kg of RDF. Summarising the quantity of
the saving by avoided disposal and avoided coal energy, a net saving equal to 0.5225 kg CO2eq for each
produced kWh is achieved.
At last, the co-product of the extraction phase, the pomace oil, is utilized as palm oil. If we evaluate the avoided emissions from the production of the palm oil, the GHG reduction increases by 0.0587 kg CO2eq
for each produced kWh. The total reduction is 0.584 kg CO2eq/kWh.
6.1 Dedicated energy crops vs renewable energy from waste biomass
One of the major justifications for bioenergy systems is their low greenhouse gas emissions compared to fossil energy ones. The biomass to energy conversion is accomplished throught three principal routes:
• Thermochemical (combustion, gasification and pyrolysis);
• Biochemical (anerobic digestion and fermentation);
• Physiochemical (mechanical and chemical extractions).
The ideal crops for biofuel production are only suitable for cultivation in the hotter climate of tropical regions, such as bioethanol from sugar cane [23] and biodiesel from palm oil [24]. In colder climates where these optimal crops are unable to grow, more appropriate alternatives such as rapeseed [25] may be considered.
are fed to pigs. Using residues for non-feed purposes therefore requires adaptations in the food system to compensate for protein losses, i.e. growing beans or supplementary livestock feed crops. Land requirements for such adaptations are substantial and are larger than the area needed for energy crops that produce equivalent amounts of energy, leading to a net increase of the land requirements. From a land use perspective, therefore, using residues of the food system for livestock feed and generating bio-energy from dedicated energy crops is the most preferable option.
The results for apparently similar bioenergy systems may differ for several reasons: type and management of raw materials, conversion technologies, end-use technologies, system boundaries and reference energy system with which the bioenergy chain is compared [27].
The production of feedstock for bioenergy requires land that was previously used, and would otherwise be used, for a different purpose. Therefore, both direct and indirect land use change must be considered on the GHG balance.
For example, in the direct land use, the total soil carbon stock changes from tropical moist rain forest to palm oil is equal to -4 t C/ha. Indirect land use change (iLUC) occurs when land currently used for feed or food crops is charged into bioenergy feedstock production and the demand for the previous land use remains. The feedstock quantities for bioenergy can be obtained by biomass use substitution, by shortening the rotation length and by crop area expansion.
An example of one approach for calculating the indirect land use change and its influence on final results considers that use of arable land for additional biomass feedstock production will induce indirect land use change risks due to displacement, but that the risk is small and can be ignored for feedstock produced from wastes and on degraded land and also on set-aside and idle land, as well as biomass feedstock derived by increasing yields. Therefore in the case of de-oiled pomace and waste wood the effect of land use change can be ignored.
Finally, to complete the analysis, some case of life cycle GHG emissions of biofuels [28], where the iLUC factor is included, are reported:
• Rapeseed to fatty acid methyl ester, EU, equal to 188 gCO2eq/MJ, medium value.
• Palm oil to fatty acid methyl ester, Indonesia, equal to 64 gCO2eq/MJ, medium value.
• Sugarcane to ethanol, Brazil, equal to 42 gCO2eq/MJ, medium value.
• Wheat to ethanol, EU, equal to 110 gCO2eq/MJ, medium value.
• Short rotation crop to biomass to liquid, EU, equal to 75 gCO2eq/MJ, medium value.
For a high level of the iLUC factor, only ethanol from sugarcane and second-generation Biomass to Liquid (BtL) technologies would still provide a GHG reduction.
GHG emissions of biofuels are significantly higher than the de-oiled pomace, equal to 5.7 gCO2eq/MJ.
The evaluation of environmental effects shows that the exploitation of agricultural residues seems to be preferable to energy crops, due to the energy consumption for ground preparation, plant establishment and cultivation and to the impacts of pesticides and herbicides production and spreading associated with energy crops.
One of the problems that has to be considered as well, though it is beyond the scope of this paper, is the fact that the demand for grain and corn as a source of biofuels has been a significant element of recent food price rises [29]. The US already spends $7 billion a year supporting ethanol [30]. This consumes 20 per cent of America’s corn crop [31] – a figure likely to rise to 32 per cent by 2016. Looking ahead, the EU has a target for 10 per cent of its transport fuel to come from biofuels by 2020, while the US has proposed a target of 36 billion gallons of renewable fuel by 2022 [32]. Rising food prices will hit poor countries and poor people hardest, and will present an obvious impediment to achieving the Millennium Development Goal of halving hunger by 2015. The FAO has already announced that 36 countries are in crisis in terms of food security, and will need external assistance of these, 21 are in Africa (although not all of them have been affected equally) [33].
7. Conclusion
LCA methodology was applied to compare the environmental performance of the recovery of olive oil sector residuals and wood waste with that of RDF or fossil resources. The results showed that the recovery of de-oiled pomace and waste wood offers environmental advantages with respect to other alternative fuels.
The problems of the pomace used in the energy plant are that it is only available for a few months of the year, that this period coincides with the period of olive-oil production, and there are different quantities each year due to different harvests of the trees. The best advantages are the limited costs of pomace as a raw material and the availability of a mature technology for biomass exploitation [34].
References
[1] E-TOON, Electronical Technical Transfer olive oil Network, 2004. Italian Sector Overview. http://www.e-toon.net/en/doc/Italian%20Sector%20Overview.pdf
[2] Avraamides, M. and Fatta, D., 2008. Resource consumption and emissions from olive oil
production: a life cycle inventory case study in Cyprus. J Clean Prod; 16 (7):809-821.
[3] Allegra, C., 2005. Audit energetico-ambientale della filiera olivicola: applicazione in campo ad un frantoio. Graduation Thesis. Private Communication.
[4] Masghouni, M. and Hassairi, M., 2000. Energy applications of olive-oil industry by-products: I. The exhaust foot cake. Biomass Bioenerg; 18: 257-262.
[5] Caputo, C., Scacchia, F. and Pelagagge P.M., 2003. Disposal of by-products in olive oil industry: waste-to-energy solutions. Appl Therm Eng; 23: 197–214.
[6] Russo, Cappelletti, Nicoletti, 2008. LCA of energy recovery of the solid waste of the olive oil Industries: 6th International Conference on LCA in the Agri-Food Sector, Zurich, November 12– 14.
[7] European Parliament, 2009. Directive 2009/28/EC of the European Parliament and of the Council of 23 April 2009 on the promotion of the use of energy from renewable sources and amending and subsequently repealing Directives 2001/77/EC and 2003/30/EC.
[8] European Commission, 2009. Energy, transport and environment indicators. Pocketbooks, ISSN 1725-4566.
[9] Cherubini, F., 2010. GHG balances of bioenergy systems – Overview of key steps in the
production chain and methodological concerns. Renew Energ; 35: 1565–1573.
[10] ISO Standards, 2006. ISO 14040: Environmental management – Life cycle assessment –
Principles and framework.
[11] ISO Standards, 2006. ISO 14044: Environmental management – Life cycle assessment –
Requirements and guidelines.
[12] De Benedetto, L. and Klemeš, J., 2009. The Environmental Performance Strategy Map: an
integrated LCA approach to support the strategic decision-making process. J Clean Prod; 17(10):900-906.
[13] Guinée, J., Heijungs, R. and Van der Voet, E., 2009. A greenhouse gas indicator for bioenergy: some theoretical issues with practical implications. Int J Life Cycle Ass;14(4): 328-339.
[14] Environment Agency, 2005. Life cycle assessment of disposable and reusable nappies in the UK. Bristol. UK report.
[15] Biermann, S., Rathke G.W., Hu¨lsbergen, K.J., Diepenbrock, W.,1999. Energy recovery by crops in dependence on the input of mineral fertilizer. Final report. Halle, Germany.
[16] IPCC, 2007. The Fourth Assessment Report (AR4) of the United Nations Intergovernmental Panel on Climate Change.
[17] IEC, The International EPD Cooperation, 2008. Supporting Annexes for Environmental product declarations, EPD, version 1.0 dated 2008-02-29.
[18] PRè Consultants, SimaPro 7.2.3, 2010. Database manual – methods library. http://www.pre.nl/ [19] Ecoinvent, 2010. The Swiss Centre for Life Cycle Inventories. Ecoinvent V2.2.
[20] Arena, U., Mastellone, M.L. and Perugini F., 2003. The environmental performance of alternative solid waste management options: a life cycle assessment study. Chemical Engineering Journal 96:207–222.
[21] Nomisma Energia, 2008. Politiche energetiche e ambientali: le potenzialità del Combustibile da Rifiuti di Qualità Elevata, CDR-Q.
[22] APAT, 2007. Produzione di energia elettrica ed emissioni di gas serra; strategie di mitigazione delle emissioni.
[23] Luo, L., Voet, E. and Huppes, G., 2009. Life cycle assessment and life cycle costing of bioethanol from sugarcane in Brazil. Renew Sust Energ Rev;13 (6-7): 1613-1619.
[25] Gartner, S., and Reinhardt, G., 2003. Life Cycle Assessment of Biodiesel: Update and New Aspects. Heidelberg.
[26] Nonhebel, S., 2007. Energy from agricultural residues and consequences for land requirements for food production. Agr Syst; 94(2):586-592.
[27] Cherubini, F., Bird, N., Cowie, A., Jungmeier, G., Schlamadinger, B. and Woess-Gallasch, S., 2009. Energy- and greenhouse gas-based LCA of biofuel and bioenergy systems: Key issues, ranges and recommendations. Resour Conserv Recy; 53(8):434-447.
[28] Fritsche, UR, 2008. The “iLUC Factor” as a Means to Hedge Risks of GHG Emissions from Indirect Land-Use Change Associated with Bioenergy Feedstock Provision. Working paper prepared for BMU, Darmstadt (forthcoming), Oeko-Institute.
[29] Borger, J., 2008. Feed the world? We are fighting a losing battle, UN admits. The Guardian, 26 February.
[30] IISD, International Institute for Sustainable Development 2007.
www.iisd.org/pdf/2007/media_grain_journal.pdf. and Institute for Energy and Environmental Research. http://www.ufop.de/downloads/Life_Cycle_IFEU.pdf
[31] Reuters, 2006. Ethanol, biodiesel eats into US corn stockpiles. 15 May 2006, at
http://tinyurl.com/27cuk8.
[32] Evans, A., 2008. Rising Food Prices - Drivers and Implications for Development. Chatham House Food Supply Project, April CH BP 08/02.
[33] World Bank, 2008. High Food Prices; FAO, Crop Prospects and World Food Situation, February report.
[34] MORE project, 2008. Work Package 3: Analysis of Local Situations + SWOT analyses+ Possible Trends.
Francesca Intini, Graduated in Management Engineering at Politecnico di Bari (Italy), specialized in
the environmental management of production systems. She has a PhD in Industrial and Innovation Engineering at Università della Basilicata. Research topics include the assessment of the environmental, social and economic life cycle of products and services, the Carbon Footprint management and sustainability reporting to the corporate, application of techniques of operational research to solving optimal problems.
E-mail address: francesca.intini@unibas.it
Silvana Kühtz, Graduated in engineering at Politecnico di Bari (Italy). Since 1992 she attended the
Imperial College of Science, Technology and Medicine, University of London (UK), to conduct an experimental research leading to a Ph.D. degree and Diploma of the Imperial College in Hydrodynamics in 1996. She was appointed assistant professor at Università della Basilicata, faculty of Engineering, Department of Environmental Physics and Engineering, Potenza (Italy), where she gave lectures in Turbomachinery, Applied Energetics, Regional Economic Policy, Economics and Management of Energy sources, Renewable Energy Sources and Energy use of water and leads the course Language Future and Possibility. She is PhD tutor since 2007. Research topics include energy resource management; Energy-Economy-Environment interactions; Input-Output Techniques and LCA; environmental certifications; greening behaviours and marketing; carbon footprint; barriers to innovative behaviours. She has published books and papers on International Journals and is invited to contribute to conferences on these topics.
Gianluca Rospi, born in Matera on December 23 1978, graduate in Civil Engineering at the Polytechnic University of Marche in 2005, Ph.D in Environmental Techical Physics from 2010. He produced around 15 among scientific and didactic papers and he worked in the sector of renewable energy and energy performance of buildings. The themes of papers are: building comfort indoor, energetic performances of buildings and of its components, energetic analysis of the vernacular architecture in Mediterranean area; bioclimatic technologies and materials; diffusion of pollutants in the atmosphere.