Depressive Symptoms are the Main Predictor
for Subjective Sleep Quality in Patients with
Mild Cognitive Impairment
—
A Controlled
Study
Stefan Seidel1, Peter Dal-Bianco1, Eleonore Pablik2, Nina Müller3, Claudia Schadenhofer3, Claus Lamm3, Gerhard Klösch1, Doris Moser1, Stefanie Klug1, Gisela Pusswald1,
Eduard Auff1, Johann Lehrner1*
1Department of Neurology, Medical University of Vienna, Vienna, Austria,2Department of Medical Statistics, Medical University of Vienna, Vienna, Austria,3Faculty of Psychology, University of Vienna, Vienna, Austria
Abstract
Objective
Controlled data on predictors of subjective sleep quality in patients with memory complaints are sparse. To improve the amount of comprehensive data on this topic, we assessed fac-tors associated with subjective sleep quality in patients from our memory clinic and healthy individuals.
Methods
Between February 2012 and August 2014 patients with mild cognitive impairment (MCI) and subjective cognitive decline (SCD) from our memory clinic and healthy controls were recruited. Apart from a detailed neuropsychological assessment, the subjective sleep qual-ity, daytime sleepiness and depressive symptoms were assessed using the Pittsburgh Sleep Quality Index (PSQI), the Epworth Sleepiness Scale (ESS) and the Beck Depression Inventory (BDI-II).
Results
One hundred fifty eight consecutive patients (132 (84%) MCI patients and 26 (16%) SCD patients) and 75 healthy controls were included in the study. Pairwise comparison of PSQI scores showed that non-amnestic MCI (naMCI) patients (5.4±3.5) had significantly higher PSQI scores than controls (4.3±2.8, p = .003) Pairwise comparison of PSQI subscores showed that naMCI patients (1.1±0.4) had significantly more“sleep disturbances”than controls (0.9±0.5, p = .003). Amnestic MCI (aMCI) (0.8±1.2, p = .006) and naMCI patients (0.7±1.2, p = .002) used“sleep medication”significantly more often than controls (0.1±0.6) Both, aMCI (11.5±8.6, p<.001) and naMCI (11.5±8.6, p<.001) patients showed significantly OPEN ACCESS
Citation:Seidel S, Dal-Bianco P, Pablik E, Müller N,
Schadenhofer C, Lamm C, et al. (2015) Depressive Symptoms are the Main Predictor for Subjective Sleep Quality in Patients with Mild Cognitive Impairment—A Controlled Study. PLoS ONE 10(6): e0128139. doi:10.1371/journal.pone.0128139
Academic Editor:Sonia Brucki, University Of São
Paulo, BRAZIL
Received:December 30, 2014
Accepted:April 22, 2015
Published:June 19, 2015
Copyright:© 2015 Seidel et al. This is an open
access article distributed under the terms of the
Creative Commons Attribution License, which permits unrestricted use, distribution, and reproduction in any medium, provided the original author and source are credited.
Data Availability Statement:All relevant data are
within the paper.
Funding:The authors have no support or funding to
report.
Competing Interests:The authors have declared
higher BDI-II scores than healthy controls (6.1±5.3). Linear regression analysis showed that the subjective sleep quality was predicted by depressive symptoms in aMCI (p<.0001) and naMCI (p<.0001) patients as well as controls (p<.0001). This means, that more depressive symptoms worsened subjective sleep quality. In aMCI patients we also found a significant interaction between depressive symptoms and global cognitive function (p = .002)
Discussion
Depressive symptoms were the main predictor of subjective sleep quality in MCI patients and controls, but not in SCD patients. Better global cognitive function ameliorated the nega-tive effect of depressive symptoms on the subjecnega-tive sleep quality in aMCI patients.
Introduction
Based on a growing pile of scientific evidence we know that cognitive deficits, mood disorders and non-restorative sleep are linked somehow[1]. Depending on the definition of mild cogni-tive impairment (MCI) between 14% and 63% of MCI patients report non-restoracogni-tive sleep [2,3]. Cross-sectional studies have reported an inverted u-shaped relationship between sleep quality and cognitive status, with moderately demented individuals showing more impaired sleep than individuals who are in the early and advanced stages of disease[4,5]. Naismith and colleagues elegantly demonstrated that sleep-wake disturbances were linked to poor neuropsy-chological functioning, even after controlling for depression and apnea severity[6]. Depressive symptoms, cognition, antidepressant usage, alcohol consumption, age and education have been identified as significant predictors of self-reported sleep quality in MCI patients[3].
Subjective cognitive decline (SCD[7]) in the elderly has rather been linked to depressive symptoms than to a deterioration of objective cognitive performance[8]. SCD patients also suf-fer from insomnia more frequently than healthy controls[9]. A longitudinal study in older men found that disruption of the circadian rest-activity rhythm contributed to the worsening of depressive symptoms[10].
To the best of our knowledge, no other study has previously attempted to investigate inde-pendent predictors of the subjective sleep quality in patients with SCD and MCI using a con-trolled study design. Therefore, we performed a cross-sectional study on patients from our outpatient department for memory disorders and healthy controls and assessed potential pre-dictors of their subjective sleep quality.
Materials and Methods
Between February 2012 and May 2014 all consecutive patients at the outpatient department for memory disorders, who had either been referred by a neurologist or visited for a follow-up exam, underwent a semistructured interview covering general medical history, a neurological exam and a detailed neuropsychological test[11]. The study protocol was in accordance with the Helsinki Declaration and approved by the Ethical Committee of the Medical University of Vienna. Written consent was obtained from each participant.
patients with (sub-) depressive symptoms were included because (sub-) depressive symptoms often occur in elderly patients, (iv) any medical condition that leads to severe cognitive deterio-ration including renal, respiratory, cardiac, and hepatic disease, and (v) diagnosis of dementia according to DSM IV[13].
After the completion of the evaluation, the cognitive status of MCI subtypes was determined according to the Petersen criteria[14], and the cut-off score used was 1.5 standard deviations below age and education corrected norms using a normative sample of cognitively healthy con-trols. For this purpose, the flexible GAMLSS (Generalized Additive Models for Location, Scale and Shape) model class was used[15,16]. The minimum mode of MCI classification was used and patients were divided into three groups of patients based on cognitive features as follows: subjective cognitive impairment (SCD) patients (all mean z-scores of each neuropsychological test were greater than−1.5 SD), amnestic MCI (aMCI) (at least one z-score of the memory test
was below−1.5 SD) and non-amnestic MCI (naMCI) patients (one z-scores of at least one
domain other than memory domain was below−1.5 SD), respectively. SCD was defined
according to the research criteria published by Jessen et al.[7]: (1) self-experienced persistent decline in cognitive capacity in comparison with a previously normal status and unrelated to an acute event and (2) normal age-, gender-, and education-adjusted performance on standard-ized cognitive tests, which are used to classify mild cognitive impairment (MCI) or prodromal
Alzheimer’s dementia (AD). For the assessment of subjective memory complaint (SMC), the
Forgetfulness Assessment Inventory (FAI) scale was used[11,17].
Great care was taken enrolling a sufficient number of cognitively healthy control subjects living independently at home. They underwent a rigorous screening evaluation using a standardized clinical interview and cognitive screening. Imaging procedures, neurological examination, standard laboratory blood tests, and informant reports were not included in the evaluation. They were assessed as being in good health. Criteria for healthy function were iden-tified as being similar to those in the Mayo research studies[18]: (i) no active neurological or psychiatric disease, (ii) no psychotropic medications, and (iii) the subjects may have medical disorders but neither they nor their treatment compromises cognitive function. Cognitive sta-tus was given special attention and cognitively healthy control subjects were screened for intact cognition. They were required to have a score27 on the Mini-Mental State Examination[19]. Subjective sleep quality was assessed using the German version of the Pittsburgh Sleep Qual-ity Index (PSQI)[20] a questionnaire that measures sleep quality over the previous month using 7 subscales measuring different components of sleep: subjective sleep quality, sleep latency, sleep duration, habitual sleep efficiency, sleep disturbances, use of sleep medication, and daytime dysfunction. Each component is reflected by a score ranging from 0 to 3, whereby 3 indicates the worse sleep quality. Good sleepers were defined as individuals with a PSQI score
<5 and poor sleepers as individuals with a PSQI score5.
The Epworth Sleepiness Scale (ESS)[21] is also a self-rating instrument to evaluate the ten-dency to doze off during daytime. It consists of eight items concerning everyday situations. Reponses to each item are ranked from 0 to 3 according to the probability for dozing off during a task (0 = never, 1 = low probability, 2 = moderate probability, 3 = high probability). A score
10 indicates excessive daytime sleepiness.
The Beck Depression Inventory (BDI-II), a 21-item instrument to detect depressive symp-toms in adults was used. It asks about how often one felt certain ways within the past two weeks, rated on a four-point scale. A score>10 is indicative of a clinically relevant depressive
Statistical analysis
Demographic variables are described by means and standard deviations. In order to compare dependent variables between groups and subgroups, t-tests, Chi square tests and one-way ANOVAs have been computed. Uncorrected p-values are given. Post-hoc pairwise compari-sons have been adjusted using Tukey’s HSD. Spearman’s correlation analysis was used to ana-lyze the relationship between the subjective sleep quality (PSQI score) and demographic, clinical parameters and neuropsychological scores.
As possible explanatory variables for the subjective sleep quality (i.e. PSQI score) we used the years of education, BDI-II score, MMSE score, diagnosis (aMCI, naMCI, SCD and control) and ESS score. Due to their skewed distribution the variables PSQI score and BDI-II score were transformed: square root transformation was chosen instead of logarithmic transformation to avoid problems with zero values. Model selection was done by stepwise forward selection according to the best AIC. Interactions were only tested if at least one of the interacting vari-ables was already accepted in the model.
For the logistic regression analysis the widely accepted cut-off for the PSQI (i.e. 5 points) [20] was employed and patients and controls dichotomized into good sleepers with a PSQI score<5 vs. poor sleeper with a PSQI score5. Explanatory variables and type of model selection was identical to the linear regression model.
Linear regression analysis was used to test the factors age, sex, years of education, ESS, BDI and PSQI scores as predictors for the cognitive performance (MMSE score).
P-values<0.05 were considered to be statistically significant. All computations were
per-formed using SPSS statistical software, Version 20.0, except GAMLSS estimation, which was done using R 2.11.1.
Results
One hundred fifty eight consecutive patients complaining about memory problems who came to the memory outpatient clinic for assessment of a possible cognitive disorder fulfilled the inclusion criteria and were included in the study. Patients were either referred by physicians or were self-referrals.
Fifty seven (37%) patients were classified as aMCI, 75 (47%) as naMCI, and 26 (16%) as SCD as described above. We also included 75 healthy controls in this study. Demographic and clinical characteristics of patients and controls can be found inTable 1.
AMCI patients (27.6±1.7) showed a significantly lower MMSE score than naMCI patients (28.3±1.5, p = .02), SCD patients (29.1±1.0, p<.001) and controls (29.0±1.1, p = .002). Both,
aMCI (11.5±8.6, p<.001) and naMCI (11.5±8.6, p<.001) patients showed significantly
higher BDI-II scores than healthy controls (6.1±5.3) (Tables1and2).
The MMSE score was inversely correlated with age (p<.001) and directly correlated with
the years of education (p<.001). Linear regression analysis showed that the age (p<.001)
and years of education (p<.001) were significant predictors for the MMSE score, meaning
that higher age predicated a lower MMSE score and a higher number of years of education predicated a higher MMSE score.
Subjective sleep quality, sleep medication and daytime sleepiness
Thirty one (41%) aMCI and 28 (49%) naMCI patients), 12 (46%) SCD patients and 48 (64%) healthy controls were good sleepers (i.e. had PSQI scores<5 points).medication”(p = .001) (Table 1). Pairwise comparison of PSQI scores showed that naMCI patients (5.4±3.5) had significantly higher PSQI scores than controls (4.3±2.8, p = .003) (Table 2). Pairwise comparison of PSQI subscores showed that naMCI patients (1.1±0.4) had significantly more“sleep disturbances”than controls (0.9±0.5, p = .003). AMCI (0.8±1.2, p = .006) and naMCI patients (0.7±1.2, p = .002) used“sleep medication”significantly more often than controls (0.1±0.6) (Table 2).
Thirteen (23%) aMCI and 17 (23%) naMCI patients and 7 (27%) SCD patients, and none of the healthy controls took sleep medication on a daily basis (p<.001). Antidepressants (i.e.
trazodone or mirtazapine) were used by 6 (46%) aMCI, 12 (70%) naMCI and 6 (85%) SCD patients. Benzodiazepines (i.e. triazolam or diazepam) or a benzodiazepine-receptor-agonist (i.e. zolpidem) were used by 5 (38%) aMCI, 3 (18%) naMCI and none of the SCD patients. The antipsychotic prothipendyl was used by 2 (15%) aMCI, 2 (12%) naMCI and 1 (17%) SCD patients.
The level of daytime sleepiness (ESS scores) did not differ significantly between patients and controls (Table 1).
The subjective sleep quality (PSQI score) was inversely correlated with the years of educa-tion (p<.001) and directly correlated with depressive symptoms (BDI-II score) (p<.001),
meaning the more years of education the better the sleep quality (i.e. lower PSQI scores) and the more depressive symptoms the worse the sleep quality (i.e. higher PSQI scores). Figs1and
2show the relative frequencies of good vs. poor sleepers with respect to the years of education and depressive symptoms (BDI-II scores).
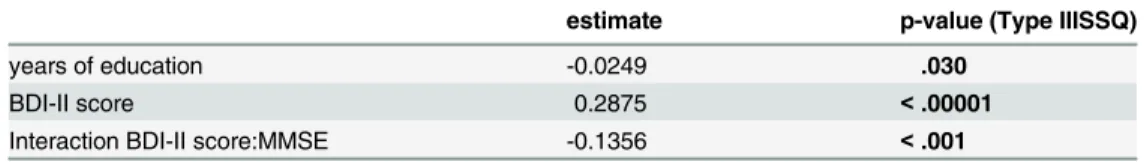
The best linear regression model for the metric variable PSQI score is shown inTable 3. This model showed that depressive symptoms (BDI-II score) (p<.0001) and, to a lesser
extent, the years of education (p = .030) significantly predicted the subjective sleep quality (PSQI score). We also found a significant interaction between depressive symptoms (BDI-II
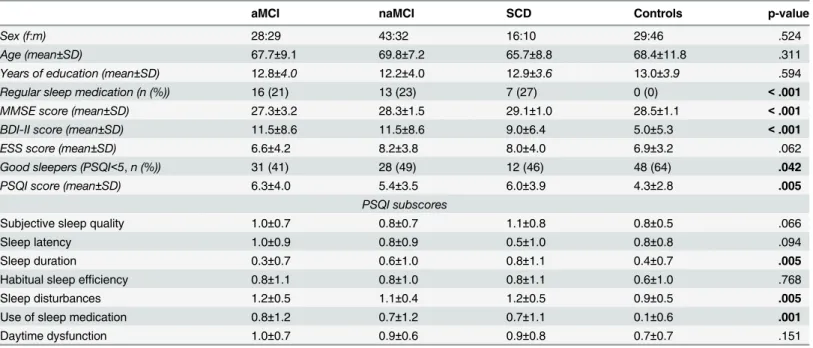
Table 1. Demographic and clinical characteristics of patients and controls.
aMCI naMCI SCD Controls p-value
Sex (f:m) 28:29 43:32 16:10 29:46 .524
Age (mean±SD) 67.7±9.1 69.8±7.2 65.7±8.8 68.4±11.8 .311
Years of education (mean±SD) 12.8±4.0 12.2±4.0 12.9±3.6 13.0±3.9 .594
Regular sleep medication (n (%)) 16 (21) 13 (23) 7 (27) 0 (0) <.001
MMSE score (mean±SD) 27.3±3.2 28.3±1.5 29.1±1.0 28.5±1.1 <.001 BDI-II score (mean±SD) 11.5±8.6 11.5±8.6 9.0±6.4 5.0±5.3 <.001
ESS score (mean±SD) 6.6±4.2 8.2±3.8 8.0±4.0 6.9±3.2 .062
Good sleepers (PSQI<5,n (%)) 31 (41) 28 (49) 12 (46) 48 (64) .042
PSQI score (mean±SD) 6.3±4.0 5.4±3.5 6.0±3.9 4.3±2.8 .005
PSQI subscores
Subjective sleep quality 1.0±0.7 0.8±0.7 1.1±0.8 0.8±0.5 .066
Sleep latency 1.0±0.9 0.8±0.9 0.5±1.0 0.8±0.8 .094
Sleep duration 0.3±0.7 0.6±1.0 0.8±1.1 0.4±0.7 .005
Habitual sleep efficiency 0.8±1.1 0.8±1.0 0.8±1.1 0.6±1.0 .768
Sleep disturbances 1.2±0.5 1.1±0.4 1.2±0.5 0.9±0.5 .005
Use of sleep medication 0.8±1.2 0.7±1.2 0.7±1.1 0.1±0.6 .001
Daytime dysfunction 1.0±0.7 0.9±0.6 0.9±0.8 0.7±0.7 .151
aMCI = amnestic MCI patients, naMCI = non-amnestic MCI patients, SCD = subjective cognitive decline patients, MMSE = Mini Mental State Examination, PSQI = Pittsburgh Sleep Quality Index, BDI-II = Beck Depression Inventory, SD = standard deviation.
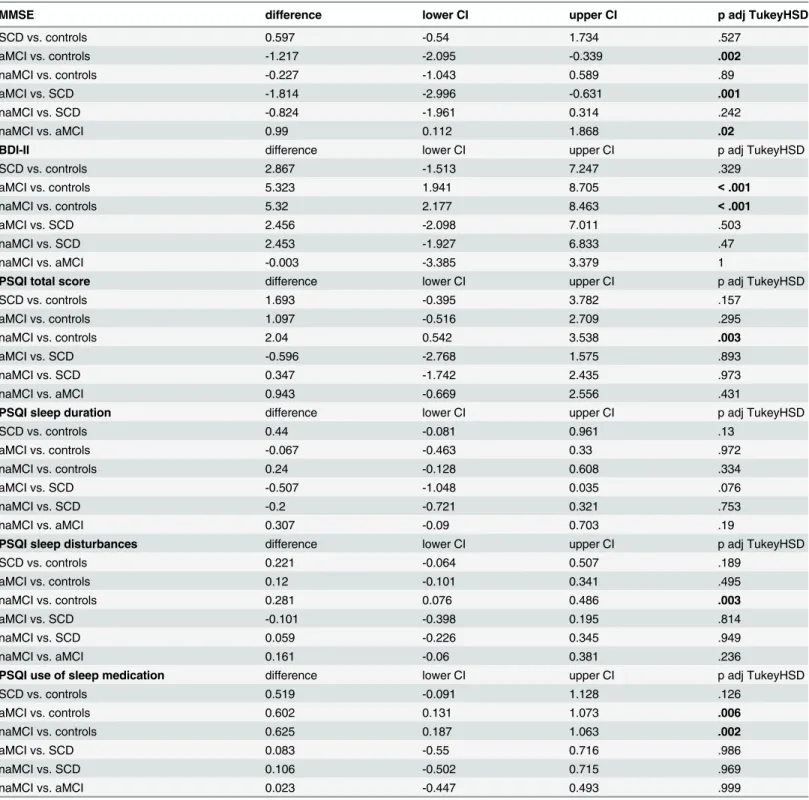
Table 2. Pairwise comparison of MMSE, BDI and PSQI (sub-)scores between aMCI-, naMCI-, SCD patients and controls.
MMSE difference lower CI upper CI p adj TukeyHSD
SCD vs. controls 0.597 -0.54 1.734 .527
aMCI vs. controls -1.217 -2.095 -0.339 .002
naMCI vs. controls -0.227 -1.043 0.589 .89
aMCI vs. SCD -1.814 -2.996 -0.631 .001
naMCI vs. SCD -0.824 -1.961 0.314 .242
naMCI vs. aMCI 0.99 0.112 1.868 .02
BDI-II difference lower CI upper CI p adj TukeyHSD
SCD vs. controls 2.867 -1.513 7.247 .329
aMCI vs. controls 5.323 1.941 8.705 <.001
naMCI vs. controls 5.32 2.177 8.463 <.001
aMCI vs. SCD 2.456 -2.098 7.011 .503
naMCI vs. SCD 2.453 -1.927 6.833 .47
naMCI vs. aMCI -0.003 -3.385 3.379 1
PSQI total score difference lower CI upper CI p adj TukeyHSD
SCD vs. controls 1.693 -0.395 3.782 .157
aMCI vs. controls 1.097 -0.516 2.709 .295
naMCI vs. controls 2.04 0.542 3.538 .003
aMCI vs. SCD -0.596 -2.768 1.575 .893
naMCI vs. SCD 0.347 -1.742 2.435 .973
naMCI vs. aMCI 0.943 -0.669 2.556 .431
PSQI sleep duration difference lower CI upper CI p adj TukeyHSD
SCD vs. controls 0.44 -0.081 0.961 .13
aMCI vs. controls -0.067 -0.463 0.33 .972
naMCI vs. controls 0.24 -0.128 0.608 .334
aMCI vs. SCD -0.507 -1.048 0.035 .076
naMCI vs. SCD -0.2 -0.721 0.321 .753
naMCI vs. aMCI 0.307 -0.09 0.703 .19
PSQI sleep disturbances difference lower CI upper CI p adj TukeyHSD
SCD vs. controls 0.221 -0.064 0.507 .189
aMCI vs. controls 0.12 -0.101 0.341 .495
naMCI vs. controls 0.281 0.076 0.486 .003
aMCI vs. SCD -0.101 -0.398 0.195 .814
naMCI vs. SCD 0.059 -0.226 0.345 .949
naMCI vs. aMCI 0.161 -0.06 0.381 .236
PSQI use of sleep medication difference lower CI upper CI p adj TukeyHSD
SCD vs. controls 0.519 -0.091 1.128 .126
aMCI vs. controls 0.602 0.131 1.073 .006
naMCI vs. controls 0.625 0.187 1.063 .002
aMCI vs. SCD 0.083 -0.55 0.716 .986
naMCI vs. SCD 0.106 -0.502 0.715 .969
naMCI vs. aMCI 0.023 -0.447 0.493 .999
aMCI = amnestic MCI, naMCI = non-amnestic MCI, SCD = subjective cognitive decline, MMSE = Mini Mental State Examination, BDI-II = Beck Depression Inventory, PSQI = Pittsburgh Sleep Quality Index, p adj Tukey HSD = adjusted p-values for post-hoc Tukey’s HSD, CI = 95% confidence interval.
score) and global cognitive function (MMSE score) (p<.001), meaning that the direct
correla-tion between subjective sleep quality (PSQI score) and depressive symptoms (BDI-II score) was alleviated by better global cognitive function (increased MMSE scores) (Table 3).
Fig 1. Relative frequency (in percent) of good (black) and bad (white) sleepers in each group of patients with the same number of years of education.The number of patients is shown above the bars and the number of years of education is shown below the bars.
doi:10.1371/journal.pone.0128139.g001
Fig 2. Relative frequency of good (black) and bad (white) sleepers in each group of patients with similar BDI scores.The number of patients is shown above the bars and the range of BDI score for each subgroup is shown below the bars.
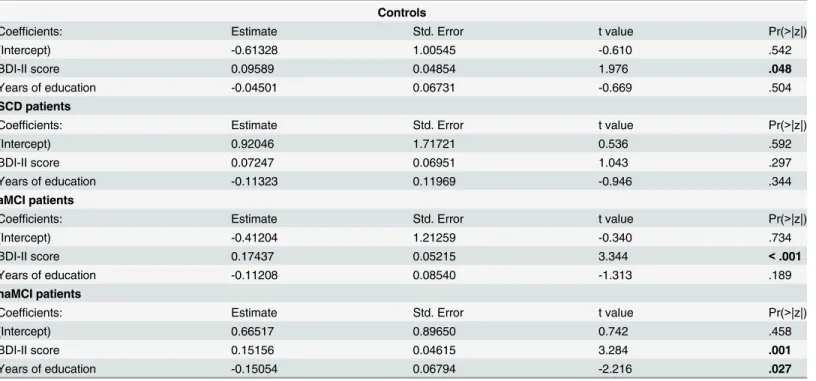
The best logistic regression model for the dichotomized PSQI score (cut-off 5 points) is shown inTable 4. This model showed that depressive symptoms (BDI-II score) (p<.0001) and
to a lesser extent the years of education (p = .030) significantly predicted the sleep status. We did not observe a significant interaction between the BDI-II and the MMSE score in this model.
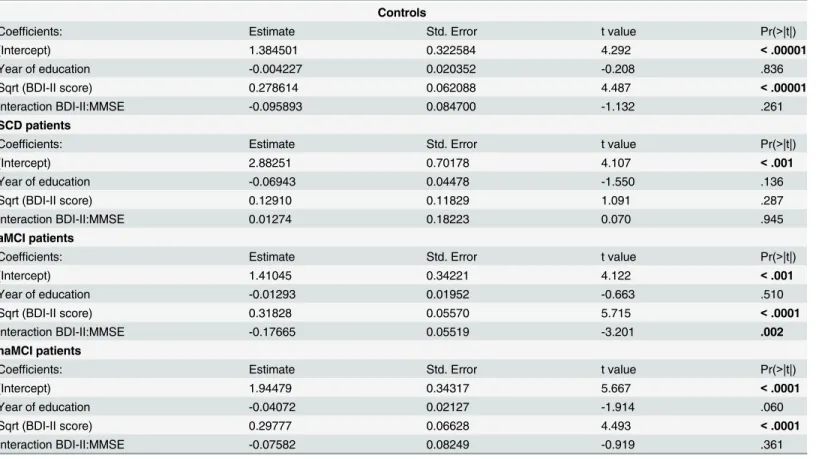
We re-ran the calculation of the two final models for each subgroup (aMCI, naMCI, SCD and controls) separately to check whether the observed relationships in the full model were mainly driven by one or two particular subgroups (Tables5and6). These calculations showed that the subjective sleep quality (PSQI score) was significantly predicted by the depressive symptoms in aMCI (p<.0001) and naMCI (p<.0001) patients as well as controls (p<
.0001). In aMCI patients we also found a significant interaction between depressive symptoms (BDI-II score) and global cognitive function (MMSE score) (p = .002) (Table 5) as we did for the whole sample (Table 3). The sleep status was significantly predicted by the depressive symptoms in aMCI (p<.001) and naMCI (p<.001) patients as well as controls (p = .042).
Only in naMCI patients the sleep status was also significantly predicted by the years of educa-tion (p = .027) (Table 6).
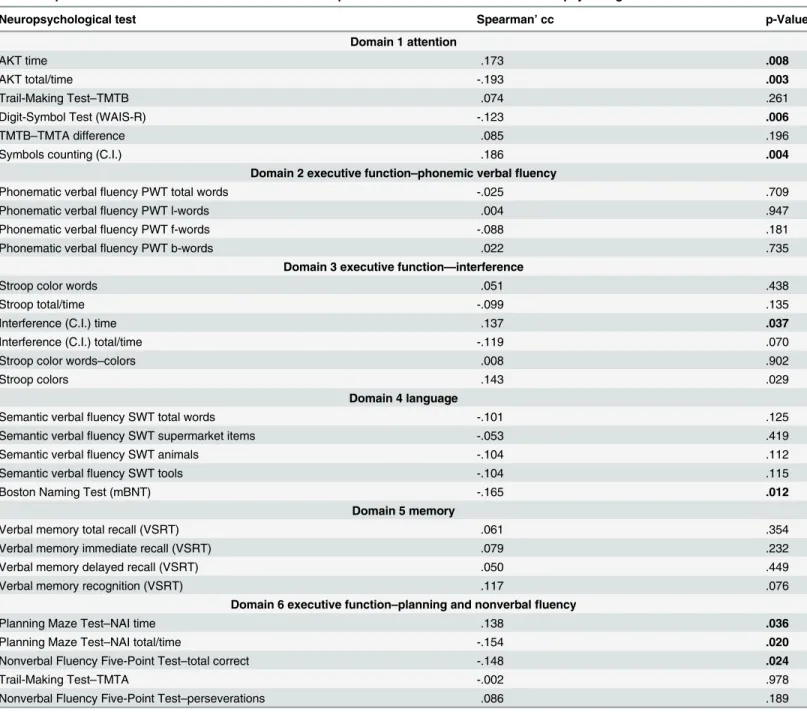
Subjective sleep quality and neuropsychological test scores
We also investigated the relationship between the subjective sleep quality (PSQI score) and neuropsychological test scores in the whole sample. We found weak but significant positive cor-relations (i.e. the better the neuropsychological test score the worse the subjective sleep quality, represented by a higher PSQI score) between the PSQI score and items from domain 1“ atten-tion”, i.e. AKT time (p = .008), Symbols counting (C.I.) (p = .004), domain 3“executive func-tion–interference”, i.e. interference (C.I.) time (p = .037), and domain 6“executive function–
planning and nonverbal fluency”, i.e. Planning Maze Test–NAI time (p = .036) (Table 7). We found weak but significant negative correlations (i.e. the better the neuropsychological test score the better the subjective sleep quality, represented by a lower PSQI score) between the PSQI score and items from domain 1“attention”, i.e. AKT total/time (p = .003) and Digital-Symbol Test (WAIS-R) (p = .006), domain 4“language”, i.e. Boston Naming Test (mBNT) (p = .012) and domain 6“executive function–planning and nonverbal fluency”, i.e. Planning Maze Test–NAI total/time (p = .020) and Nonverbal Fluency Five-Point Test–total correct (p = .024) (Table 7). Due to the small subgroup sizes we did not perform these calculations for each subgroup.
Table 3. Best linear regression model for PSQI score among the whole sample.
estimate p-value (Type IIISSQ)
years of education -0.0249 .030
BDI-II score 0.2875 <.00001
Interaction BDI-II score:MMSE -0.1356 <.001
MMSE = Mini Mental State Examination, BDI-II = Beck Depression Inventory
doi:10.1371/journal.pone.0128139.t003
Table 4. Best logistic regression model for the sleep status among the whole sample.
estimate p-value (Type IIISSQ)
Years of education -0.0249 .030
BDI-II score 0.2875 <.00001
BDI-II = Beck Depression Inventory
Discussion
This is the first controlled study investigating predictors of subjective sleep quality which included patients with objective (MCI) and subjective memory impairment (SCD). Depressive symptoms were the main predictor of subjective sleep quality in MCI patients and controls. Educational attainment predicted the subjective sleep quality only in naMCI patients. Increased global cognitive function appeared to mitigate the relationship between depressive symptoms and subjective sleep quality in aMCI patients.
Similar to a previous study[23,24] we found a higher frequency of depressive symptoms in aMCI and naMCI patients compared to controls. Ausén et al. failed to detect differences of depres-sive symptoms between patients with subjective cognitive impairment, MCI patients and controls [23]. Interestingly, regarding their subjective sleep quality or depressive symptoms our SCD patients did not differ significantly from MCI patients or controls either. However, the number of SCD patients using sleep medication, predominantly antidepressants, on a regular basis was com-parable to aMCI and naMCI patients. A recent study showed that the use of sleep medication was independently associated with depression in older adults[25]. The fact that these SCD patients were taking sleep medication may already have improved their subjective sleep quality and thus, their (subclinical) depression. The lack of differences between SCD and MCI patients may also be due to a“contamination”of SCD by early MCI since we know that neurodegeneration evolves continually [26,27]. Moreover, we cannot rule out lack of statistical power due to the small subgroup sizes.
Table 5. Best linear regression models for PSQI score for each subgroup.
Controls
Coefficients: Estimate Std. Error t value Pr(>|t|)
(Intercept) 1.384501 0.322584 4.292 <.00001
Year of education -0.004227 0.020352 -0.208 .836
Sqrt (BDI-II score) 0.278614 0.062088 4.487 <.00001
Interaction BDI-II:MMSE -0.095893 0.084700 -1.132 .261
SCD patients
Coefficients: Estimate Std. Error t value Pr(>|t|)
(Intercept) 2.88251 0.70178 4.107 <.001
Year of education -0.06943 0.04478 -1.550 .136
Sqrt (BDI-II score) 0.12910 0.11829 1.091 .287
Interaction BDI-II:MMSE 0.01274 0.18223 0.070 .945
aMCI patients
Coefficients: Estimate Std. Error t value Pr(>|t|)
(Intercept) 1.41045 0.34221 4.122 <.001
Year of education -0.01293 0.01952 -0.663 .510
Sqrt (BDI-II score) 0.31828 0.05570 5.715 <.0001
Interaction BDI-II:MMSE -0.17665 0.05519 -3.201 .002
naMCI patients
Coefficients: Estimate Std. Error t value Pr(>|t|)
(Intercept) 1.94479 0.34317 5.667 <.0001
Year of education -0.04072 0.02127 -1.914 .060
Sqrt (BDI-II score) 0.29777 0.06628 4.493 <.0001
Interaction BDI-II:MMSE -0.07582 0.08249 -0.919 .361
aMCI = amnestic MCI, naMCI = non-amnestic MCI, SCD = subjective cognitive decline, MMSE = Mini Mental State Examination, BDI-II = Beck Depression Inventory
Previous research on predictors of subjective sleep quality in patients with memory impairment has yielded conflicting data[28]. McKinnon et al. [3]reported that depressive symptoms explained the largest portion of variance in PSQI (sub-)scores, which is line with our findings. While other authors[3] found an array of variables to predict the subjective sleep quality in patients with memory impairment, we could only identify education the other signif-icant predictor. This sociodemographic variable is a surrogate of general health-related factors (i.e. body mass index, physical activity, smoking status, alcohol consumption etc.). The positive effect of education on sleep quality has been illustrated previously in the general population [29]. However, recently, it was shown that medical burden, physical exercise and body mass index were not associated with subjective sleep quality in MCI patients[3].
We confirm the findings of other studies comparing the subjective sleep quality of MCI sub-types [30], which did not detect any differences between aMCI and naMCI patients. Notably, our naMCI patients had significantly more trouble maintaining sleep than controls. Decreased maintenance of sleep has previously been shown to differentiate naMCI from aMCI who reported difficulties initiating sleep and early morning awakenings[31].
Our finding that increased global cognitive function (MMSE score) mitigated the negative effect of depressive symptoms on the subjective sleep quality in aMCI patients leads us into the discussion of the relationship between neurodegeneration, mood and sleep-wake disorders. Due to the small subgroup sizes we may not present consistent data on neuropsychological subdomains, but we like to speculate on the neuroanatomical and functional relationships. To us, the hippocampus with its widespread connections lies at the core of these interwined conditions. During non-REM sleep it plays an essential role in the consolidation of declarative memories[32]. Sleep restriction causes disrupted functional connectivity in neural circuits
Table 6. Best logistic regression models for the sleep status for each subgroup.
Controls
Coefficients: Estimate Std. Error t value Pr(>|z|)
(Intercept) -0.61328 1.00545 -0.610 .542
BDI-II score 0.09589 0.04854 1.976 .048
Years of education -0.04501 0.06731 -0.669 .504
SCD patients
Coefficients: Estimate Std. Error t value Pr(>|z|)
(Intercept) 0.92046 1.71721 0.536 .592
BDI-II score 0.07247 0.06951 1.043 .297
Years of education -0.11323 0.11969 -0.946 .344
aMCI patients
Coefficients: Estimate Std. Error t value Pr(>|z|)
(Intercept) -0.41204 1.21259 -0.340 .734
BDI-II score 0.17437 0.05215 3.344 <.001
Years of education -0.11208 0.08540 -1.313 .189
naMCI patients
Coefficients: Estimate Std. Error t value Pr(>|z|)
(Intercept) 0.66517 0.89650 0.742 .458
BDI-II score 0.15156 0.04615 3.284 .001
Years of education -0.15054 0.06794 -2.216 .027
aMCI = amnestic MCI, naMCI = non-amnestic MCI, SCD = subjective cognitive decline, MMSE = Mini Mental State Examination, BDI-II = Beck Depression Inventory
involving networks responsible for emotional and executive processing[33]. Depression is not only associated with decreased hippocampal volume[34] but also impaired corticohippocampal
connectivity[35]. Grey matter volume within the above mentioned networks has been shown
to be decreased in MCI patients[36]. Education serves as one of the positive modulators of hip-pocampal volume[37].
Table 7. Spearman correlation coefficients for the whole sample between PSQI total scores and neuropsychological subdomains.
Neuropsychological test Spearman’cc p-Value
Domain 1 attention
AKT time .173 .008
AKT total/time -.193 .003
Trail-Making Test–TMTB .074 .261
Digit-Symbol Test (WAIS-R) -.123 .006
TMTB–TMTA difference .085 .196
Symbols counting (C.I.) .186 .004
Domain 2 executive function–phonemic verbalfluency
Phonematic verbalfluency PWT total words -.025 .709
Phonematic verbalfluency PWT l-words .004 .947
Phonematic verbalfluency PWT f-words -.088 .181
Phonematic verbalfluency PWT b-words .022 .735
Domain 3 executive function—interference
Stroop color words .051 .438
Stroop total/time -.099 .135
Interference (C.I.) time .137 .037
Interference (C.I.) total/time -.119 .070
Stroop color words–colors .008 .902
Stroop colors .143 .029
Domain 4 language
Semantic verbalfluency SWT total words -.101 .125
Semantic verbalfluency SWT supermarket items -.053 .419
Semantic verbalfluency SWT animals -.104 .112
Semantic verbalfluency SWT tools -.104 .115
Boston Naming Test (mBNT) -.165 .012
Domain 5 memory
Verbal memory total recall (VSRT) .061 .354
Verbal memory immediate recall (VSRT) .079 .232
Verbal memory delayed recall (VSRT) .050 .449
Verbal memory recognition (VSRT) .117 .076
Domain 6 executive function–planning and nonverbalfluency
Planning Maze Test–NAI time .138 .036
Planning Maze Test–NAI total/time -.154 .020
Nonverbal Fluency Five-Point Test–total correct -.148 .024
Trail-Making Test–TMTA -.002 .978
Nonverbal Fluency Five-Point Test–perseverations .086 .189
Cc = correlation coefficient; AKT = Alters-Konzentrations-Test; WAIS-R = Wechsler Adult Intelligence Scale—Revised; TMTA = Trail Making Test Version A; TMTB = Trail Making Test Version B; NAI = Nürnberger Alters Inventar; C.I. = Cerebral Insufficiency Test; VSRT = Verbal Selective Reminding Test; mBNT = modified Boston Naming Test.
Excessive daytime sleepiness (EDS) has been associated with an increased risk for cognitive decline[38]. Ferman et al. showed that MCI patients with EDS were more likely to develop dementia with Lewy bodies[39]. Daytime sleepiness is also associated with sleep apnea[40]. A controlled study failed to detect an association between sleep disordered breathing (SDB) and MCI[41]. We did not observe significant differences of EDS between patients and controls. One has to keep in mind that self-report scales like the ESS may not be sensitive enough to detect more subtle changes of our sleep-wake behavior. Disruption of functional connectivity in the resting state-network has recently been associated with daytime sleepiness[42].
Our study is limited by the lack of objective sleep parameters (actigraphy and/or polysom-nography) and therefore we cannot fully rule out sleep-disordered-breathing or periodic limb movements during sleep in our sample. The PSQI relies entirely on self-report, but the problem of sleep misperception with an overestimation of sleep onset latency by MCI patients has recently been highlighted[43]. Actigraphic assessment of circadian rhythms in our patients may have yielded additional and relevant information. A recent actigraphic study has
highlighted the possible role of delayed circadian rhythms as a risk factor for cognitive decline [44]. Although a clinical assessment of depression was not conducted to establish major depression diagnoses and lifetime depressive histories, the use of the BDI, which has been reported to show high reliability and good correlation with measures of depression and anxiety [45]enabled us to properly investigate psychiatric symptoms. The hospital-based study design of our study precludes the generalizability of our findings on to population level.
To conclude, this is the first cross-sectional controlled study showing that depressive symp-toms predicted the subjective sleep quality in MCI patients and healthy controls, but not in SCD patients. Educational attainment appeared to act positively on the subjective sleep quality in naMCI patients. Better global cognitive function ameliorated the negative effect of depres-sive symptoms on the subjective sleep quality in aMCI patients. Future longitudinal studies including objective measurements of sleep variables should clarify the relationship of mood disorders, subjective cognitive decline and sleep.
Author Contributions
Analyzed the data: SS EP. Wrote the paper: SS. Research project conception, organization, and execution: JL NM CS DM SK GP PDB. Statistical analysis design, execution, review and cri-tique: SS EP. Manuscript, writing first draft and review and cricri-tique: JL EA SS CL GK.
References
1. Ju YE, McLeland JS, Toedebusch CD, Xiong C, Fagan AM, Duntley SP et al. (2013) Sleep quality and preclinical Alzheimer disease. JAMA Neurol 70: 587–593. 1663363 [pii];doi:10.1001/jamaneurol. 2013.2334PMID:23479184
2. Beaulieu-Bonneau S, Hudon C (2009) Sleep disturbances in older adults with mild cognitive impairment. Int Psychogeriatr 21: 654–666. S1041610209009120 [pii];doi:10.1017/ S1041610209009120PMID:19426575
3. McKinnon A, Terpening Z, Hickie IB, Batchelor J, Grunstein R, Lewis SJ et al. (2014) Prevalence and predictors of poor sleep quality in mild cognitive impairment. J Geriatr Psychiatry Neurol 27: 204–211. 0891988714527516 [pii];doi:10.1177/0891988714527516PMID:24687189
4. Reisberg B, Ferris SH, de Leon MJ, Kluger A, Franssen E, Borenstein J et al. (1989) The stage specific temporal course of Alzheimer's disease: functional and behavioral concomitants based upon cross-sectional and longitudinal observation. Prog Clin Biol Res 317: 23–41. PMID:2690101
6. Naismith SL, Rogers NL, Lewis SJ, Terpening Z, Ip T, Diamond K et al. (2011) Sleep disturbance relates to neuropsychological functioning in late-life depression. J Affect Disord 132: 139–145. S0165-0327(11)00081-4 [pii];doi:10.1016/j.jad.2011.02.027PMID:21435728
7. Jessen F (2014) Subjective and objective cognitive decline at the pre-dementia stage of Alzheimer's disease. Eur Arch Psychiatry Clin Neurosci 264 Suppl 1: 3–7. doi:10.1007/s00406-014-0539-z 8. Minett TS, Da Silva RV, Ortiz KZ, Bertolucci PH (2008) Subjective memory complaints in an elderly
sample: a cross-sectional study. Int J Geriatr Psychiatry 23: 49–54. doi:10.1002/gps.1836PMID: 17520662
9. Clarnette RM, Almeida OP, Forstl H, Paton A, Martins RN (2001) Clinical characteristics of individuals with subjective memory loss in Western Australia: results from a cross-sectional survey. Int J Geriatr Psychiatry 16: 168–174. doi:10.1002/1099-1166(200102)16:2<168::AID-GPS291>3.0.CO;2-D[pii]. PMID:11241722
10. Smagula SF, Ancoli-Israel S, Blackwell T, Boudreau R, Stefanick ML, Paudel ML et al. (2014) Circadian Rest-Activity Rhythms Predict Future Increases in Depressive Symptoms Among Community-Dwelling Older Men. Am J Geriatr Psychiatry. S1064-7481(14)00193-6 [pii];doi:10.1016/j.jagp.2014.06.007 11. Lehrner J, Moser D, Klug S, Gleiss A, Auff E, Dal-Bianco P et al. (2013) Subjective memory complaints,
depressive symptoms and cognition in patients attending a memory outpatient clinic. Int Psychogeriatr 1–11. S1041610213002263 [pii];doi:10.1017/S1041610213002263
12. Dilling H, Mombour W, Schmidt MH (2000) Internationale Klassifikation Psychischer Störungen. ICD-10 Kapitel V (F). Klinisch-diagnostische Leitlinien, 4th edn. Bern: Huber.
13. Saß H, Wittchen HU, Zaudig M, Houben I (2003) Diagnostisches und statistisches Manualpsychischer Störungen—Textrevision—DSM-IV-TR Göttingen: Hogrefe Verlag für Psychologie.
14. Petersen RC, Morris JC (2005) Mild cognitive impairment as a clinical entity and treatment target. Arch Neurol 62: 1160–1163. 62/7/1160 [pii];doi:10.1001/archneur.62.7.1160PMID:16009779
15. Stasinopoulus DM, Rigby RA (2007) Generalized additive models for location scale and shape (GAMLSS). Journal of Statistical Software, 23, 1–46.
16. Pusswald G, Moser D, Gleiss A, Janzek-Hawlat S, Auff E, Dal-Bianco P et al. (2013) Prevalence of mild cognitive impairment subtypes in patients attending a memory outpatient clinic—comparison of two modes of mild cognitive impairment classification. Results of the Vienna Conversion to Dementia Study. Alzheimers Dement 9: 366–376. S1552-5260(12)00031-3 [pii];10.1016/j.jalz.2011.12.009 . doi: 10.1016/j.jalz.2011.12.009PMID:23164551
17. Kogler B (2013) Subjective Memory Complaint in Mild Cognitive Impairment, Alzheimer's Disease and Parkinson's Disease. Vienna: University of Vienna.
18. Ivnik RJ (1992) Mayo`s older Americans normative studies: WAIS-R, WMS-R and AVLT norms for ages 56 through 97. Clinical Neuropsychology, 6, 1–104.
19. Folstein MF, Folstein SE, McHugh PR (1975) "Mini-mental state". A practical method for grading the cognitive state of patients for the clinician. J Psychiatr Res 12: 189–198. 0022-3956(75)90026-6 [pii]. PMID:1202204
20. Buysse DJ, Reynolds CF III, Monk TH, Berman SR, Kupfer DJ (1989) The Pittsburgh Sleep Quality Index: a new instrument for psychiatric practice and research. Psychiatry Res 28: 193–213. 0165-1781 (89)90047-4 [pii]. PMID:2748771
21. Johns MW (1991) A new method for measuring daytime sleepiness: the Epworth sleepiness scale. Sleep 14: 540–545. PMID:1798888
22. Hautzinger M (2006) Beck Depressions-Inventar (BDI-II), revised edn. Frankfurt: Harcourt.
23. Ausen B, Edman G, Almkvist O, Bogdanovic N (2009) Personality features in subjective cognitive impairment and mild cognitive impairment—early indicators of dementia? Dement Geriatr Cogn Disord 28: 528–535. 000255104 [pii];doi:10.1159/000255104PMID:20016183
24. Ganguli M, Du Y, Dodge HH, Ratcliff GG, Chang CC (2006) Depressive symptoms and cognitive decline in late life: a prospective epidemiological study. Arch Gen Psychiatry 63: 153–160. 63/2/153 [pii];doi:10.1001/archpsyc.63.2.153PMID:16461857
25. Potvin O, Lorrain D, Forget H, Dube M, Grenier S, Preville M et al. (2012) Sleep quality and 1-year inci-dent cognitive impairment in community-dwelling older adults. Sleep 35: 491–499. doi:10.5665/sleep. 1732PMID:22467987
26. Reisberg B, Shulman MB, Torossian C, Leng L, Zhu W (2010) Outcome over seven years of healthy adults with and without subjective cognitive impairment. Alzheimers Dement 6: 11–24. S1552-5260 (09)02327-9 [pii];doi:10.1016/j.jalz.2009.10.002PMID:20129317
28. Adam AM, Potvin O, Callahan BL, Bastien C, Lorrain D, Desjardins S et al. (2014) Subjective sleep quality in non-demented older adults with and without cognitive impairment. Int J Geriatr Psychiatry 29: 970–977. doi:10.1002/gps.4087PMID:24519731
29. Bixler E (2009) Sleep and society: an epidemiological perspective. Sleep Med 10 Suppl 1: S3–S6. S1389-9457(09)00246-9 [pii];doi:10.1016/j.sleep.2009.07.005PMID:19660985
30. Hayes TL, Riley T, Mattek N, Pavel M, Kaye JA (2013) Sleep Habits in Mild Cognitive Impairment. Alz-heimer Dis Assoc Disord. doi:10.1097/WAD.0000000000000010
31. Dlugaj M, Weinreich G, Weimar C, Stang A, Dragano N, Wessendorf TE et al. (2014) Sleep-disordered breathing, sleep quality, and mild cognitive impairment in the general population. J Alzheimers Dis 41: 479–497. L741433273323713 [pii];doi:10.3233/JAD-132132PMID:24643134
32. van der Helm E, Gujar N, Nishida M, Walker MP (2011) Sleep-dependent facilitation of episodic mem-ory details. PLoS One 6: e27421. doi:10.1371/journal.pone.0027421;PONE-D-11-14450 [pii]. PMID: 22114672
33. Shao Y, Lei Y, Wang L, Zhai T, Jin X, Ni W et al. (2014) Altered resting-state amygdala functional con-nectivity after 36 hours of total sleep deprivation. PLoS One 9: e112222. doi:10.1371/journal.pone. 0112222;PONE-D-14-03335 [pii]. PMID:25372882
34. Sexton CE, Mackay CE, Ebmeier KP (2013) A systematic review and meta-analysis of magnetic reso-nance imaging studies in late-life depression. Am J Geriatr Psychiatry 21: 184–195. S1064-7481(12) 00023-1 [pii];doi:10.1016/j.jagp.2012.10.019PMID:23343492
35. Zheng C, Zhang T (2015) Synaptic plasticity-related neural oscillations on hippocampus-prefrontal cor-tex pathway in depression. Neuroscience. S0306-4522(15)00139-6 [pii];doi:10.1016/j.neuroscience. 2015.01.071
36. Han Y, Lui S, Kuang W, Lang Q, Zou L, Jia J (2012) Anatomical and functional deficits in patients with amnestic mild cognitive impairment. PLoS One 7: e28664. doi:10.1371/journal.pone.0028664 ;PONE-D-11-15797 [pii]. PMID:22319555
37. Fotuhi M, Do D, Jack C (2012) Modifiable factors that alter the size of the hippocampus with ageing. Nat Rev Neurol 8: 189–202. nrneurol.2012.27 [pii];doi:10.1038/nrneurol.2012.27PMID:22410582 38. Keage HA, Banks S, Yang KL, Morgan K, Brayne C, Matthews FE (2012) What sleep characteristics
predict cognitive decline in the elderly? Sleep Med 13: 886–892. S1389-9457(12)00101-3 [pii];doi:10. 1016/j.sleep.2012.02.003PMID:22560827
39. Ferman TJ, Smith GE, Kantarci K, Boeve BF, Pankratz VS, Dickson DW et al. (2013) Nonamnestic mild cognitive impairment progresses to dementia with Lewy bodies. Neurology 81: 2032–2038. 01. wnl.0000436942.55281.47 [pii];doi:10.1212/01.wnl.0000436942.55281.47PMID:24212390 40. Roure N, Gomez S, Mediano O, Duran J, Pena ML, Capote F et al. (2008) Daytime sleepiness and
polysomnography in obstructive sleep apnea patients. Sleep Med 9: 727–731. S1389-9457(08)00051-8 [pii];doi:10.1016/j.sleep.2008.02.006PMID:18482866
41. Terpening Z, Lewis SJ, Yee B, Grunstein R, Hickie IB, Naismith SL (2015) Association between Sleep-Disordered Breathing and Neuropsychological Performance in Older Adults with Mild Cognitive Impairment. J Alzheimers Dis. 78222Q2384041176 [pii];doi:10.3233/JAD-141860
42. Ward AM, McLaren DG, Schultz AP, Chhatwal J, Boot BP, Hedden T et al. (2013) Daytime sleepiness is associated with decreased default mode network connectivity in both young and cognitively intact elderly subjects. Sleep 36: 1609–1615. doi:10.5665/sleep.3108PMID:24179292
43. Hita-Yanez E, Atienza M, Cantero JL (2013) Polysomnographic and subjective sleep markers of mild cognitive impairment. Sleep 36: 1327–1334. doi:10.5665/sleep.2956PMID:23997365
44. Tranah GJ, Blackwell T, Stone KL, Ancoli-Israel S, Paudel ML, Ensrud KE et al. (2011) Circadian activ-ity rhythms and risk of incident dementia and mild cognitive impairment in older women. Ann Neurol 70: 722–732. doi:10.1002/ana.22468PMID:22162057
45. Wang YP, Gorenstein C (2013) Assessment of depression in medical patients: a systematic review of the utility of the Beck Depression Inventory-II. Clinics (Sao Paulo) 68: 1274–1287.