www.atmos-chem-phys.net/15/2843/2015/ doi:10.5194/acp-15-2843-2015
© Author(s) 2015. CC Attribution 3.0 License.
Uplifting of carbon monoxide from biomass burning and
anthropogenic sources to the free troposphere in East Asia
K. Ding1,6, J. Liu1,2,6, A. Ding1,6, Q. Liu1,6, T. L. Zhao3, J. Shi4, Y. Han1, H. Wang5, and F. Jiang5 1School of Atmospheric Sciences, Nanjing University, Nanjing, Jiangsu 210093, China
2University of Toronto, Toronto, Ontario, M5S 3G3, Canada
3Nanjing University of Information Science and Technology, Nanjing, Jiangsu 210044, China 4Institute of Remote Sensing Applications, Chinese Academy of Sciences, Beijing 100101, China 5International Institute for Earth System Sciences, Nanjing University, Nanjing, Jiangsu 210093, China 6Collaborative Innovation Center of Climate Change, Jiangsu 210093, China
Correspondence to:J. Liu (jliu@nju.edu.cn)
Received: 2 September 2014 – Published in Atmos. Chem. Phys. Discuss.: 12 November 2014 Revised: 22 January 2015 – Accepted: 15 February 2015 – Published: 12 March 2015
Abstract. East Asia has experienced rapid development with increasing carbon monoxide (CO) emission in the past decades. Therefore, uplifting CO from the boundary layer to the free troposphere in East Asia can have great implications on regional air quality around the world. It can also influ-ence global climate due to the longer lifetime of CO at higher altitudes. In this study, three cases of high CO episodes in the East China Sea and the Sea of Japan from 2003 to 2005 are examined with spaceborne Measurements of Pollution in the Troposphere (MOPITT) data, in combination with air-craft measurements from the Measurement of Ozone and Water Vapor by Airbus In-Service Aircraft (MOZAIC) pro-gram. High CO abundances of 300–550 ppbv are observed in MOZAIC data in the free troposphere during these episodes. These are among the highest CO abundances documented at these altitudes. On average, such episodes with CO over 400 ppbv (in the 2003 and 2004 cases) and between 200 and 300 ppbv (in the 2005 case) may occur 2–5 and 10–20 % in time, respectively, in the respective altitudes over the region. Correspondingly, elevated CO is shown in MOPITT daytime data in the middle to upper troposphere in the 2003 case, in the lower to middle troposphere in the 2004 case, and in the upper troposphere in the 2005 case. Through analyses of the simulations from a chemical transport model GEOS-Chem and a trajectory dispersion model FLEXPART, we found dif-ferent CO signatures in the elevated CO and distinct trans-port pathways and mechanisms for these cases. In the 2003 case, emissions from large forest fires near Lake Baikal
dom-inated the elevated CO, which had been rapidly transported upward by a frontal system from the fire plumes. In the 2004 case, anthropogenic CO from the North China Plain expe-rienced frontal lifting and mostly reached ∼700 hPa near
1 Introduction
Carbon monoxide (CO) plays several important roles in the atmosphere. The oxidizing capability, an ability of the at-mosphere to cleanse itself, is strongly influenced by the CO level in the troposphere. CO near the surface is a major pol-lutant. Under high NOx conditions, CO is a precursor of ozone, while in low NOxair masses, CO helps ozone destruc-tion (Jacob, 1999; Holloway et al., 2000). As carbon dioxide (CO2)is produced in both ozone production and destruction processes (Holloway et al., 2000), CO is linked to the global carbon cycle (Suntharalingam et al., 2004; Yurganov et al., 2008; Nassar et al., 2010) affecting climate change. With a lifetime of weeks to months, CO is a good tracer tracking transport of pollution. In the purview of these roles, it is im-portant to understand processes influencing the CO distribu-tion and variability in the atmosphere.
Although the main sources of atmospheric CO and its mean status are generally understood (Novelli et al., 1998; Jacob, 1999; Holloway et al., 2000), many processes influ-encing CO variations at different timescales are not well known. Uplifting CO from the boundary layer to the free troposphere (FT) is such a process, which usually occurs on the synoptic scale that spans hundreds to thousands of kilometers in space and lasts hours to days in time (Daley, 1991). Uplifted CO usually has a longer lifetime and can be transported fast by the upper layer winds over long distances through continents and between hemispheres in the tropo-sphere (Stohl, 2001; Stohl et al., 2002; Damoah et al., 2004). Uplifting air mass from the surface to FT generally takes place by three processes: (1) frontal lifting, (2) orographic lifting, and (3) deep convection (Brown et al., 1984; Banic et al., 1986; Dickerson et al., 1987; Bethan et al., 1998; Pick-ering et al., 1998; Chung et al., 1999; Donnell et al., 2001; Kowol-Santen et al., 2001; Cooper et al., 2002; Liu et al., 2003; Miyazaki et al., 2003; Chan et al.; 2004; Mari et al., 2004; Li et al., 2005; Liu et al., 2006; Kar et al., 2008; Zhao et al., 2008; Ding et al., 2009; Randel et al., 2010; Chen et al., 2012).
East Asia has experienced rapid development with increas-ing CO emission in the past decades (Duncan et al., 2007). In addition to impacts on local air quality (Wang et al., 2010), continuing increase in CO emissions will lead to great im-pacts on regional air quality and climate of the world (Jaffe et al., 1999; Berntsen et al., 1999; Bertschi et al., 2004) because of an expected upward trend in pollution outflow from the region. East Asia is characterized by its unique and complex meteorology, topography, and land covers. Vertical transport of CO can be modulated by one or more of these conditions or by their interactions. For example, the likelihood of when and where extratropical cyclones are active is closely linked to the locations and frequency of frontal uplifting. Wet and dry convections prevail in different seasons in northern China because of the distinct climatological pattern in precipita-tion there (Dickerson et al., 2007). The topography there also
plays an important role in uplifting of CO alone and/or inter-playing with frontal systems, aiding convection in mountain-ous regions (Liu et al., 2003; Ding et al., 2009). Recently, Lin et al. (2009) proposed a new mechanism that emphasizes the role of topography-induced lee-side troughs over Indochina in promoting strong convection. A variety of land cover types in East Asia diversifies CO sources there. In highly populated urban areas, such as those in the North China Plain, anthro-pogenic emissions are high. Large biomass burning, occur-ring in areas with abundant vegetation, can generate great amounts of CO for vertical transport when meteorological conditions become favorable. Two such areas are Southeast Asia and the boreal forested area in Russia (Wotawa et al., 2001; Schultz, 2002; Duncan et al., 2003). So far, our under-standing of the impacts of these processes and their interac-tions on CO uplifting is still rather limited (Dickerson et al., 2007). The objectives of studying vertical transport of CO in East Asia are to better understand the vertical distribution of CO in the region, to advance the assessment of impacts of long-range transport of Asian CO on regions downwind, and to help improve simulating this process in atmospheric models on the synoptic scale, eventually leading to more re-alistic chemical weather forecast in the future (Lawrence et al., 2003).
the respective weather systems. Furthermore, the MOPITT data in new versions that use both thermal-infrared (TIR) and near-infrared (NIR) radiances have offered enhanced vertical sensitivity (Worden et al., 2010; Deeter et al., 2012, 2013). Therefore, a detailed examination of MOPITT’s vertical sen-sitivity in East Asia, especially for its ability in detecting ver-tical transport of high CO episodes, is desirable.
In this study, three cases of high CO episodes in East Asia from 2003 to 2005 are examined with MOPITT satellite data, in combination with aircraft measurements from the Mea-surement of Ozone and Water Vapor by Airbus In-Service Aircraft (MOZAIC) program (Marenco et al., 1998) (see Sects. 2 and 4). The vertical transport mechanisms are an-alyzed with simulations from a trajectory dispersion model FLEXPART (Stohl et al., 2005) and a chemical transport model GEOS-Chem (Bey et al., 2001), along with other me-teorology data and satellite fire data (see Sects. 2 and 4). MOPITT data are analyzed in two ways. First, the verti-cal sensitivity of MOPITT is evaluated with the coincident MOZAIC data (see Sect. 3) and further illustrated with the three high CO episodes in comparison with the MOZAIC data (see Sect. 4). Second, the vertical variation in CO cap-tured by MOPITT is used to diagnose vertical transport of CO (see Sect. 4). Discussion on the three cases is synthe-sized in Sect. 5 and the major conclusions are provided in Sect. 6.
2 Model and data
2.1 Satellite MOPITT CO data
MOPITT is the first space instrument that targets continu-ous measurements of tropospheric CO. MOPITT has been onboard of the Terra satellite since 1999, making scientific measurements since March 2000. Terra is flying in a sun syn-chronous polar orbit with an altitude of 705 km, crossing the equator at∼10:45 and 22:45 LT and making 14–15 daytime
and nighttime overpasses each day. MOPITT uses a cross-track scanning method with a swath of 29 pixels (4 pixels in a row), each pixel being 22 km×22 km. Therefore, with a
swath of∼600 km, about one-third of the global area is
cov-ered in a day. Additionally, clouds can cause even more gaps in MOPITT daily data. This makes it challenging to use MO-PITT data for synoptic studies. It takes 3 days to achieve a near-complete global coverage (Edwards et al., 1999) assum-ing no blockage from clouds.
MOPITT measures upwelling radiation in two narrow in-frared spectral regions for CO retrieval: (1) a TIR band near 4.7 µm that has strong carbon monoxide absorption and (2) a NIR band near 2.3 µm that has weak CO absorption. MO-PITT Version 5 retrieval products are significantly differ-ent from earlier products and offer three distinct products depending on application requirements. One of them is a TIR/NIR multispectral product, which has enhanced
sensi-tivity to CO in the lower-most troposphere (Worden et al., 2010; Deeter et al., 2012, 2013). Validations and evalua-tions of MOPITT data in various versions are documented in Emmons et al. (2004), Worden et al. (2010), and Deeter et al. (2012, 2013).
In this study, the MOPITT CO profiles (Level 2 data) were first compared with the coincident MOZAIC profiles. Advances of Version 5 (V5, a TIR/NIR multispectral prod-uct) from Version 4 (V4, a TIR-only prodprod-uct) data were as-sessed. Then, the V5 data were used in the case studies, in which MOPITT Level 2 data were gridded horizontally into 0.25◦latitude×0.25◦longitude bins and vertically at the
MOPITT resolution of 100 from the surface to 100 hPa.
2.2 Aircraft MOZAIC CO data
The MOZAIC program was initiated in 1993 by European scientists, aircraft manufacturers, and airlines to collect ex-perimental data (Marenco et al., 1998). MOZAIC consists of automatic and regular measurements of ozone, CO, and water vapor by several long-range passenger airliners flying all over the world. The aim is to build a large database of measurements to allow studies of chemical and physical pro-cesses in the atmosphere.
In comparing MOPITT with MOZAIC CO data, coinci-dent MOPITT and MOZAIC data from 2003 to 2005 were screened within a radius of 1.5◦ and within a 4 h period. The radius of 1.5◦ was applied to selected MOZAIC pro-files at 500 hPa and the MOZAIC slant path was included in the radius. MOZAIC profile was smoothed by applying the MOPITT averaging kernels and the a priori profile for the co-located retrieved MOPITT profile to account for the bias introduced by the averaging kernels and the a priori. There-fore, the smoothed MOZAIC CO profilexˆMOZAICis derived
by (Rogers, 2000)
ˆ
xMOZAIC=xMOPITT+A(xMOZAIC−xMOPITT
a ), (1)
whereA=δxˆ/δx is the MOPITT averaging kernel matrix
which describes the sensitivity of the MOPITT CO estimate to the true profile of CO,xMOZAICis the MOZAIC CO
pro-file, which has been mapped to the MOPITT pressure grid. The quantityxMOPITT
a is the MOPITT a priori, which is based on CO simulations from the MOZART model (Emmons et al., 2004).
2.3 MODIS fire count data
The Moderate-resolution Imaging Spectroradiometer (MODIS) is the type of instrument which has been onboard of the Terra (EOS AM) satellite since 1999 and on the Aqua (EOS PM) satellite since 2002. The MODIS fire products include a validated daily global active fire product (MOD14 Terra and MYD14 Aqua) (Justice et al., 2002), generated using a global active fire detection algorithm that uses a multispectral contextual approach to exploit the strong emission of mid-infrared radiation from fires allowing subpixel fire detection (Giglio et al., 2003). The horizontal resolution is 1 km. The fire data are acquired from the Fire Information for Resource Management System (FIRMS) (Davies et al., 2009).
2.4 NCEP FNL meteorological data
The National Centers for Environmental Prediction (NCEP) final (FNL) global tropospheric analyses are on 1◦×1◦grids
every 6 h (http://rda.ucar.edu/datasets/ds083.2/). Parameters in FNL include surface pressure, sea level pressure, geopo-tential height, temperature, sea surface temperature, poten-tial temperature, relative humidity (RH), precipitable water,
uandvwinds, and vertical motion, available on the surface, at 26 levels from 1000 to 10 hPa, the tropopause, the bound-ary layer, and a few others. In addition to driving FLEXPART (see Sect. 2.5), the FNL data are used to analyze the meteoro-logical conditions including the surface pressure, wind fields, and development of a cyclone. The data are generated from the global data assimilation system (GDAS).
2.5 The FLEXPART trajectory model
To diagnose the transport processes and trace CO sources, we used the FLEXPART model (Stohl et al., 2005), which is a Lagrangian Particle Dispersion Model developed at the Nor-wegian Institute for Air Research in the Department of At-mospheric and Climate Research. FLEXPART can be driven by meteorological input data generated from a variety of global and regional models. In this study, the simulations were driven by the NCEP FNL data. This model has been extensively validated (Stohl et al., 1998; Cristofanelli et al., 2003) and widely used in studies of the influence of various meteorological processes on pollution transport (Cooper et al., 2004, 2005, 2006; Hocking et al., 2007; Ding et al., 2009; Barret et al., 2011; He et al., 2011; Chen et al., 2012). In run-ning FLEXPART, a large number of particles are released from defined locations (latitude, longitude, and altitude) at a time. Backward or forward trajectories of the particles are recorded in latitude (◦), longitude (◦), and altitude (km) every hour.
2.6 The GEOS-Chem chemical transport model GEOS-Chem is a global three-dimensional chemical trans-port model (http://geos-chem.org). The model contains detailed description of tropospheric O3-NOx-hydrocarbon chemistry, including the radiative and heterogeneous effects of aerosols. It is driven by assimilated meteorological obser-vations from the National Aeronautics and Space Adminis-tration (NASA) Goddard Earth Observing System (GEOS) from the Global Modeling and Assimilation Office (GMAO). In this study, GEOS-Chem version v9-1-3 was employed and executed in the full chemistry mode, which is driven by GEOS meteorology with temporal resolution of 6 h (3 h for surface meteorological variables), with a horizontal resolu-tion of 2◦latitude by 2.5◦longitude and 47 vertical levels, in-cluding∼35 levels in the troposphere from 1000 to 100 hPa.
GEOS-Chem uses anthropogenic emissions from the Emissions Database for Global Atmospheric Research (EDGAR) global inventory (Olivier and Berdowski, 2001), which are updated with regional inventories, including the emission inventory in Asia (Streets et al., 2006; Zhang et al., 2009). The biomass burning emissions are from the Global Fire Emissions Data (GFEDv3) monthly inventories (van der Werf et al., 2010) and biogenic volatile organic compound (VOC) emissions are taken from the Model of Emissions of Gases and Aerosols from Nature (MEGAN) global inventory. Emissions from other natural sources (e.g., lightning, volca-noes) are also included.
The model has been extensively evaluated and used in studies of atmospheric chemistry and pollution transport (Bey et al., 2001; Heald et al., 2003; Liu et al., 2003, 2006; Zhang et al., 2006; Jones et al., 2009; Nassar et al., 2009; Kopacz et al., 2010; Jiang et al., 2011). GEOS-Chem can generally describe CO variability in the troposphere but somewhat underestimate the observations in the northern mid-latitudes possibly due to biases in the CO inventory or numerical diffusion in the model or both (Heald et al., 2003; Duncan et al., 2007; Nassar et al., 2009; Kopacz et al., 2010).
3 Comparison between MOPITT and MOZAIC CO profiles
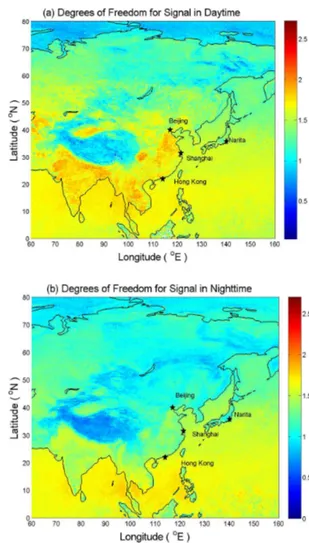
the averaging kernel matrix (Rogers, 2000). Figure 1 shows a yearly mean of DFS for daytime and nighttime, respectively, in East Asia for the V5 TIR/NIR data, indicating substan-tial increases in DFS compared to earlier MOPITT versions (Worden et al., 2010; Deeter et al., 2012). The daytime an-nual mean DFS in East Asia (Fig. 1a) ranges from 0.5 to 2.7, usually decreasing with latitude, similar to its distribu-tion in other regions and on the global scale (Deeter et al., 2004; Worden et al., 2010). In the same latitudinal zones, the DFS is higher over land than over ocean. The daytime annual mean DFS is high in the Sichuan Basin, the eastern part of mainland China, the Indochina peninsula, and the In-dian subcontinent. Over the mountain or valley regions, DFS is low, such as above the Tibetan Plateau. The stars indicate the cities where MOZAIC vertical measurements are avail-able for validation of MOPITT data. The annual mean DFS is 1.65, 1.51, 1.60, and 1.64, respectively, in an area of 1◦×1◦ around Beijing, Narita, Shanghai, and Hong Kong, with a maximum of 1.98, 1.64, 1.81, and 1.74 for the cities, respec-tively. The nighttime DFS values (Fig. 1b) are lower (from 0.5 to 1.5) than the daytime values, similar to that in Deeter et al. (2004) for an earlier MOPITT version. Spatially, night-time DFS is high over regions where the daynight-time DFS is also high.
The general patterns of MOPITT averaging kernels have been documented (Pan et al., 1998; Emmons et al., 2004; Deeter et al., 2003, 2004, 2012; Kar et al., 2008; Worden et al., 2010). For V5 MOPITT data, the averaging kernels at the four cities are similar to these in Worden et al. (2010, in their Fig. 7). The difference in the averaging kernels between V4 and V5 can be as large as 0.14 in the surface and lower tro-posphere and as 0.10 in the upper trotro-posphere (not shown).
Figure 2 shows the relative bias between MOPITT and the smoothed MOZAIC (xˆMOZAIC)profiles (see Eq. 1), which
is also referred to as the “MOPITT estimate of in situ” in Worden et al. (2010) and the “transferred profile” in Em-mons et al. (2004). For V5 data (in red), the mean bias is within±20 % for all the cities. In all the altitude levels, the
bias is the smallest (close to zero) around 500–400 hPa and increases upward and downward. The bias is mostly posi-tive above 500–400 hPa, while below 500–400 hPa, it is pos-itive at Beijing and Narita but negative at Shanghai and Hong Kong. Whether the sign change is related to the change in the geographic location (Shanghai and Hong Kong are both coastal cities) can be a subject for further study. The V4 data (in green) also show the smallest bias in the middle tropo-sphere. In the lower troposphere, the bias in V5 is reduced by 5–10 % at Beijing and Narita. At Shanghai, the bias changes from positive in V4 to negative in V5, with a smaller magni-tude, while at Hong Kong, the negative bias in V4 becomes larger in magnitude in V5. In the upper troposphere above 500–400 hPa, the bias in V5 at Beijing, Narita, and Shang-hai changes to positive, with a magnitude similar to or larger than that in V4. At Hong Kong, the bias in V5 remains posi-tive but the magnitude is enlarged. Deeter et al. (2013)
com-Figure 1.The degree of freedom for signal (DFS) of the MOPITT V5 TIR/NIR data over East Asia, averaged for 2005 during(a)
day-time and(b)nighttime. Locations of four cities with MOZAIC CO
measurements are indicated as stars. Note that the MOZAIC CO data from Narita also include a small portion of measurements from its surrounding cities at Osaka and Nagoya.
!!! "!! #!! $!! %!!
&'())*'(+,-&./
0$! 01! 0%! 0 ! ! ! %! 1! $! !!! "!! #!! $!! %!!
0$! 01! 0%! 0 ! ! ! %! 1! $!
!!! "!! #!! $!! %!!
&'())*'(+,-&./
0$! 01! 0%! 0 ! ! ! %! 1! $! 23.)+,4/
!!! "!! #!! $!! %!!
0$! 01! 0%! 0 ! ! ! %! 1! $! 23.)+,4/
2(35367 8.'39.
:;67+<;67 =-.67-.3
,./ ,>/
,?/ ,@/
+AB +A$
Figure 2.Relative bias of CO profiles (in %) between MOPITT and MOZAIC data (smoothed with the MOPITT averaging kernels; see Eq. 1) from 2003 to 2005 at Beijing, Narita, Shanghai, and Hong Kong for MOPITT V4 and V5 data. The number of profiles for the comparison is 18, 23, 11, and 15, respectively, at Beijing, Narita, Shanghai, and Hong Kong. The error bars indicate the interquartile range of the mean.
Figure 3.Correlation between MOPITT and MOZAIC data (smoothed with the MOPITT averaging kernels, see Eq. 1) from 2003 to 2005 at Beijing, Narita, Shanghai, and Hong Kong(a)from the middle to upper troposphere and(b)from the surface to the middle troposphere.
The correlation between MOPITT and smoothed MOZAIC data is shown in Fig. 3. From 500 to 100 hPa, the correlation coefficient between the two data sets is 0.92, 0.86, 0.83, 0.68 at Beijing, Narita, Shanghai, and Hong Kong, respectively (Fig. 3a), while from the surface to 600 hPa, the correlation becomes stronger, being 0.90,0.92, 0.92, 0.94 at Beijing, Narita, Shanghai, and Hong Kong, respectively (Fig. 3b). The correlation coefficient between the two data is best in the middle troposphere (500–400 hPa, not shown).
4 Uplifting of CO to the free troposphere
Daily MOPITT and MOZAIC data from 2003 to 2005 were screened to find cases of high CO episodes observed by both MOPITT and MOZAIC at the same location and time. We found three cases of high CO in MOPITT data with close-by MOZAIC measurements, while it was hard to find such high CO episodes with exact coincident MOPITT and MOZAIC observations because of large gaps in MOPITT data and lim-ited aircraft sampling coverages. In the three cases, high CO concentrations up to 300–500 ppbv were observed by MOZAIC in the free troposphere from 750 to 250 hPa.
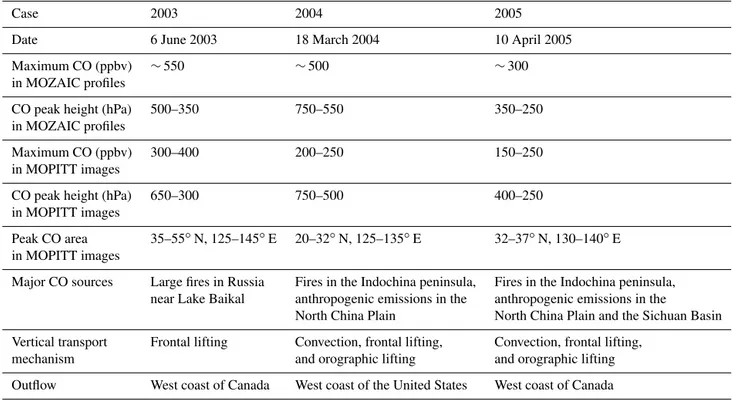
oc-Table 1.Characterization of the three cases.
Case 2003 2004 2005
Date 6 June 2003 18 March 2004 10 April 2005
Maximum CO (ppbv) ∼550 ∼500 ∼300
in MOZAIC profiles
CO peak height (hPa) 500–350 750–550 350–250
in MOZAIC profiles
Maximum CO (ppbv) 300–400 200–250 150–250
in MOPITT images
CO peak height (hPa) 650–300 750–500 400–250
in MOPITT images
Peak CO area 35–55◦N, 125–145◦E 20–32◦N, 125–135◦E 32–37◦N, 130–140◦E
in MOPITT images
Major CO sources Large fires in Russia Fires in the Indochina peninsula, Fires in the Indochina peninsula,
near Lake Baikal anthropogenic emissions in the anthropogenic emissions in the
North China Plain North China Plain and the Sichuan Basin
Vertical transport Frontal lifting Convection, frontal lifting, Convection, frontal lifting,
mechanism and orographic lifting and orographic lifting
Outflow West coast of Canada West coast of the United States West coast of Canada
curred over the East China Sea or the Sea of Japan or both. High CO was shown in MOPITT daytime data in the mid-dle to upper troposphere in case 2003, in the lower to midmid-dle troposphere in case 2004, and in the upper troposphere in case 2005. The MOPITT and MOZAIC observations for the three cases are shown in Figs. 4–6, followed by analyses for each case with FLEXPART and GEOS-Chem simulations, in combination with MODIS fire data and NCEP FNL meteoro-logical data. The cases occurred in spring and summer when cyclone activities are strong in East Asia (Chen et al., 1991; Yue and Wang, 2008). The main CO sources are identified as biomass burning or a combination of biomass burning and anthropogenic origins. The outflow of the high CO episodes finally reached the boundary layer at the west coast of the United States and Canada.
4.1 Case study I: 6 June 2003
On 6 June 2003, a large area (∼400 km×1500 km) of high
CO up to 350 ppbv appeared in the MOPITT image over the Sea of Japan and the nearby continent in the middle to high troposphere (Fig. 4a). In Fig. 5a, the MOPITT CO pro-file averaged over the boxed area in Fig. 4a shows a broad enhancement from the monthly profile between 650 and 300 hPa, with peak CO abundances of ∼300 ppbv around
550 hPa. The location and shape of the box was selected to ensure enough MOPITT samplings (> 30) at the clos-est upwind direction of MOZAIC measurements (the same for Fig. 4b and c). The large difference between the MO-PITT a priori and the measurements over these altitudes
in-dicates MOPITT’s capability of detecting pollution episodes with some degree of vertical sensitivity. The vertical sensi-tivity is demonstrated through (1) the strongest CO source among the three cases was shown as the largest magnitude (200–250 ppbv) of elevated CO from the a priori, (2) the altitude with the maximum CO enhancement was detected around the middle troposphere, in contrast to the other two cases which show the maximum in the lower-middle and up-per troposphere, respectively, and (3) the elevated CO was over a broad range of altitudes as the vertical resolution of MOPITT is rather coarse, i.e., the annual mean DFS max-imizes about 2.5 (Fig. 1). This CO peak was not shown in the MOPITT monthly mean profile, reflecting the episodic nature of this event. The high CO episode was also detected by a near-by MOZAIC measurement (Fig. 5b). A layer of elevated CO is apparent between 500 and 350 hPa, with a CO peak up to∼550 ppbv around 400 hPa. In addition, the
MOZAIC relative humidity and ozone profiles are shown in Fig. 5b. Around the altitudes of CO buildup, elevated humid-ity followed the CO profile, while ozone also showed some enhancement.
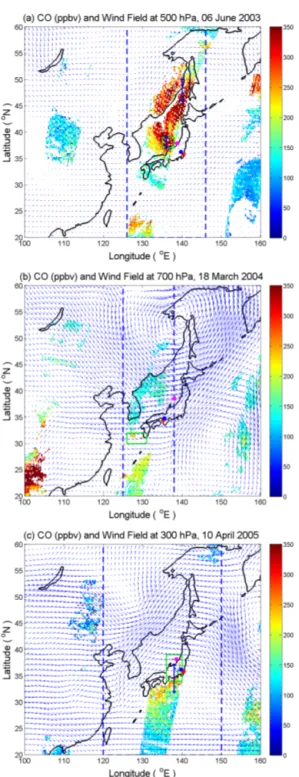
Figure 4.MOPITT CO mixing ratio (ppbv, in color)(a)on 6 June
2003 at 500 hPa,(b)on 18 March 2004 at 700 hPa, and(c)on 10
April, 2005 at 300 hPa. All are overlaid with horizontal winds (in arrows) at the same altitude. In each subfigure, the locations of MOZAIC data at 900, 600, and 300 hPa are indicated as red, blue and pink dots, respectively. The box indicates an area over which mean MOPITT CO profile is taken and displayed in Fig. 5. The box is selected to ensure enough MOPITT samplings at the closest upwind direction of MOZAIC measurements. The two blue dashed lines define the longitudinal zone, over which the CO abundances were averaged and shown in Fig. 6. The solid blue bars in Fig. 4a and c indicate the locations where particles were released and back-ward trajectories were simulated using FLEXPART (see text for de-tail).
Figure 5.Profiles of MOPITT CO and the a priori, averaged over the corresponding boxed area in Fig. 4 on(a)6 June 2003,(c)18 March 2004, and(e)10 April 2005, respectively, along with their monthly mean MOPITT CO profile over the same area. The cor-responding MOZAIC CO profiles (along the dots in Fig. 4) on the same day are shown in(b),(d), and(f), respectively. The corre-sponding MOZAIC ozone and relative humidity profiles are also
shown in(b),(d), and(f). Note that the smoothed MOZAIC CO
profiles (MOZAIC CO(s)) were calculated using the averaging ker-nels and the a priori in the boxed area in each case (see Sect. 5 for discussion).
Figure 6.A latitude–altitude cross section of MOPITT CO
aver-aged between the two blue dashed lines in Fig. 4 on (a)6 June
2003,(b)18 March 2004, and(c)10 April 2005. The contour lines indicateUwind speed (m s−1). Vectors are for wind directions in
V andW. For a better illustration,Wis enlarged by a factor of 100. The pink box(es) in(a)and(c)indicate the locations where parti-cles were released and backward trajectories were simulated using FLEXPART (see text for detail).
was high in the MOPITT data. Because CO has a relatively long lifetime (weeks to months), it is assumed that CO is not removed in the backward trajectories. Figure 7 shows the distribution of particle concentration between 6.25 and 10.25 (∼500–250 hPa, Fig. 7a) and between 0 and 3.25 km
(∼1000–650 hPa, Fig. 7b). The contour lines indicate the
geopotential height at 850 hPa at 12:00 UTC on 3 June 2003
Figure 7. (a) Particle distribution between 6.25 and 10.25 km (∼550–250 hPa) during 1–6 June 2003. The particles were released from two locations (in pink lines) around 400 hPa (also see Figs. 4a and 6a) on 6 June 2003 and backward trajectories were calculated. The contour lines are the geopotential heights at 850 hPa on 3 June 2003. A cold front and a warm front are indicated by green and red lines, respectively.(b)the same as(a), but between 0 and 3.5 km. The contour lines are the geopotential heights at 850 hPa on 2 June 2003. The circles, diamonds, and stars denote daily mean fire counts of 20–100, 100–300, and 300–500 per 2.5◦×2.5◦grid area, respec-tively, from 31 May to 6 June.
(Fig. 7a) and at 00:00 UTC on 2 June 2003 (Fig. 7b), respec-tively. The locations of large forest fires near Lake Baikal from MODIS fire data are indicated in Fig. 7b by the stars, diamonds, and circles, with fire counts of 20–100, 100–300, and 300–500 per 2.5◦×2.5◦grid area, respectively, averaged
daily from 31 May to 6 June. The high particle counts be-tween 0 and 3 km in the vicinity of Lake Baikal match well with the location of fire counts (Fig. 7b). On 3 June 2013, there was a cyclone with a cold front (Fig. 7a) that rapidly lifted the CO originated from the fires along the warm con-veyer belt (WCB) to the upper level. The particle distribution in the upper troposphere shows the transport pathway of the particles to the Sea of Japan. To further illustrate this, parti-cles were released from the fire region near Lake Baikal (93– 115◦E, 50–60◦N, 0–3 km, following Lavoué et al. (2000), who found an average injection height of Siberian fires of
resul-Figure 8.Vertical distribution of particles, varying with time from 1 June 2003 at 00:00 UTC to 15 June 2003 at 00:00 UTC. The particles were released from fire regions in Fig. 7b from the surface to 3 km on 1 June 2003 and forward trajectories were calculated (14 days). The forward time (in h) and date (in June) are indicated in thexaxis on the bottom and the top, respectively.
tant vertical distribution of the particles, varying with time during 1–15 June 2003, is shown in Fig. 8. The released par-ticles from the fires traveled along the isobars to northeast of Lake Baikal from 1 June to 3 June 2003 and then the par-ticles were lifted to the upper layers (2–5 km) starting on 3 June at 12:00 LT (in 60–70 h) (Fig. 8). Then, the particles were transported further upward and eastward. On 6 June (in 120–140 h), a large amount of particles appeared in a layer of 3–8 km (Figs. 8 and 4a). The altitudes with high particle concentrations agree well the MOPITT data between 650 and 350 hPa (Figs. 4a and 6a).
It is the cyclone with a front northeast of Lake Baikal that transported the CO up along the WCB (Figs. 7a and 8). Fig-ure 5b shows that the relative humidity reached about 65 % in the MOZAIC measurement, suggesting the air mass in-deed came from a WCB (Cooper et al., 2002). The MOZAIC ozone profile also shows elevated ozone at the same altitudes but the shape does not exactly follow the ones of CO and hu-midity, implying complexity of chemical processes involved. The polluted air reached as high as 9 km although most parti-cles remained at heights of about 3–8 km (Fig. 8). After being lifted to higher altitudes, the polluted air was transported by strong westerlies over long distances. Figure 8 shows that the particles were further transported to the east and sink slowly after 7 June. Around 14 June 2003, the particles reached the east coast of Canada (0–5 km). The satellite MODIS data show a large number of hot spots near Lake Baikal in May and June 2003. Earlier studies have shown that forest fires in Asia can impact air quality in North America (Jaffe et al., 2004; Liang et al., 2004; Oltmans et al., 2010). This case illustrates again the role that WCBs played in the interconti-nental transport of pollution for such high CO. Notice that the
FLEXPART simulation was made by using the FNL meteo-rological data, which may not have considered the buoyancy force due to fires. Such buoyancy force can lift CO plumes even faster and higher.
Our analyses are consistent with Nédélec et al. (2005), who examined 320 MOZAIC flight routes from Europe to Asia in 2003 and reported the observations of high CO up to 800 ppbv above 8 km (∼350 hPa) on 3 and 4 June 2003
around 57◦N (northeast of Lake Baikal). With different data sets, i.e., along-track scanning radiometer (ATSR) fire data, the Total Ozone Mapping Spectrometer (TOMS) aerosols data, and the MODIS cloud data, Nédélec et al. (2005) also attributed the high CO at these altitudes to front lifting of CO from large forest fires near Lake Baikal. The time and loca-tion of frontal lifting of CO in our FLEXPART simulaloca-tions match well with the observations of high CO by Nédélec et al. (2005). Furthermore, this study provides a more explicit description on the CO transport pathways (Figs. 7 and 8). We also found this rare case demonstrate MOPITT’s capa-bility of detecting extreme high CO episodes through rela-tive variations in vertical and horizontal dimensions. Corre-sponding to the strongest CO source among the three cases, MOPITT data showed the largest horizontal area with CO plumes (Fig. 4), the deepest vertical CO buildup with the highest abundances (Fig. 6), and the biggest enhancement of 200–250 ppbv from the a priori (Fig. 5).
4.2 Case study II: 18 March 2004
This case occurred on 18 March 2004 when high CO ap-peared in the MOPITT data in the lower and middle tropo-sphere over the East China Sea (Fig. 4b). The elevated CO of 200–250 ppbv is observed between 750 and 550 hPa ver-tically in MOPITT data (Fig. 5c). The departure of the MO-PITT CO profile from its a priori reflects the MOMO-PITT’s ver-tical sensitivity (Fig. 5c). The MOPITT monthly mean, like for the other two cases, follows a typical CO profile pattern with CO concentrations being the highest near the surface and decreasing gradually with altitude. The CO on 18 March 2004 was 50 ppbv higher than the monthly mean above 800 hPa. A layer of elevated CO appeared in the MOZAIC profile between 750 and 550 hPa with a peak of 500 ppbv around 650 hPa (Fig. 5d). The high RH (∼90– 100 %) below
600 hPa in the MOZAIC data suggests that the air mass ex-perienced some uplifting process that enhanced its humidity, likely from a WCB. The MOZAIC ozone peaked (∼70 ppbv) around the same altitudes as CO, implying that ozone may be produced in the air mass carrying high CO during the trans-port process. Figure 6b shows a latitude–altitude cross sec-tion averaged between the two blue dashed lines in Fig. 4b. Around 30◦N, elevated CO levels (∼200 ppbv) are evident
around 700 hPa.
north-Figure 9.MOPITT CO mixing ratio at 700 hPa from 11 to 19 March 2004, overlaid with the geopotential height at 850 hPa on 17 March 2004 in blue contour and with a front shown by a brown solid line. The large and small stars denote daily mean fire counts of 100–200 and over 200 per 2.5◦×2.5◦grid area during the period, tively. L and H indicate a low and high pressure system, respec-tively.
ern Indochina peninsula to be a source for the observed high CO (Fig. 9). The time series of fire counts over area of 20–25◦N and 92–105◦E peaked on 12 March 2004. Corre-spondingly, high CO of∼300 ppbv appeared in the MOPITT
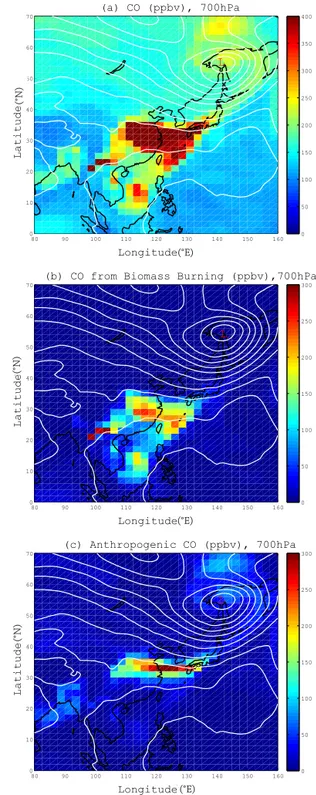
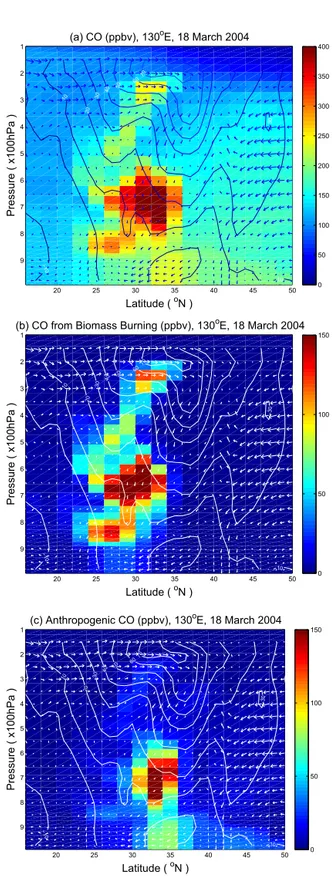
composite of 11–18 March 2004 at 700 hPa over northern Indochina peninsula (Fig. 9). This source was also recog-nized in the GEOS-Chem simulation (Fig. 10b). In addition, the anthropogenic source concentrated over the North China Plain (approximately 30–40◦N, 110–125◦E) was identified as another source (Fig. 10c). The fire-induced CO spread larger areas from south to north than the anthropogenic CO. Figure 11 shows the latitude–altitude cross sections of the GEOS-Chem simulations of CO, fire-induced CO, and an-thropogenic CO, respectively, along 130◦E on 18 March 2004. CO abundances from both sources were high around 700 hPa (Fig. 11b and c) between 25 and 35◦N across 130◦E where MOPITT also observed high CO (Fig. 6b).
The different CO distributions for the two sources in three dimensions (Figs. 10 and 11) reflect rather different trans-port pathways and uplifting mechanisms. We found that the transport of the fire-induced CO can be divided into four processes. First, the CO was orographically lifted along the Hengduan Mountains from the surface to ∼750 hPa. The lifted CO is shown in Fig. 12 around 100◦E on a longitude– altitude cross section along 22◦N. Then, the uplifted CO experienced two separate transports. In the second process, part of the lifted CO was further transported upward to 400– 300 hPa, shown as a bulb in Fig. 12 around 105◦E. This is due to strong convection, possibly caused by a frontal sys-tem developed on 17 March 2004 (Fig. 9), and interplay with the lee-side troughs east of the Hengduan Mountains.
80 90 100 110 120 130 140 150 160 0
10 20 30 40 50 60 70
Longitude ( oE )
Latitude (
oN )
(a) CO (ppbv), 700hPa
0 50 100 150 200 250 300 350 400
L
80 90 100 110 120 130 140 150 160 0
10 20 30 40 50 60 70
Longitude ( oE )
Latitude (
oN )
(b) CO from Biomass Burning (ppbv), 700hP
0 50 100 150 200 250 300
L
80 90 100 110 120 130 140 150 160 0
10 20 30 40 50 60 70
Longitude ( oE )
Latitude (
oN )
(c) Anthropogenic CO (ppbv), 700hPa
0 50 100 150 200 250 300
L
(c) Anthropogenic CO (ppbv), 700hPa
(°E)
(°E)
(°E)
(°N)
(°N)
(°N)
Figure 10. (a)CO,(b)CO from biomass burning, and(c)CO from the anthropogenic source on 17 March 2004 at 00:00 UTC, simu-lated by GEOS-Chem. The geopotential height at 700 hPa is indi-cated with white contours. L indicates a low pressure system.
20 25 30 35 40 45 50 1 2 3 4 5 6 7 8 9
Latitude ( oN )
Pressure ( x100hPa )
(a) CO (ppbv), 130oE, 18 March 2004
−10 0 0 10 10 20 30 30 40 50 60 70 0 50 100 150 200 250 300 350 400
20 25 30 35 40 45 50
1 2 3 4 5 6 7 8 9
Latitude ( oN )
Pressure ( x100hPa )
(b) CO from Biomass Burning (ppbv), 130oE, 18 March 2004
−10 0 0 10 10 20 30 30 40 50 60 70 0 50 100 150
20 25 30 35 40 45 50
1 2 3 4 5 6 7 8 9
Latitude ( oN )
Pressure ( x100hPa )
(c) Anthropogenic CO (ppbv), 130oE, 18 March 2004
−10 0 0 10 10 20 30 30 40 50 60 70 0 50 100 150
Figure 11.Latitude–altitude cross sections along 130◦E of(a)CO,
(b) CO from biomass burning, and (c)anthropogenic CO on 18
March 2004 at 00:00 UTC, simulated by GEOS-Chem. The contour lines indicateUwind speed (m s−1). Vectors are for wind directions inV andW. For a better illustration,W is enlarged by a factor of 100.
80 90 100 110 120 130 140 150 160
100 200 300 400 500 600 700 800 900 1000
Longitude ( oE )
Pressure ( hPa )
CO (ppbv), 22oN, 17 March 2004, 06 UTC
0 500 1000 1500
Figure 12.A longitude–altitude cross section of CO along 22◦N on 17 March 2004 at 06:00 UTC, simulated by GEOS-Chem. The topography of the Hengduan Mountains is indicated in white.
All of these suggest that the strong convection over the lee-side troughs rapidly lifted CO up to∼350 hPa. In fact, the
orographic lifting and topography-induced convection are quite common in this region; therefore, high CO often ap-pears at these two altitudinal levels in March as simulated by GEOS-Chem (not shown). On 17 March, the lifted CO was with even higher concentrations (∼500 ppbv) around
400 hPa than the monthly mean because of its fire origin and the presence of the lee-side troughs. In the third process, the uplifted CO around 400–300 hPa (near 105◦E in Fig. 12) was transported northeastward by strong winds along the front in the upper troposphere, reaching the East China Sea (near 30◦N, 130◦E) on 18 March. This transport enables high CO from forest fires in southern Asia in low latitudes to rapidly reach the upper troposphere in the mid-latitudes. In the fourth process, paralleling to the second and third, part of the oro-graphically uplifted CO was afloat around∼700 hPa because
The Hengduan Mountains run mainly north to south, with elevations ranging from 1300 to 6000 m. This topography provides a favorable condition for the formation of the lee-side troughs if meteorology is satisfied. Such troughs pro-mote vertical transport of CO on the east side of the moun-tains (in the second and fourth processes), while the oro-graphic lifting occurred on the west side of the mountains (in the first process). The lee-side troughs occur most and least frequently in spring and summer, respectively. Interan-nual variation of the lee-side troughs is also observed.
Comparison of the vertical CO distributions between MO-PITT and GEOS-Chem (Fig. 6b vs. Fig. 11a) suggests that MOPITT can generally capture vertical transport of CO from forest fires and anthropogenic sources, although the magni-tude of CO in MOPITT data was lower and there were also substantial gaps in the MOPITT images due to convective clouds. In the MOPITT data, high CO of∼200 ppbv reached up to 200 hPa. In the lower to middle troposphere, elevated CO (∼200 ppbv) was centered around 650–700 hPa. These
features are similar to the GEOS-Chem simulations. Note that the CO buildup around 300 hPa in the GEOS-Chem sim-ulation (Fig. 11a and b) was reflected in the MOPITT data (Fig. 6b), but not as obvious as in the simulation since the MOPITT retrievals are smoothed with the averaging kernels. This CO is also shown as a little bump around 300 hPa in MOPITT vertical profile in Fig. 5c. This buildup is miss-ing in the MOZAIC profile (Fig. 5d) because the aircraft flew towards the north and outside the region with high CO (Fig. 4b).
As the backward trajectories, starting from the boxed area at 700 hPa in Fig. 4b, indicated the most particles came from the large fire in the Indochina peninsula starting from 11 March 2004, we released air particles in FLEXPART over the fire regions from the surface to 1 km on 11 March 2004, and forward trajectories were simulated to track down the air parcels until 18 May 2004 at 02:00 LT. Taking the same zonal means as for Fig. 6b, it is found that the vertical distri-bution of particle concentrations is similar to that in Fig. 6b with the highest particle concentrations between 4 and 5 km (not show). As simulated by FLEXPART, the outflow of the high CO finally reached the west coast of the United States with particles mainly distributed around 5 km in altitude. High CO observed in East Asia in this case appeared the mostly southerly among the three (Fig. 6), leading to a most southerly outflow.
The strong lee-side-trough-induced convection described in the fourth process was first proposed by Lin et al. (2009) who found that the lee-side troughs above the Indochina peninsula play a significant role in uplifting ozone there. In this study, we found these lee-side troughs can promote lift-ing of CO even up to the upper troposphere (in the second process, Fig. 12). It is the interplay of the lee-side troughs and the cyclone in the northeast of China which formed a front system that transported CO from the Indochina penin-sula upward.
4.3 Case study III: 10 April 2005
In this case, MOPITT observed high CO of ∼250 ppbv at 300 hPa near the east coast of Japan on 10 April 2005 (Fig. 4c). Like for the other cases, the mean MOPITT pro-file was taken over a boxed area (in Fig. 4c) upwind of the MOZAIC measurement for comparison. The MOPITT verti-cal profile clearly shows a CO peak around 300 hPa, where it departs from the MOPITT monthly mean (Fig. 5e). Com-pared with the other cases, MOPITT CO peaked at higher altitudes, illustrating some MOPITT vertical sensitivity even at these altitudes. In Fig. 5f, a sharp peak of 300 ppbv in MOZAIC CO is shown around 350 hPa. This peak can also be reproduced in the GEOS-Chem simulation with a lower CO abundance of ∼200 ppbv (not shown). The profile of relative humidity follows closely that of CO, with values up to 90–100 % around 350 hPa, implying that the elevated CO was lifted to this level from the lower troposphere by a cy-clone system along its WCB. However, the MOZAIC ozone profile varies differently from the CO profile. We found this was connected to a strong stratospheric intrusion in-troduced by the cyclone. HYSPLIT (HYbrid Single-Particle Lagrangian Integrated Trajectory) simulations suggest that a large amount of air mass plunged around 4 April from 9 to 3–4 km over northwest of China, bringing high ozone to the lower troposphere (not shown). Another piece of evidence for a stratospheric intrusion is suggested by the low humid-ity between 780 and 400 hPa. Such a downwelling of strato-spheric air on the back side of cyclones was also reported by Miyazaki et al. (2003). Figure 6c shows an altitude–latitude cross section averaged between 120 and 150◦E (between two dashed lines in Fig. 4c). High CO of 200–250 ppbv appeared between 300 and 200 hPa around 35◦N. This is a rare case in which MOPITT reports such high CO (200–250 ppbv) at these high altitudes (around 300 hPa). Documented CO abundances observed by MOPITT at these altitudes were
∼130 ppbv over the Indian summer monsoon seasons (Kar
et al., 2004), 110–150 ppbv in North America from the forest fires, chemical, and anthropogenic sources (Liu et al., 2005, 2006), and∼150 ppbv in spring at Hong Kong (Zhou et al.,
2013).
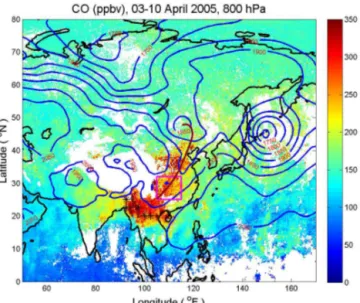
The MODIS fire data show that there were indeed large fires over Indochina peninsula in 3–10 April 2005, shown as stars in Fig. 13. Using GEOS-Chem, CO from fire and an-thropogenic sources was simulated to identify their respec-tive contributions and transport pathways.
Figure 13.MOPITT CO mixing ratio at 800 hPa from 3 to 10 April 2005, overlaid with the geopotential height at 850 hPa on 9 April 2005 at 00:00 UTC in blue contour and with a front as a brown solid line. The large and small stars denote daily mean fire counts of 100–200 and over 200 per 2.5◦×2.5◦grid area during the period, respectively. The boxed area was identified as a major CO source region from the FLEXPART simulation (see text for detail).
120◦E, 45–55◦N. The surface CO was transported upward and northeastward along the WCB (Fig. 14a). On 9 April the cyclone moved to the east (Figs. 13 and 14b). The high CO shows a comma shape along WCB at the mid-troposphere; this shape is typical for a mature cyclone system with a WCB (Cooper et al., 2002). On 10 April, the cyclone fur-ther moved eastward and reached the Sea of Japan (Fig. 14c). The GEOS-Chem simulation shows accumulation of high CO over the ridge of high pressure and along the front at the upper troposphere. The GEOS-Chem simulations suggest that the outflow of the high CO reached Canada on 16 April. The combined effects of cyclone activities, topography, and CO from different sources and locations are reflected in distinct CO signatures along the WCB. Figure 15 shows the CO from the fires (Fig. 15a and c) and from the an-thropogenic source (Fig. 15b and d) in the middle and up-per troposphere, respectively, overlaid with the geopotential height at 450 (Fig. 15a and b) and 250 hPa (Fig. 15c and d), respectively. In the middle troposphere (500–400 hPa), a large amount of CO from the fires in the Indochina penin-sula was uplifted to this level through orographic lifting and strong convection on the west and east side of the Hengduan Mountains, respectively. This CO distributed along the mid-dle part of the WCB on 9 April 2005 and was transported eastward on 10 April 2005 (Fig. 15a). One source of the an-thropogenic CO was concentrated around the North China Plain (Ding et al., 2009) where high CO was evident in MO-PITT data (Fig. 13, 35–40◦N, 100–120◦E). On 8 April, this CO was uplifted along the WCB and further transported to
Figure 14.The GEOS-Chem simulated CO(a)on 8 April 2005 in the lower troposphere (800–700 hPa),(b)on 9 April in the middle troposphere (500–400 hPa), and(c)on 10 April in the upper tropo-sphere (300–200 hPa). The contours are the geopotential height at 850, 450, and 250 hPa, respectively.
conver-Figure 15.The GEOS-Chem simulated fractional CO(a)from biomass burning and(b)from the anthropogenic source on 10 April 2005 at 00:00 UTC in the middle troposphere (500–400 hPa).(c)and(d)are the same as for(a)and(b), respectively, but in the upper troposphere (300–200 hPa). The geopotential height at 450 and 250 hPa is overlaid with the CO images in the middle and upper troposphere, respectively. White dots indicate the location of MOZAIC measurements.
gence around the North China Plain associated with elevated terrain, and by Ding et al. (2009), who speculated possible topography lifting in the North China Plain. In the south-ern end of the WCB (near 30◦N, 120◦E in Fig. 15b), the CO came from the anthropogenic source in the vicinity of the Sichuan Basin (∼26–34◦N, 102–110◦E). This CO was
transported vertically to 500 hPa on 8 April at 18:00 UTC to 9 April at 00:00 UTC. Air pollution often accumulates in the Sichuan Basin because of its special topography. The devel-opment of small-scale cyclones there is well known as the southwest vortex or Sichuan low (Tao and Ding, 1981). Ac-cumulated pollutants there usually are transported to the free troposphere by such convection. The strong convection can last more than 6 h and peak at midnight (Yu et al., 2007). As this anthropogenic source is quite stable, its contribution should not be understated.
Interestingly, Lin et al. (2009) reported an observed ozone enhancement from ozonesonde data at 4 km in Taiwan on 11 April 2005. They proposed a new transport mechanism from their study as discussed in Sect. 4.2, in which they attributed the elevated ozone to the biomass burning in Indochina. Sim-ilarly, CO from biomass burning was also apparent over Tai-wan at the middle troposphere in the GEOS-Chem
simula-tion (Fig. 15a), although the maximum CO enhancement was north of Taiwan at this altitude.
In this case, the strong part of the front (close to the cen-tre of the cyclones) swept southern China, where CO was high (Fig. 13). Along the front (30–40◦N, 100–120◦E), the temperature gradient at 925 hPa was as high as 4.9◦C per de-gree. Strong ascents occurred ahead of the front, with verti-cal velocity being ∼0.05 m s−1 at 900 and∼0.20 m s−1at 750 hPa, increasing with altitude until 300–250 hPa where the maximum vertical velocity was 0.26 m s−1. Conse-quently, the high CO can be rapidly lifted to the upper tro-posphere in this case.
FLEXPART was also used to trace down high CO in the MOPITT image by releasing air particles in the boxed area in Fig. 6c (indicated by a bar in Fig. 4c). We found that the most CO came from the southwest part of China (boxed area in Fig. 13) where MOPITT CO composite of 3–10 April 2005 shows high CO of 250–300 ppbv at 800 hPa. This CO was lifted along the WCB described above. This agrees with the GEOS-Chem simulation which attributed the major CO source in the upper troposphere to the anthropogenic CO, likely from the Sichuan Basin (Fig. 15d).
5 Discussion
New insights gained from this study and suggestions for fu-ture work are discussed as follows.
5.1 Observations of high CO episodes
In the three CO episodes, high CO abundances 300–550 ppbv were observed by MOZAIC in the free troposphere (Fig. 5). The CO abundances are among the highest documented at these altitudes in East Asia. Ding et al. (2009) observed high CO episode of∼1185 ppbv at 2.6 km (850–700 hPa) over the
North China Plain in summer 2007. Nédélec et al. (2005) found CO up to 800 ppbv above 8 km (∼400 hPa) near the
fire region of Lake Baikal on 3 and 4 June 2003. High-est CO concentrations during TRACE-P were between 250 and 300 ppbv from 2 to 12 km (Heald et al., 2003; Liu et al., 2003; Miyazaki et al., 2003). Occurrences of such high CO episodes are not by chance. They reflect the uniqueness and complexity of meteorology, orography, vegetation cov-ers, and CO sources in East Asia. For example, in all the cases, biomass burning occurred from regions with dense vegetation covers and with most active forest fires in East Asia (Schultz, 2002; Duncan et al., 2003). These fires are usually most active in summer in boreal forest in Russia (like in case 2003) and in spring in the southern East Asia (like cases 2004 and 2005) thus enhancing chances of high CO episodes in these seasons.
The frequency of occurrences of such high CO is illus-trated in Table 2. As the three cases occurred near Japan, MOZAIC data around the vicinity of Narita from 2001 to 2006 are summarized, showing occurrences of various CO abundance ranges in the boundary layer (the surface–850),
the lower (850–600), middle (600–400), and upper (400– 200 hPa) troposphere. Among all the data in the upper tro-posphere, CO abundances occurred 93 times (17 %) between 200 and 300, 19 times (4 %) between 300 and 400, and 6 times (1 %) over 400 ppbv. In the middle troposphere, the fraction of occurrences of CO within 200–300, 300–400, and over 400 ppbv was 14, 3, and 2 %, respectively. In the bound-ary layer, the highest occurrences of CO abundances (38 % of all the data in the layer) were within a range of 200– 300 ppbv, while the range was within 100–200 ppbv in the lower (47 %), middle (74 %), and upper troposphere (66 %). Seasonally, there were more high CO episodes in the higher altitudes in spring and summer than in fall and winter.
The frequency of such high CO episodes is also examined in the GEOS-Chem simulations and MOPITT observations in the vicinity of Narita (126–140◦E, 30–40◦N) in 2005 (Ta-ble 3). A count is added to a CO range if the daily maximum CO in the area (126–140◦E, 30–40◦N) falls into that CO range. Thus, the total counts for all the CO ranges at a given layer are 365 in 2005 for GEOS-Chem, while the counts are 281 for MOPITT due to missing data. To minimize noise in daily MOPITT data, only when there are at least 10 data in the area with the maximum CO falling into a given CO range, a count is added. GEOS-Chem can simulate CO up to 400 ppbv in the upper troposphere, while the maximum CO in MOPITT is lower so that different CO ranges are used in Table 3. Overall, MOZAIC, MOPITT, and GEOS-Chem all show a high frequency of high CO (larger than 200 ppbv) at the surface, progressively shifting to a high frequency of low CO (less than 200 ppbv) at the upper troposphere. Be-tween 400 and 200 hPa, CO with 200–300 ppbv occurred 1.2 times every 10 days in GEOS-Chem, which was slightly lower than in MOPITT (1.8 times) and MOZAIC (1.7 times). Overall, MOZAIC observed 2–5 % more vertical transport of high CO (> 300 ppbv) to the upper troposphere than GEOS-Chem, while the latter simulated 10–20 % more frequently the transport to the middle and lower troposphere with simi-lar or lower CO abundances.
It is likely that on average, the extremely high CO episodes (∼500 ppbv), such as the 2003 and 2004 cases (Fig. 5),
Table 2.Occurrences of various CO ranges at different altitudes in the MOZAIC measurements in the vicinity of Narita from 2001 to 2006.
Occurrence Fractional occurrence ( %)
Season Pressure CO range (ppbv) CO range (ppbv)
(hPa) 0–100 100–200 200–300 300–400 > 400 All 0–100 100–200 200–300 300–400 > 400 All
All 400–200 67 354 93 19 6 539 12 66 17 4 1 100
600–400 36 359 69 15 8 487 7 74 14 3 2 100
850–600 17 180 150 31 6 384 4 47 39 8 2 100
Surface–850 4 60 142 83 88 377 1 16 38 22 23 100
Spring 400-200 11 96 28 12 2 149 7 64 19 8 1 100
600–400 1 101 29 9 3 143 1 71 20 6 2 100
850–600 0 38 55 20 5 118 0 32 47 17 4 100
Surface–850 0 14 44 27 29 114 0 12 39 24 25 100
Summer 400–200 14 132 41 4 4 195 7 68 21 2 2 100
600–400 13 138 22 1 2 176 7 78 13 1 1 100
850–600 14 80 50 6 0 150 9 53 33 4 0 100
Surface–850 4 32 48 30 36 150 3 21 32 20 24 100
Fall 400–200 30 61 15 2 0 108 28 56 14 2 0 100
600–400 20 50 11 2 1 84 24 60 13 2 1 100
850–600 3 30 17 3 0 53 6 57 32 6 0 100
Surface–850 0 10 20 12 11 53 0 19 38 23 21 100
Winter 400–200 12 65 9 1 0 87 14 75 10 1 0 100
600–400 2 70 7 3 2 84 2 83 8 4 2 100
850–600 0 32 28 2 1 63 0 51 44 3 2 100
Surface–850 0 4 30 14 12 60 0 7 50 23 20 100
5.2 The role of topography
East Asia’s topography varies significantly across its vast width, increasing from east to west, with a variety of terrains. This study found that topography there affected the three cases in different ways. In addition to its general function in orographic lifting (in cases 2004 and 2005), topography also interplay with frontal systems and enhance the uplifting sub-stantially in the North China Plain (in cases 2004 and 2005). It is notable that CO transports from south to north along el-evated terrain over China (in case 2005, Fig. 14a). Under the influence of the Tibetan Plateau, the southwest vortex (or the Sichuan low) is formed (Tao and Ding, 1981) and can facili-tate strong convection in the Sichuan Basin (in case 2005).
In particular, topography-induced convection due to the lee-side troughs east of the Hengduan Mountains, proposed by Lin et al. (2009), offers a new mechanism for vertical transport of pollution from the region (in cases 2004 and 2005). Lin et al. (2009) mainly aimed at pollution transport to the lower and middle troposphere. Extending from Lin et al. (2009), this study found such a mechanism to be plausi-ble in explaining pollution transport to the upper troposphere. We found that the impacts of the topography-induced con-vection on vertical CO transport vary substantially from year to year. A study on such interannual variation is underway.
5.3 The implications of WCB trends on uplifting of CO Extratropical cyclones and associated frontal activities are important in lifting CO from the boundary layer to the free troposphere. This also applies to other air pollutants. Zhao et al. (2008) found that the influence of Asian dust storms on North American ambient particulate matter levels is highly related to the height to which the frontal cyclones in East Asia can lift dust. Although many functions and character-istics of WCBs have been recognized by earlier studies, we found some details new or unique for the three cases. In case 2004, it is the interplay of the lee-side troughs and the cy-clone in the northeast of China that transported CO from the Indochina peninsula upward. The high CO in this case ap-peared the most southerly among the three, leading to a most southerly outflow. In case 2005, the downwelling of strato-spheric air on the back side of cyclones was recognized. The CO along various parts of the WCB was identified to be of fire origin from Indochina and anthropogenic origin from Sichuan and the North China Plain. The source allocation was sensitive to the location of the front. Comparing cases 2004 and 2005, we found that uplifting of CO to the upper troposphere became more possible when large CO sources coincided with the strongest part of a WCB.
Table 3.Occurrences of various CO ranges in GEOS-Chem simulations and MOPITT observations in the vicinity of Narita (126–140◦E 30–40◦N) in 2005.
GEOS-Chem: fractional occurrence ( %) MOPITT: fractional occurrence ( %)
Pressure CO range (ppbv) Pressure CO range (ppbv)
(hPa) 0–100 100–200 200–300 300–400 > 400 All (hPa) 0–100 100–200 200–250 > 250 All
200–100 12 87 1 0 0 100 200–100 38 45 11 6 100
400–200 0 87 12 1 0 100 400–200 4 68 18 10 100
600–400 0 53 35 11 1 100 600–400 6 86 6 1 100
850–600 0 20 46 25 8 100 800–600 7 67 20 6 100
1000–850 0 7 46 35 11 100 1000–800 2 16 18 64 100
similar events to happen in the future. Chen et al. (1991) sug-gested a decline in cyclonic events in East Asia from 1957 to 1977 and no such decline from 1977 to 1987. Recently, an analysis for a longer term from 1951 to 2010 based on ensembles of twentieth century reanalysis (20CR) showed a decreasing trend in the northern part of the Sea of Japan and an increasing trend over the southern part of the Sea of Japan and the lee side of the Altai-Sayan in summer (Wang et al., 2013). The implications of these trends on uplifting of CO deserve further investigation. It would be helpful to conduct statistical analysis of the CO source distribution along WCBs in East Asia in the future.
5.4 Model simulations of pollution transport
Pollution transport can be tracked computationally with Eu-lerian and Lagrangian approaches, as represented by GEOS-Chem and FLEXPART models, respectively. GEOS-GEOS-Chem can not only track transport of CO (a physical process) but also consider chemical reactions during the transport while FLEXPART can visualize transport pathways and pin down source regions effectively, without considering chemi-cal functions in the meantime. GEOS-Chem can also fill the gaps in MOPITT satellite data (Figs. 10, 11, and 14). We found that GEOS-Chem simulates the observed aircraft and satellite CO well in cases 2004 and 2005 but cannot fully re-produce the elevated CO in MOZAIC data in case 2003. The simulated CO plume is with lower mixing ratios and at lower altitudes than in the MOZAIC data. This is possibly due to an underestimated fire inventory or conservative parameteriza-tions in simulating large forest fires or both in GEOS-Chem. Nassar et al. (2009) reported underestimated CO over the 2006 Indonesia fire region by GEOS-Chem, in comparison with the Tropospheric Emission Spectrometer (TES) obser-vations. FLEXPART can generally simulate the three cases, strikingly well sometimes in agreement with observed details in space and time, although discrepancies between FLEX-PART and satellite and aircraft observations can be found in various places on small scales. FLEXPART simulates strong sources well but sometimes omits weak sources.
5.5 Applications of MOPITT data
We analyzed MOPITT data from two aspects: vertical sen-sitivity on the synoptic scale. Both are challenging and have not been studied adequately. Large gaps due to clouds and the limited MOPITT swath make application of MOPITT on the synoptic-scale difficult. Thus, application of MOPITT data over East Asia were mostly focused on monthly or seasonal scales (Tanimoto et al., 2008; Zhao et al., 2010; Hao et al., 2011; Liu et al., 2011; Zhou et al., 2013; Su et al., 2012). This study shows that even with large gaps, daily MOPITT data can capture vertical disturbances of CO on the synoptic scale, which are usually diluted on longer timescales. This study also suggests the importance of filling the gaps with other satellite data or in designing new satellite instruments, for the purpose of detecting such variation over large areas on regional and global scales.
Typically for satellite remote-sensing products, the MO-PITT retrieval at a specific pressure level is influenced by CO from other levels and thus its retrieval at that pressure level can be biased. However, MOPITT can more accurately measure the average CO mixing ratio over a thick layer, re-sulting in a coarse vertical resolution. It was suggested that the vertical variation in CO cannot be fully resolved in ear-lier applications of MOPITT data (Jacob et al., 2003). This study addressed the MOPITT vertical sensitivity with new MOPITT V5 data and found enhanced vertical sensitivity in V5 data in the free troposphere, even in the upper tropo-sphere, in addition to in the boundary layer emphasized by Worden et al. (2010) and Deeter et al. (2012). The enhanced DFSs and the averaging kernels in V5 illustrated by Worden et al. (2010) and Deeter et al. (2012) are supported (Figs. 1 and 5 and Sect. 3).
in their Fig. 4). Overall, this study found (1) MOPITT can differentiate the magnitude of CO plumes originated from strong or weak sources (Figs. 4, 5, and 6); (2) MOPITT can distinguish elevated CO in the lower, middle, and upper tro-posphere (Figs. 4, 5, and 6); (3) the shape of CO plumes in vertical direction matches with simulations of GEOS-Chem and FLEXPART, sometimes remarkably well (Figs. 6, 8, and 11); and (4) there is more vertical structure in CO in new V5 than in earlier versions of MOPITT data (Fig. 5).
It is the relative variations in MOPITT CO data that help diagnose CO transport vertically or horizontally. This study suggests using MOPITT data quantitatively with caution, es-pecially at altitudes with high CO plumes because, as illus-trated in Figs. 5 and 6, the magnitude of elevated CO in the MOPITT data could be lower than that in the MOZAIC data at the altitudes where CO peaked. Therefore, the vertical variation of CO, even enhanced in V5, is still much smoothed in MOPITT data. MOPITT can distinguish elevated CO in different layers of the free troposphere, yet sometimes can-not specify the exact altitude of elevated CO shown in the MOZAIC measurements (Figs. 5 and 6). One limitation for MOPITT’s application of vertical transport is the complica-tion of clouds, which often accompany frontal systems. As shown in cases 2004 and 2005, CO is usually high in cloudy areas. Therefore, the magnitude of CO abundances can be underestimated by MOPITT in these areas.
6 Conclusions
East Asia is characterized by its unique and complex me-teorology, topography, vegetation covers, and CO sources. The characteristics are reflected in uplifting of CO illustrated in three high CO episodes during 2003–2005 in this study. Through integrated analyses of observations from the air-borne MOZAIC and spaceair-borne MOPITT instruments and simulations from a trajectory dispersion model FLEXPART (Stohl et al., 2005) and a chemical transport model GEOS-Chem (Bey et al., 2001), this study draws the following con-clusions.
1. In the three CO episodes, high CO abundances of 300– 550 ppbv were observed by MOZAIC in the free tropo-sphere over the East China Sea and the Sea of Japan. These are among the highest CO abundances ever doc-umented at these altitudes. The three cases occurred when and where meteorology was favorable and CO sources were strong. It is likely that on average, the extremely high CO episodes (∼500 ppbv) like cases 2003 and 2004 occurred 2–5 times every 100 days in their respective altitudes over the region, while in case 2005, episodes with a lower CO abundances (200– 300 ppbv) occurred 1–2 times per 10 days between 400 and 200 hPa. CO episodes in even lower altitudes and with even lower abundance occurred more frequently in the region.
2. GEOS-Chem and FLEXPART simulations reveal differ-ent CO signatures from biomass burning and anthro-pogenic sources in the CO enhancement in the three cases, reflecting different transport pathways and mech-anisms and locations of both sources. In case 2003, CO from large forest fires near Lake Baikal domi-nated the elevated CO. In case 2004, anthropogenic CO came from the North China Plain and mostly reached
∼700 hPa near the East China Sea, while CO from
biomass burning in Indochina was transported through two separate pathways, leading to two distinct CO en-hancements around 700 and 300 hPa. In case 2005, along a WCB over the East China Sea and the Sea of Japan, anthropogenic CO from the North China Plain and from the Sichuan Basin prevailed in the northern and southern part of the WCB, while CO from biomass burning in Indochina was mostly distributed in the mid-dle part of the WCB.
3. Topography in East Asia influences vertical transport of CO in different ways. In particular, topography-induced lee-side troughs east of the Hengduan Mountains over Indochina lead to strong convection. This new mech-anism proposed by Lin et al. (2009) is supported by this study in explaining CO transport to the middle tro-posphere and further extended for CO transport to the upper troposphere. Strong convection from the Sichuan Basin also plays an important role in vertically trans-porting anthropogenic CO. The topography interacting with frontal activities can enhance the vertical transport of CO substantially in the North China Plain.
4. Extratropical cyclones and associated frontal activities are important mechanism in lifting CO from the bound-ary layer to the free troposphere, as illustrated by the three cases and earlier studies. East Asia is one of two regions between 25 and 45◦N with most frequent WCB events (Eckhardt et al., 2004). Inside East Asia, there are two regions where cyclones occur most frequently: one over the lee sides of the Altai-Sayan and the other in the East China Sea and the Sea of Japan, occurring mostly in spring and summer over both regions (Chen et al., 1991). The seasons and locations of the three high CO episodes just match well with these two areas and active cyclone seasons, which may not happen by chance. 5. Biomass burning is identified as an important source for
all three episodes, suggesting that CO from sporadic fire activities can provide additional CO to less varying an-thropogenic emission and enhance chances of high CO episodes. The fire regions shown in this study are the places with dense vegetation covers and with the most active forest fires in East Asia.