www.atmos-chem-phys.net/11/6475/2011/ doi:10.5194/acp-11-6475-2011
© Author(s) 2011. CC Attribution 3.0 License.
Chemistry
and Physics
Spatial distribution of the source-receptor relationship of sulfur in
Northeast Asia
M. Kajino1,*, H. Ueda2, K. Sato3, and T. Sakurai4
1Research Center for Advanced Science and Technology, The University of Tokyo, Tokyo, Japan 2Dept. of Environ. and Life Engineering, Toyohashi Institute of Technology, Toyohashi, Japan 3Asia Center for Air Pollution Research, Niigata, Japan
4Japan NUS Co. LTD, Tokyo, Japan
*now at: Meteorological Research Institute, Japan Meteorological Agency, Tsukuba, Japan Received: 22 September 2010 – Published in Atmos. Chem. Phys. Discuss.: 10 December 2010 Revised: 24 June 2011 – Accepted: 30 June 2011 – Published: 7 July 2011
Abstract. The spatial distribution of the source-receptor relationship (SRR) of sulfur over Northeast Asia was ex-amined using a chemical transport model (RAQM) off-line coupled with a meteorological model (MM5). The simu-lation was conducted for the entire year of 2002. The re-sults were evaluated using monitoring data for six remote stations of the Acid Deposition Monitoring Network in East Asia (EANET). The modeled SO2 and O3 concentrations agreed well with the observations quantitatively. The mod-eled aerosol and wet deposition fluxes of SO24− were un-derestimated by 30 % and 50 %, respectively. The domain was divided into 5 source-receptor regions: (I) North China; (II) Central China; (III) South China; (IV) South Korea; and (V) Japan. The sulfur deposition in each receptor region amounted to about 50–75 % of the emissions from the same region. The largest contribution to the deposition in each region was originated from the same region, accounting for 53–84 %. The second largest contribution was due to Region II, supplying 14–43 %. The spatial distributions of the SRRs revealed that subregional values varied by about two times more than regional averages due to nonuniformity across the deposition fields. Examining the spatial distributions of the deposition fields was important for identifying subregional areas where the deposition was highest within a receptor re-gion. The horizontal distribution changed substantially ac-cording to season.
Correspondence to:M. Kajino ([email protected])
1 Introduction
Sulfur oxides are one of the most important trace substances in the atmosphere because they cause environmental acidifi-cation and aerosol-induced climate changes. The East Asian region has been one of the largest emission source regions in the world (Streets et al., 2003; Ohara et al., 2007; Zhang et al., 2009). Since SO2emitted from anthropogenic sources and volcanic eruptions is oxidized in the atmosphere during long-range transport and forms SO24−, which causes acidifi-cation of soil, land, water, and vegetation, the issue of trans-boundary air pollution evokes significant scientific interest and political concern (Carmichael et al., 2002). To better un-derstand the trans-boundary problem and plan environmental policies, inter-political or inter-regional source-receptor rela-tionship (SRR) analyses have been widely conducted (e.g., Carmichael et al., 2002; Lin et al., 2008; Nagashima et al., 2010). State-of-the-art techniques have been established to study SRRs of substances with highly non-linear photochem-ical chain reactions, such as those of NOy(Lin et al., 2008) and O3(Nagashima et al., 2010), and knowledge of SRRs in Asian regions has been accumulating (Lin et al., 2008).
trans-boundary air pollution problems, the importance of the ensemble technique, which incorporates several chemi-cal transport models with various implementations and for-mulations, has been pointed out in various model inter-comparison studies, such as MICS-Asia phase I (Carmichael et al., 2002), MICS-Asia phase II (Carmichael et al., 2008), the joint research on Long-range Trans-boundary Air Pollu-tants in Northeast Asia (LTP project) of the Tripartite Envi-ronment Ministers Meeting among Japan, China and Korea (TEMM) (Choi et al., 2001; Kim et al., 2011).
Discussions of SRR analyses have usually been based on source-receptor tables showing the contributions of the sum of emissions in source regions relative to the aerial sum-mation of deposition in receptor regions. However, due to the high nonuniformity of spatial distributions of deposition, spatial distributions of SRRs should be discussed together with SRR tables. Without discussions of spatial heterogene-ity, we cannot identify the true contributions to deposition in some specific subregional areas. The SRR over the ocean was poorly addressed in the previous studies but informative for the budget study. Showing SRR over the ocean is espe-cially important for persistent and bioaccumulate hazardous materials such as polycyclic aromatic hydrocarbons (PAHs), having acute and chronic toxicity to marine life (Livingstone, 1998; Hylland, 2006; Suzuki et al., 2009).
Therefore, we present the horizontal distribution of the SRR of sulfur both over the land and the ocean in North-east Asia as well as SRR tables using a three-dimensional chemical transport model, the Regional Air Quality Model (RAQM; An et al., 2002; Han, 2007). The RAQM model was developed in the Asian Center for Air Pollution re-search (ACAP), formerly the Acid Deposition and Oxi-dant Research Center (ADORC), the network center of the Acid Deposition Monitoring Network Center in East Asia (EANET). The model has been used for various air pol-lution studies and substantial modifications have been made based on comparison and evaluation with extensive and long-term monitoring data in the Asian region (An et al., 2002, 2003; Han et al., 2004, 2005, 2006, Kajino et al., 2004, 2005; Han, 2007; Han et al., 2008). The model has been used in the MICS-Asia Phase II study (Carmichael et al., 2008) and the LTP project (Choi et al., 2001). Verification of the simula-tion used in this study was made by Kim et al. (2011) by comparing the model results with observation data from the LTP stations and the results of the other LTP model partic-ipants. In this paper, the model results are also compared with EANET observation data. The model formulation and the SRR analysis method are described in Sect. 2. The model results are evaluated using the EANET monitoring data for the concentrations and deposition amounts of air pollutants in Sect. 3, and the spatial and seasonal variations of concen-trations, deposition amounts, and SRRs of sulfur compounds are discussed in Sect. 4. Major findings are summarized in Sect. 5.
2 Methods
2.1 Off-line coupled meteorology-chemical transport model system
Fig. 1. The model domain and the EANET remote monitoring stations (1–6, pink triangle): 1. Rishiri, 2. Tappi, 3. Sado, 4. Oki, 5. Jeju, and 6. Hedo. Descriptions of the locations are given in Table 1. The color shaded areas (left) I to V represent regions for source-receptor relationship analyses, I: North China (>40◦N), II: Central China (>30◦N,<40◦N), III: South China (<30◦N), IV: South Korea, and V: Japan. The areas on the right represent oceanic receptor areas, YEC: Yellow Sea and East China Sea, SJ: Sea of Japan, and NWP: Northwest Pacific Ocean.
by H2O2, O3, methyl hydrogen peroxide, peroxyacetic acid, and trace metals (Fe3+ and Mn2+). Accumulated wet de-position from precipitating clouds is computed by integrat-ing the product of the grid-averaged precipitation rate and mean cloud water composition during each cloud lifetime. It should be noted here that the precipitation rate predicted by MM5 and by this submodel are independent.
The MM5 (Grell et al., 1994) version 3.7 (Fifth-Generation NCAR/Penn State Mesoscale Model) was used to provide meteorological fields for RAQM (wind, tempera-ture, water mixing ratio, and surface variables). The NCEP FNL reanalysis data with a 1.0-degree resolution was used to provide the initial and boundary conditions for meteo-rological fields. Four-dimensional data assimilation (nudg-ing by three-dimensional reanalysis data) was utilized to im-prove model results, especially for the wind and temper-ature fields. Specific physical options, such as the MRF scheme (Hong and Pan, 1996) for PBL, Betts-Miller (Betts, 1986; Betts and Miller, 1986, 1993) for cumulus, RRTM for radiation, mixed-phase for explicit moisture, and five-layer soil model for land-air processes, were chosen for the simulations. The domain for MM5 was larger than that of RAQM, with the center located at 35◦N, 125◦E. There were 125×95 grid numbers in a plane with a 45-km grid resolu-tion, and 23 sigma layers from the surface to 100 hPa. The MM5 output was adequately interpolated from a Lambert projection to the spherical coordinates of RAQM.
2.2 Parameters used in the simulation
A simulation was performed for the year 2002, from 1 Jan-uary to 31 December, with a spin-up period of 3 days. A 3-day spin-up period is usually insufficient for longer-lived
secondary components such as O3 and aerosols. However, as the integration period of the simulation was the one year, the initialization problem may not be serious for the whole simulation results. March, July, and December were se-lected for the assessment of seasonality because they repre-sent spring, summer, and winter, respectively. The model do-main covered Northeast Asia (100–145◦E, 20–50◦N) with
a horizontal resolution of 0.5 degrees (thus, 90×60 grids, Fig. 1). In RAQM, 12 layers stretched vertically from the surface to 10 km (at about 50, 150, 300, 500, 750, 1500, 2500, 3500, 4500, 6000, 7500, and 8950 m). The initial and boundary conditions were taken as the lower end of observa-tions available from recent studies for East Asia (Carmichael et al., 1998; Luo et al., 2000). Side boundary conditions were held during the simulation, whereas the top boundary condition for O3was implemented as a constant level with seasonal variation. Topography data were obtained from the US Geological Survey Earth Resources Observation System (EROS) Data Center. The land use data came from DeFries and Townshend (1994), in which 12 categories of land use are classified.
environmental impacts of anthropogenic emissions from the three huge-emitter countries over the Northeast Asian sub-region. The emission from other Asian regions such as South Asian and Southeast Asian countries are not included in the emission inventory. The emission data were available in a grid of 1 degree×1 degree and equally allocated to a 0.5◦ model grid for RAQM. Biogenic VOCs over China, includ-ing isoprene, monoterpenes, and other VOCs, were taken into account. Monthly values of biogenic VOC emissions were obtained for model simulations by multiplying annual amounts by temporal scaling factors. All area sources were assigned to the lowest model layer, about 50 m above the ground. In addition to the LTP standard emissions data, vol-canic emissions were included from MICS-Asia emissions data (Carmichael et al., 2008), with a release height at an altitudinal range of 750–1500 m. In particular, Mt. Oyama in Miyakejima Island (139.531◦E, 34.081◦N, 813 m a.s.l.)
has a high level of SO2emissions that have resulted in sub-stantial environmental acidification in Far East Asia (Sat-sumabayashi et al., 2004, Kajino et al., 2004, 2005). Mt. Oyama is located in the northwest Pacific Ocean, 180 km south of the Tokyo metropolitan area, and it began to erupt on 8 July 2000. The Seismological and Volcanological De-partment of the Japan Meteorological Agency (SVD-JMA) has collected continuous measurements of the SO2emissions and smoke height above the crater since September 2000 (Kazahaya, 2001). It was reported that the daily amount of SO2 emissions from Mt. Oyama in 2002 was approxi-mately 9500 tons day−1on average. SO2from shipping and biogenic sulfur compounds such as dimethyl sulfide (DMS), dimethyl disulfide (DMDS), COS, H2S, CS2 and CH3SH from ocean surfaces were not considered in the study. The contribution of emission fluxes of those species to concen-trations and depositions of SO2and sulfate over the region could be much smaller compared to anthropogenic SO2from China and that from Miyakejima volcano (Streets et al., 2003; Kajino et al., 2004). However, those can be a reason for the discrepancy between the simulation and the observa-tion because the observaobserva-tion sites we selected are located at isolated islands or capes, surrounded by ocean.
2.3 Source-receptor relationship method
Source-receptor relationships (SRR) were calculated using the following formula:
Rij(%)= Hij n P 1=1
Hij
×100, (1)
whereRijis the contribution ofi-th emission source to thej -th receptor andHijis the deposition amount at thej-th recep-tor due to thei-th source. Contributions from the respective emission sources were obtained from the difference between the result when considering all of the emission sources and the result when thei-th source was excluded. This method is
simple but useful for compounds involving less non-linearity in their photochemical chain reactions, such as sulfur com-pounds. In this study, the domain was divided into five source-receptor regions (Fig. 1).
In recent works, to derive the SRR, emissions of precur-sors are reduced by 15 % and the simulation results were scaled up to represent the entire emission from an emitter (Nyiri et al., 2010). The method was found to be more robust as the full removal of the source input caused non-linearity effects on SRR for highly reactive nitrogen compounds and O3through the photochemical chain reactions. Still the prob-lem is usually of minor importance when sulfur compounds are considered, and thus we utilized Eq. (1).
2.4 EANET observation
We used the Acid Deposition Monitoring Network in East Asia (EANET) monitoring data (EANET, Guidelines for acid deposition monitoring in East Asia, available at http://www. eanet.cc/product.html) for model evaluation. The EANET stations monitor 1-day accumulated once per week (Korea) or 14-day (Japan) accumulated concentrations of gaseous species (HNO3, HCl, NH3, and SO2)and aerosol compo-nents (SO24−, NO−3, Cl−NH+
4, Na
+, Mg2+, K+, and Ca2+)
using the filter pack (FP) method (EANET, Technical doc-uments for filter pack method in East Asia, available at http://www.eanet.cc/product.html). They monitor daily ac-cumulated concentrations in precipitation (SO24−, NO−3, Cl− NH+4, Na+, Mg2+, K+, and Ca2+)using precipitation col-lection and ion chromatography analysis (EANET, Technical manual for wet deposition monitoring in East Asia, available at http://www.eanet.cc/product.html) and hourly SO2, NO, NO2, NOx, O3, PM2.5, and PM10 concentrations and mete-orological data such as wind speed, wind direction, temper-ature, relative humidity and solar radiation. Quality assur-ance and quality control (QA/QC) activities are conducted to ensure high quality of monitoring data according to the QA/QC program guidelines (available at http://www.eanet. cc/product.html). The FP method is associated with several distinct artifact problems during the long-term sampling pe-riod. However, the effects can be neglected in this study be-cause we focus only on sulfur compounds that are not af-fected significantly compared to other semi-volatile compo-nents, such as ammonium, nitrate and chloride.
To deduce the anthropogenic and volcanic SO24−, non-seasalt (nss)-SO24−are defined, excluding the contribution of seasalt originated proportions as follows:
[nss-SO24−] = [SO42−] −0.251× [Na+] (2) where [ ] denote atmospheric weight concentrations in µg m−3.
Table 1.Description of the EANET remote observation sites used in this study. Each station is depicted in Fig. 1.
Longitude Latitude Altitude Country
(E) (N) (m a.s.l.)
1. Rishiri 141◦12′ 45◦07′ 40 Japan 2. Tappi 120◦21′ 41◦15′ 105 Japan 3. Sado 138◦24′ 38◦14′ 136 Japan
4. Oki 133◦11′ 36◦17′ 90 Japan
5. Jeju 126◦10′ 33◦18′ 72 Korea
6. Hedo 127◦15′ 26◦52′ 60 Japan
emission sources and complexity of local orographically in-duced winds, air pollutant transport events mostly coincide with synoptic-scale disturbances and are generally well re-produced by regional-scale models.
3 Model evaluation using the EANET monitoring data
The RAQM model performance has been extensively evalu-ated by comparing to EANET monitoring data sets in pre-vious studies. The model could reproduce monthly NO−3 concentrations in rainwater (An et al., 2002), hourly SO2 and monthly nss-SO24−concentrations in rainwater affected by the Miyakejima Volcano (An et al., 2003; Kajino et al., 2004), PM2.5, PM10, and the aerosol size distribution dur-ing dust events (Han et al., 2004), 3-hourly concentrations of aerosol nss-SO24− and NH+4 (Kajino et al., 2004), hourly concentrations of SO2, NOx, and O3 (Kajino et al., 2005; Han et al., 2004, 2006), wet deposition of nss-SO24−, NO−3, NH+4, Ca2+, H+(Han et al., 2006), O
3relevant trace species such as NOxand VOCs measured for the TRACE-P project (Han, 2007), and all of those species along with a model inter-comparison study for MICS-Asia Phase II (Carmichael et al., 2008; Han et al., 2008 and references therein).
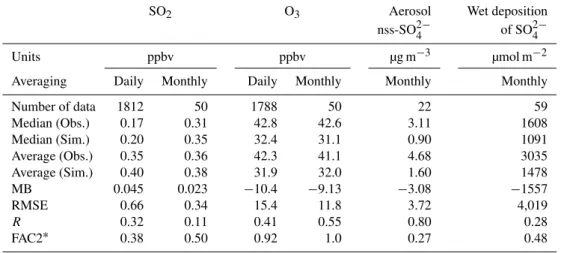
Table 2 summarizes statistical analyses for comparisons between daily and monthly observations and simulation data at the six EANET remote monitoring stations depicted in Fig. 1 and described in Table 1. The SO2 and O3 concen-trations and wet deposition of nss-SO24− were measured at all of the stations, whereas aerosol nss-SO24−was measured at Jeju (1 day per week for the entire year), Oki (14 days in July 2002) and Rishiri (14 days in March 2002). The filter pack measurements were not yet started at the other stations during the period examined. The table shows the medians and averages of the observations and simulation data, the mean bias (MB) of simulations compared to observations, the root mean square errors (RMSEs), the correlation coef-ficients (Rs), and the FAC2s (number fraction of data which satisfy that the simulation and observation agree within a fac-tor of 2) between simulations and observations.
Table 3 summarizes the emission amounts accumulated over the region for the emission inventory used in the study. Because the Asian region is one of the most serious emis-sion source regions of atmospheric pollutants in the world, there have been various studies for the estimation of its emis-sion inventory. For recent years, Streets et al. (2003), for the base year 2000, Ohara et al. (2007), for up to 2003, and Zhang et al. (2009), for the base year 2006, have frequently been used and widely credited. The estimated Chinese emis-sion from our emisemis-sion inventory was 20.7 Tg SO2, which is comparable to Streets’ inventory (20.4 Tg SO2)and rela-tively smaller than the newer estimates from Ohara’s inven-tory (27.6 Tg SO2)and Zhang’s inventory (22.9 Tg SO2 for 2001).
In Table 2, the simulated SO2 concentrations agree with observations quantitatively (median and average), whereas the correlation among them is not large. It is mainly due to the higher detection limit of SO2 (0.1 ppbv) compared with concentrations measured at the stations (∼0.3 ppb). The coarse horizontal resolution of our emission inventory (1 de-gree) might cause the relatively small correlation coeffi-cients. It is coarser than other inventories and the model grid resolution (0.5 degrees). However, it may not be critical be-cause we have selected only remote stations, where we solely capture long-range transport phenomena. The distances be-tween the monitoring stations and the huge emission source regions (the Asian continent) are∼1000 km. Big transport events usually last on the scale of several hours, shorter than 1 day. Though the daily based correlation coefficient is not very large, on an hourly basis, the measured and modeled high concentration peaks are observed to coincide in general. Taken together with the fact that the daily and monthly mean values are reasonable, the simulation performed successfully. Trends of simulated O3concentrations were generally well reproduced (R=0.4 to 0.5 and FAC2>0.9), whereas the mean concentration was lower by 10 ppb. Due to the com-plexity of O3photochemistry and its relatively long lifetime, the regional scale simulation of O3is difficult compared with other primary species. It depends highly on the concen-trations and speciation of VOCs and on lateral and upper boundary concentrations of the model domain regions, both of which are very much uncertain. Since hourly variations for NOx and VOC emissions were not provided in the invento-ries we used, the variations were not considered for the sim-ulation. This might cause the poor model performance for ozone. Still, as long as sulfur compounds are concerned, this level of deviations in O3(R∼0.5 and FAC2>0.9) will not affect substantially on predicting conversion rates of S(IV) to S(VI) in the air as well as in water droplets. To predict highly reactive O3 and nitrogen compounds, hourly varia-tions in emissions should be carefully taken into account.
Table 2.Statistical analysis for comparisons between daily and monthly observations and simulation data at the six EANET remote stations.
SO2 O3 Aerosol Wet deposition
nss-SO24− of SO24−
Units ppbv ppbv µg m−3 µmol m−2
Averaging Daily Monthly Daily Monthly Monthly Monthly
Number of data 1812 50 1788 50 22 59
Median (Obs.) 0.17 0.31 42.8 42.6 3.11 1608
Median (Sim.) 0.20 0.35 32.4 31.1 0.90 1091
Average (Obs.) 0.35 0.36 42.3 41.1 4.68 3035
Average (Sim.) 0.40 0.38 31.9 32.0 1.60 1478
MB 0.045 0.023 −10.4 −9.13 −3.08 −1557
RMSE 0.66 0.34 15.4 11.8 3.72 4,019
R 0.32 0.11 0.41 0.55 0.80 0.28
FAC2∗ 0.38 0.50 0.92 1.0 0.27 0.48
∗Number fraction of data within a factor of two.
Table 3.Emissions of sulfur (kton S yr−1).
Region I II III IV V Miyakejima
Volcano∗
Emissions 1007.4 6019.32 3302.4 557.6 454.7 1734.1
∗Miyakejima volcanic emissions are included in Region V for SRR analyses.
is dissolved efficiently into cloud and rain droplets with fast oxidation occurring in the aqueous phase. Some of the nss-SO24− produced in hydrometeors may remain in the atmo-sphere after the evaporation of clouds and some may be de-posited to the ground surface by precipitation. The high un-certainty in the heterogeneous oxidation and wet scavenging processes contribute to either an increase or a decrease in par-ticulate nss-SO24−concentrations. Heterogeneous nss-SO24− production on sea-salt (Chameides and Stelson, 1992) and dust (Tang et al., 2004) particles should promote the oxida-tion of sulfur, but these processes are missing in the model. As we focused on SRR of sulfur among the three Northeast Asian countries, the contributions of boundary conditions, which were not seriously taken into account, could be a rea-son for the underestimation of the modeled nss-SO24−. For the rapid growth in power production and industry in this part of the world, our initial and boundary conditions ob-tained from Carmichael et al. (1998) and Luo et al. (2000) could be outdated for the simulation of the year 2002. Be-sides, emissions from South and Southeast Asian countries were not included in the study. As the plume from outside the domain was transported in longer distances, S(IV) could be sufficiently oxidized to S(VI). This is consistent with the fact that modeled S(VI) was underestimated, whereas S(IV) was reasonable.
The simulated monthly wet deposition flux of nss-SO24− was compared with observations. The modeled wet
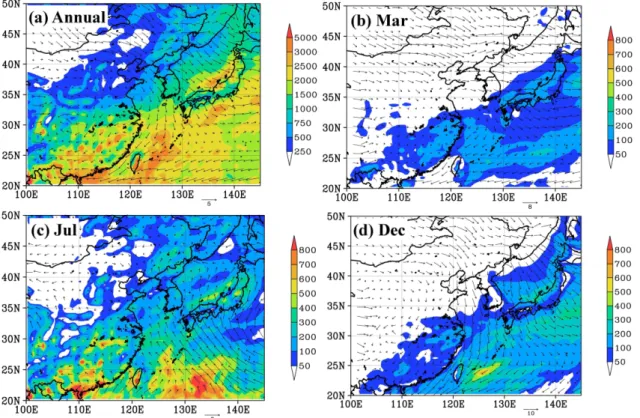
Fig. 2. Spatial distributions of(a)yearly and(b–d)monthly accumulated precipitation (mm) and mean surface wind field (m s−1). The selected months,(b)March,(c)July, and(d)December, represent the spring, summer, and winter seasons, respectively.
this paper, the source-receptor relationship of sulfur and its horizontal and seasonal distribution.
4 Results and discussion
4.1 Annual mean and seasonal trends in surface meteorology over Northeast Asia
Figure 2a illustrates the mean annual surface wind field and accumulated precipitation for 2002. China, Korea, and Japan are located over the baroclinic zone in the mid-latitudes, where the temperature gradient is steep and synoptic distur-bances are active as a driving force of transboundary air pol-lution. Throughout the year, northerly to northwesterly wind was prevailing over the Yellow Sea and the Sea of Japan. The contribution of those winds to transboundary air pol-lution in northeast Asia was substantial. Large amounts of precipitation were observed in the southern areas of the do-main, and those areas are mostly distributed in the Pacific Ocean. Inland areas of heavy local precipitation are located in the southern part of China (Region III). The precipitation was due to local cumulus convection and mostly happened in summer (June and July). Orographically forced local heavy precipitation near the coastal regions can be seen along the
northern and northeastern coast of the Japanese main island and the eastern coast of Taiwan.
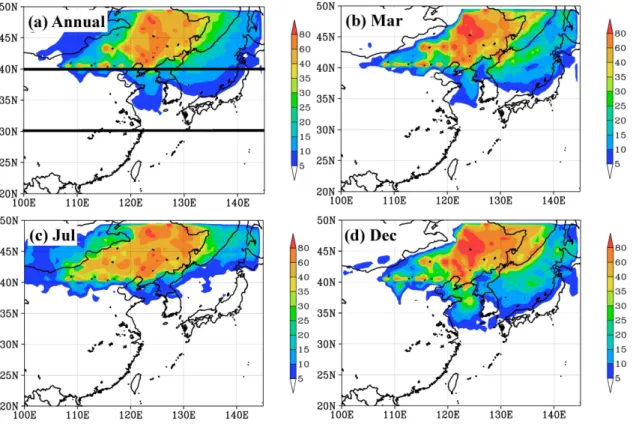
Fig. 3.Spatial distributions of(a)annual and(b–d)monthly accumulated dry deposition of total S (mg S m−2). The solid lines in(a)indicate 40◦N and 30◦N, the borders between Regions I and II and between Regions II and III, respectively.
4.2 Annual mean and seasonal trends of surface concentrations and deposition of sulfur oxides
Figure 3 illustrates the (a) annual and (b–d) monthly accumu-lated dry deposition of total S (mg S m−2). Among dry de-position of S (SO2and aerosol SO24−), SO2was predominant and contributed more than 80 % over most of the regions such as the North China Plain, the Yangtze Plain, urbanized places in Korea and Japan, the Yellow Sea, the East China Sea, and the Sea of Japan. The contribution becomes smaller over fur-ther downwind regions or regions with heavy precipitation, such as the northwest Pacific ocean (40–80 %), the northern coastal region of the Japanese main island (30–50 %), and the southern part of China (30–50 %), but the deposition amount of total S is much smaller (<200 mg S m−2annually) in those regions compared to that in the urbanized regions. Thus, the spatial distribution of total dry S deposition reflects those for the dry deposition of SO2and surface concentrations of SO2. In Sect. 3, it is discussed that modeled SO2concentrations agreed quantitatively with the observations, whereas aerosol SO24− was underestimated by 30 %. Considering this dis-crepancy, however, the main finding that dry deposition of SO2is predominant, especially near source regions, would be unchanged.
In Fig. 3, high deposition, and thus surface concentra-tions too, of SO2 were observed very close to the large
emission sources. Due to the activity of the Miyakejima Vol-cano, peaks of sulfur concentrations were observed near this area (139.53◦E, 34.081◦N). Among the four seasons, SO2 concentrations were lower in the summer due to fast pho-tochemical conversion of SO2 to sulfate and precipitation scavenging due to the high temperatures, large solar radia-tions, and high cloud activities. Cloud activities influence the heterogeneous production of sulfate because the conver-sion from SO2to sulfate takes place efficiently in cloud and rain droplets. As a result, SO2concentrations in the southern part of China were very low in July (not significant in deposi-tion fields). Turbulent mixing affects surface concentradeposi-tions in large emission source regions, substantially. During the daytime, when the mixing layer is developed, air pollutants are transported upward and the concentration within the layer becomes lower. The mixing layer height becomes larger in the summer and smaller in the winter over the inland regions due to surface heating and subsequent buoyancy effects. The effect is seen in the dry deposition field (Fig. 3b–d).
Fig. 4.Same as Fig. 3 but for the wet deposition of total S (mg S m−2).
and the source-receptor relationship. The effect could be es-timated from this simulation’s results because it is almost lin-ear due to the simple atmospheric reactions for sulfur com-pounds (i.e., when the emissions of one region are uniformly two times greater, the effects from the region on deposition in other regions can be estimated as about two times greater as well). The volcanic eruptions from Miyakejima have sub-stantially decreased in recent years and are about 1000 tons per day, 10 times smaller than those in 2002 (August, 2009; recent monitoring data provided by Dr. Kazahaya using the same method as in Kazahaya et al., 2001) and almost of the same order as other volcanoes in East Asia. The effect of this rapid change in volcanic emissions can also be roughly estimated in the SRR analysis in the same manner as the sea-sonal variations of emissions were assessed.
Figure 4 illustrates the (a) annual and (b–d) monthly ac-cumulated wet deposition of total S in mg S m−2. The wet deposition of S includes both SO2dissolved into cloud and rainwater droplets and aerosol SO24−activated as cloud con-densation nuclei (CCN) and scavenged by rainwater. Both are measured as the SO24−ion in the EANET rainwater mon-itoring samples. The wet deposition amounts appear to be smaller than the dry deposition amounts over the northeast-ern Asian region. However, as the modeled SO24− wet de-position was found to be underestimated, as discussed in Sect. 3, the wet deposition amounts could be comparable to the dry deposition amounts.
Wet deposition depends not only on surface concentrations but also on the concentrations in the entire column up to the cloud top and the water droplet mixing ratios. Wet deposition was larger in the polluted and heavy precipitation regions. The large amount of wet deposition of SO24−over the south-ern part of China in summer was related to cumulus precip-itation. As precipitation was larger in summer over northern parts of the Asian continent, the amount of wet deposition was larger in summer. Substantial amounts of deposition are found over the ocean for the wet deposition field (Fig. 4a), whereas the amount of dry depositions is relatively smaller over the ocean (Fig. 3a).
4.3 Total sulfur deposition and the source-receptor relationship
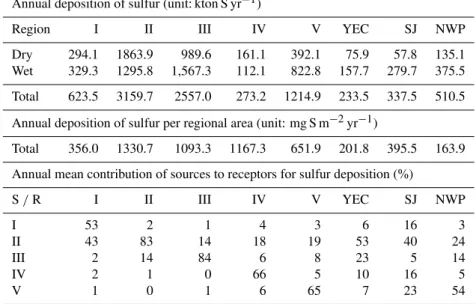
Table 4.Annual deposition (kton S yr−1and mg S m−2yr−1) of sulfur and contributions of source regions to receptor regions (%) in 2002.
Annual deposition of sulfur (unit: kton S yr−1)
Region I II III IV V YEC SJ NWP
Dry 294.1 1863.9 989.6 161.1 392.1 75.9 57.8 135.1
Wet 329.3 1295.8 1,567.3 112.1 822.8 157.7 279.7 375.5
Total 623.5 3159.7 2557.0 273.2 1214.9 233.5 337.5 510.5
Annual deposition of sulfur per regional area (unit: mg S m−2yr−1)
Total 356.0 1330.7 1093.3 1167.3 651.9 201.8 395.5 163.9
Annual mean contribution of sources to receptors for sulfur deposition (%)
S/R I II III IV V YEC SJ NWP
I 53 2 1 4 3 6 16 3
II 43 83 14 18 19 53 40 24
III 2 14 84 6 8 23 5 14
IV 2 1 0 66 5 10 16 5
V 1 0 1 6 65 7 23 54
to total S deposition in the receptor regions are described. As described before, Regions I, II, III, IV, and V indicate North China (north of 40◦N), Central China (between 40 and 30◦N), South China (south of 30◦N), South Korea, and Japan, respectively.
The annual deposition of sulfur was large in Regions II and III (3160 and 2560 kton S yr−1, respectively), where SOx emissions were large as well (6020 and 3300 kton S yr−1, re-spectively). The deposition of S in Regions II and III ac-counted for about 50 % and 75 % of the emissions of S, re-spectively. Dry deposition was larger in Region II, whereas wet deposition was predominant in Region III. The self con-tribution (defined as concon-tribution of one source region to the same receptor region) for SRR in Regions II and III were the largest among the 5 regions (83 % and 84 %, respectively), and the second largest contributions to each were from each other’s region (14 %). Thus, the two regions exchanged sul-fur with each other (together accounting for 97 % for Region II and 98 % for Region III), mainly via dry deposition to Re-gion II and wet deposition to ReRe-gion III. The contributions to Regions II and III from the other regions (I, IV, and V) were smaller than 2 %.
The deposition of S in Region I (623 kton S) was about 60 % of the emission amount in the region (1010 kton S), but more than 40 % of the S deposition was due to emissions from Region II. The contributions of dry and wet deposition were comparable in the region. The contributions from the other regions (III, IV, and V) were less than 2 %.
The deposition of S in Region IV (273 kton S) was about 50 % of the emission amount in the region (558 kton S), with the self contribution being the largest (66 %). The second largest contribution was due to emissions from Region II
(18 %). The contribution of dry deposition was somewhat larger than that of wet deposition. The contributions from the other regions (I, III and V) were not negligible (4, 6, and 6 %, respectively).
The deposition of S in Region V (1215 kton S) was about three times larger than the “anthropogenic emissions” from the region (455 kton S) and was equal to 56 % of the total emissions (i.e., anthropogenic and the Miyake volcanic emis-sions, 2188.8 kton S). The self contribution was 65 %, and the second largest contribution was due to Region II (19 %). Although a substantial amount of the deposition was from emissions from the Miyakejima volcano in Region V, the contribution of Region II to Region V was as large as that to Region IV. Because the Miyakejima Volcano is located in the east of Japan, most of its volcanic sulfur was transported east-ward due to westerlies and northwesterlies, except in summer when the Pacific High is predominant and the volcanic plume was transported west to southwestward (Kajino et al., 2004). As a result, the largest contributor to the Northwest Pacific Region (NWP) was Region V (54 %).
4.4 Total sulfur deposition to the ocean and the contributions of the source regions
sometimes overlap. Wet deposition was more predominant than dry deposition over all of the ocean regions. The largest contributor to YEC was Region II (53 %), and the second and third largest were Region III (23 %) and Region IV (10 %). The largest contributor to SJ was also Region II (40 %), and the second largest was Region V (23 %), with Regions I and IV (16 %) next in contribution size. As discussed before, the largest contributor to NWP was Region V, which accounted for 54 % of the total deposition over the region, mostly of Miyake volcanic origin. The second and third largest were Region II (24 %) and Region III (14 %).
It is difficult to evaluate the contributions of sulfur, which is not calculated in the model, such as SO2from shipping and biogenic S from ocean surfaces. SO2from international ship-ping accounted for only 5 % of that from the three Northeast Asian countries (Streets et al., 2003) and that from biogenic dimethyl sulfide (DMS) accounted for less than 5 % of that from the countries and the Miyakejima volcano (Kajino et al., 2004). However, as far as deposition over ocean is con-cerned, contributions of those S could be substantial.
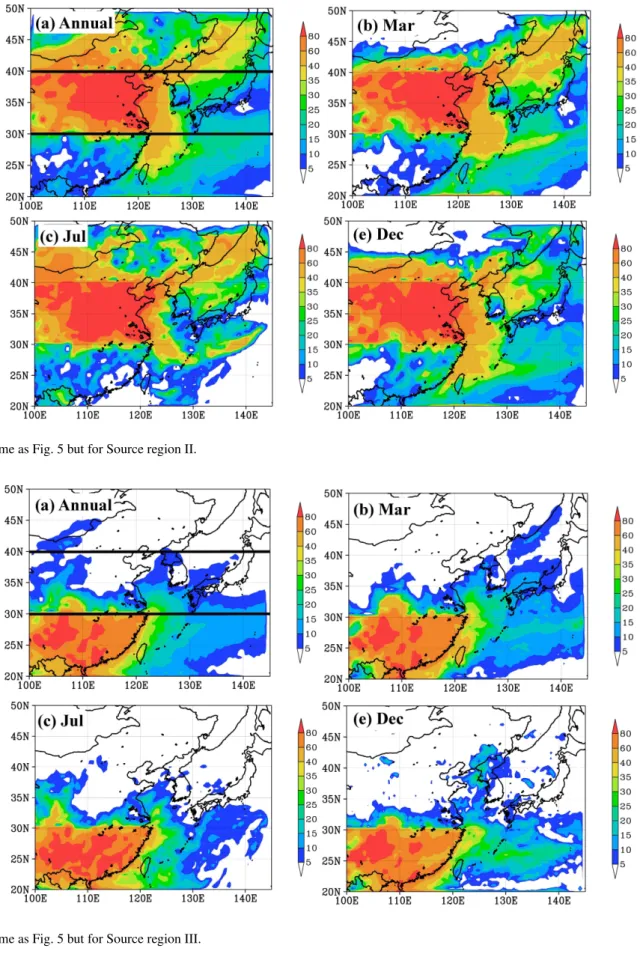
4.5 Spatial distributions of total sulfur deposition and the source-receptor relationship and its seasonal variation
Figures 5 to 9 illustrate the horizontal distributions of (a) an-nual and (b–d) monthly mean contributions of the respective source regions (I to V) to total S deposition (%). The hori-zontal features are very different than those in the SRR table. They give additional information on SRRs, such as true con-tributions for specific small subregional areas. Area averages of each receptor region and each oceanic region correspond to the values in Table 4. The solid lines in Figs. 5a, 6a, 7a, 8a, and 9a indicate 40◦N and 30◦N, the border between Regions
I and II and that between Regions II and III, respectively. Region I contributed only a few percent as a source to other receptor regions (Fig. 5). Though the regional aver-age of the contributions from Region I to Regions IV and V are less than 5 %, the Region I contributions exceeded 10 % in the northern part of Regions IV and V (Fig. 5a). As the wind pattern and precipitation vary substantially by season in northeast Asia, the SRRs vary accordingly. Figure 5 shows that the contributions from sources from Region I were sim-ilar in March and December, and the values were about 5 to 20 % in the northern part of South Korea, the coastal regions of Japan’s main island facing the Sea of Japan, and Hokkaido Island. The contribution in July over the area south of 40◦N
was smaller than 5 % due to the Pacific High, and the amount of wet deposition was substantial.
Region II was the most influential source to all regions due to its large emissions and its location under the strong influ-ences of mid-latitude disturbances and mid-latitude wester-lies (Fig. 6). The contribution of Regions II to every other region (outside of Region II) exceeded 14 %. It was smaller than 20 % in Regions III, IV, and V. The regionally averaged
contribution from Region II to Region I was 43 % (Table 4), with a maximum larger than 60 % near the border (Fig. 6a). Region V included large areas of ocean surface. The overall regionally averaged contribution from Region II to Region V was 19 %. The contribution over the coastal regions of the southwestern islands of the Japan archipelago exceeded 30 %, and that over coastal regions of the main island facing the Sea of Japan was about 20 to 30 %. Seasonal variations of the contribution from this major contributor region, Re-gion II, to the receptor reRe-gions were not very clear in the spatial distribution. A clear seasonal change was found over the ocean, especially for SJ. The contribution to the northern part of SJ was large in terms of its annual mean, spring, and summer (>60 %). In winter, however, the northerly mon-soon due to the Siberian High prevented the transport of air pollutants from Region II northward.
Region III was the second major contributing source re-gion for trans-rere-gional transport, but the contributions were not very large, generally smaller than 10 % to the other re-gions, such as I, IV, and V (Fig. 7). The southern part of Re-gion III is under the influence of the trade wind zone, and the contribution to eastern regions may not be large. Averaged over the year, the contributions of Region III to North China, South Korea, and the Japanese main islands were small, but the contribution was as large as 20–25 % over the southwest-ern islands of the Japan archipelago (Fig. 7a). The contribu-tions to Regions I, IV, and V were small throughout the year, but in spring, as the mid-latitude disturbances moved east-wards with air pollutants, the contribution to the western part of Japan was high (10–30 %, Fig. 7b).
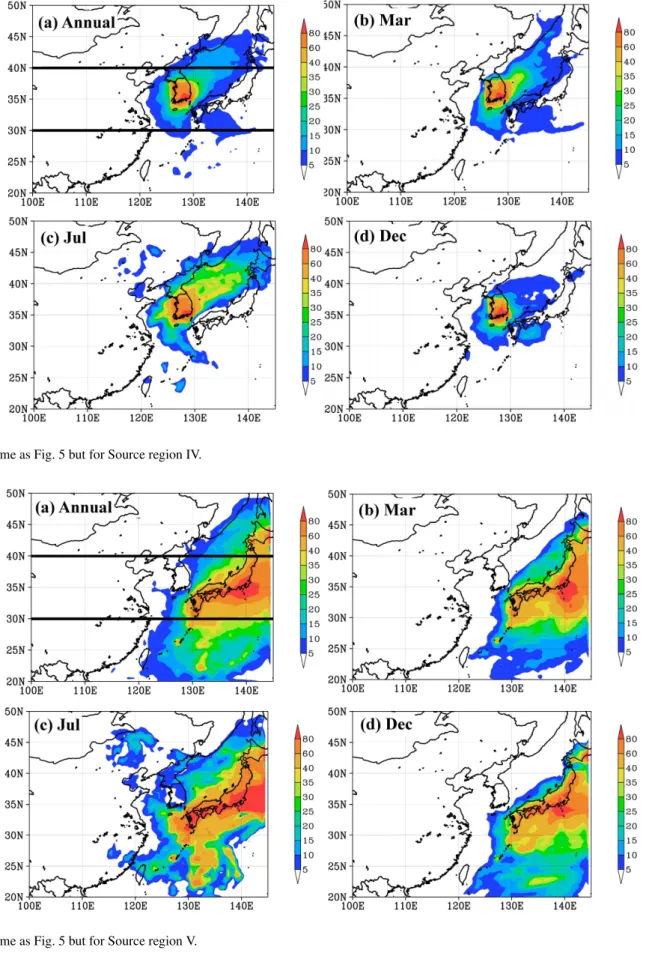
The contribution of Region IV to other regions was smaller than 2 %, except for Region V, in which it was 5 % on average (Table 4). Figure 8a shows that the deposition in Region V occurred mainly over the Sea of Japan and not over the inland area of Region V. The contribution of Region IV was largest in July. It amounted to 5–10 % in the eastern parts of Region I and 5–15 % in the northern part of Japan. The contribution to SJ was large in July.
The contribution of Region V to other regions was small (0–1 % for Regions I, II, and III, and 6 % for Region IV) on average (Table 4) as well as in its horizontal distribution (<5 % across other regions, Fig. 9a). In summer, however, under the influence of the Pacific High, the contribution was 5–15 % over some parts of Region I, 5 % of Region IV, and 10–25 % over the northern part of Taiwan and some parts of Region III.
Fig. 5. Spatial distributions of(a)annual mean contributions of Source Region I to total sulfur deposition and monthly mean values for
(b)March,(c)July, and(d)December (%). The solid lines in(a)indicate 40◦N and 30◦N, the borders between Regions I and II and between Regions II and III, respectively.
SJ was 16 % on average (Table 4), whereas it accounted for up to 30 % in the northern part of SJ (Fig. 5a). It varied by season and was 10–25 % in March and December, whereas it was smaller than 5 % over the area south of 40◦ N of SJ in July due to the influence of the Pacific High. The mean contribution of Region II to YEC was 53 % (Table 4); it was larger than 40 % in most areas of YEC and 60–80 % over the Bo Hai Sea (Fig. 6). The contribution of Region II to SJ was 40 % on average (Table 4) and was mostly deposited over the northern part (>40 %), except in winter due to the above-mentioned influence of the Siberian High (Fig. 6). Re-gion III contributed, on average, 23 % and 14 % to YEC and NWP, respectively (Table 4). The contribution was larger in the southern part of YEC, especially near the coastal region, and accounted for 10–30 % of deposition over the southern part of the Yellow Sea and 20–40 % over the East China Sea (Fig. 7). The contribution to NWP was smallest in summer because the Pacific High prevented the transport of air pol-lutants from Region III eastward (Fig. 7c). Region IV con-tributed 16 % and 10 % of the deposition over SJ and YEC, respectively (Table 4). The contribution was largest in the eastern part of the Yellow Sea (5–20 %) and the western part of SJ (5–25 %). The contribution over SJ was highest in the summer (15–40 %, Fig. 8c) because the Pacific High pre-vented airflow from the Asian continent. The contribution
of Region V to NWP and SJ was 54 % and 23 %, respec-tively (Table 4). Figure 9a shows the contribution of Region V, especially that of Miyake volcanic origin, was larger over NWP (up to 80 %) and SJ near the coastal region of the Japan Archipelago (35–60 %). Figure 9b–d shows the contribution to SJ was 20–30 % in the eastern part in March, 10–60 % over the whole region in July, and 5–30 % near the coast in December. The contribution to YEC was largest in July, ac-counting for 5–35 % in the eastern and southern parts of the ocean area (Fig. 9c).
Fig. 6.Same as Fig. 5 but for Source region II.
Fig. 8.Same as Fig. 5 but for Source region IV.
highly nonlinear components such as nitrogen compounds, O3and PMs among the Northeast Asian countries, by fol-lowing the EMEP modeling works (Nyiri et al., 2010). In this case, it is indispensiblae to implement temporal varia-tions in emission fluxes and to utilize 15 or 20 % reduction method instead of full reduction for the accurate assessment of SRR for those reactive components.
5 Conclusions
Spatial distributions of the source-receptor relationships (SRRs) of sulfur over northeast Asia were examined us-ing a chemical transport model, Regional Air Quality Model (RAQM). RAQM was driven by the meteorological fields predicted using the Mesoscale Meteorological Model (MM5). The RAQM model was developed at the Asia Center for Air Pollution Research (ACAP), formerly the Acid De-position and Oxidant Research Center (ADORC). The emis-sion inventory used in this study was developed by the Long-range Trans-boundary Air Pollutants in Northeast Asia (LTP project) of Tripartite Environment Ministers Meeting among Japan, China and Korea (TEMM).
The simulation was conducted for the entire year of 2002. Simulation results were evaluated using monitoring data from six remote stations of the Acid Deposition Monitoring Network in East Asia (EANET). The modeled SO2 and O3 concentrations agreed well with observations quantitatively. The modeled aerosol SO24−was underestimated by 30 %, but the correlation coefficient was large (R=0.80). The mod-eled wet deposition flux of SO24− was generally underesti-mated by about 50 %, with some exceptions of overestima-tion.
The domain was divided into five source-receptor regions: I, North China; II, Central China; III, South China; IV, South Korea; and V, Japan. The deposition over the oceanic regions was also assessed and the oceanic areas were divided into three regions: YEC, the Yellow Sea and East China Sea; SJ, the Sea of Japan; and NWP, the Northwest Pacific Ocean.
The sulfur deposition in each receptor region amounted to about 50–75 % of the emissions from the same region. Dry deposition dominated over wet deposition in Regions II and IV, whereas wet deposition dominated in Regions I, III, and V, and all of the ocean regions. The largest contribution to the deposition in each region was originated from the same region, accounting for 53–84 % of deposition. The second largest contribution was due to Region II, accounting for 14– 43 %, outside Region II itself. The second largest contribu-tion to Region II was Region III. Thus, the two regions ex-changed sulfur with each other, mainly via dry deposition to Region II and wet deposition to Region III. The largest contributions to YEC and SJ were from Region II (53 % and 40 %, respectively), whereas that to NWP was from Region V (54 %), which was mostly of Miyakejima volcanic ori-gin. The second largest contribution to YEC was Region III
(23 %), that to SJ was Region V (23 %), and that to NWP was Region II (24 %).
The horizontal distribution of SRRs revealed that subre-gional values varied about a factor of two from the resubre-gionally averaged values. This variation was due to nonuniformity of the deposition field. It was found to be important to exam-ine the spatial distribution fields to identify subregional areas where deposition was highest within a region. The horizontal distribution changed substantially by season. Deposition and SRR features in summer were different than those in spring and winter, due to larger precipitation and different wind pat-terns in summer. Westerly to northwesterly winds prevailed over the northeast Asian regions throughout the year, except in summer when southerly to southeasterly winds prevailed under the influence of the Pacific High.
Acknowledgements. This research was promoted by the joint research on Long-range Trans-boundary Air Pollutants in North-east Asia (LTP project) and Tripartite Environment Ministers Meeting among Japan, China and Korea (TEMM). This research was supported by the Environment Research and Technology Development Fund (Project No. B-0905) of the Ministry of the Environment, Japan and the Grant-in-Aid for JSPS Fellows (Project No. 07J01611) of Japan Society for the Promotion of Science (JSPS).
Edited by: E. Vignati
References
An, J., Ueda, H., Wang, Z., Matsuda, K., Kajino, M., and Cheng, X.: Simulations of monthly mean nitrate concentrations in pre-cipitation, Atmos. Environ., 36, 4159–4171, 2002.
An, J., Ueda, H., Matsuda, K. Hasome, H., and Iwata, M.: Sim-ulated impacts of SO2emissions from the Miyake volcano on concentration and deposition of sulfur oxides in September and October of 2000, Atmos. Environ., 37, 3039–3046, 2003. Atkinson, R., Lloyd, A. C., and Winges, D.: An updated chemical
mechanism for hydrocarbon/NOx/SO2photooxidations suitable for inclusion in atmospheric simulation models, Atmos. Envi-ron., 16, 1341–1355, 1982.
Betts, A. K.: A new convective adjustment scheme. Part I: Obser-vational and theoretical basis, Q. J. Roy. Meteorol. Soc., 112, 677–692, 1986.
Betts, A. K. and Miller, M. J.: A new convective adjustment scheme. Part II: Single column tests using GATE wave, BOMEX, ATEX and Arctic air-mass data sets, Q. J. Roy. Meteorol. Soc., 112, 693–709, 1986.
Byun, D. W. and Dennis, R.: Design artifacts in Eulerian air quality models: Evaluation of the effects of layer thickness and vertical profile correction on surface ozone concentrations, Atmos. Env-iron. 29, 105–126, 1995.
Carmichael, G. R., Uno I., Phadnis, M. J., Zhang, Y., and Young, S. W.: Tropospheric ozone production and transport in spring time in East Asia, J. Geophys. Res., 103, 10649–10671, 1998. Carmichael, G. R., Calori, G., Hayami, H., Uno, I., Cho, S. Y.,
En-gardt, M., Kim, S.-B., Ichikawa, Y., Ikeda, Y., Woo, J.-H., Ueda, H., and Amann, M.: The MICS-Asia study: model intercompar-ison of long-range transport and sulfur deposition in East Asia, Atmos. Environ., 36, 175–199, 2002.
Carmichael, G. R., Sakurai T., Streets D., Hozumi Y., Ueda H., Park S. U., Fung C., Han Z., Kajino M., Engardt M., Bennet C., Hayami H., Sartelet K., Holloway T., Wang Z., Kannari A., Fu J., Matsuda K., Thongboonchoo N., and Amann, M.: MICS-Asia II: The Model Intercomparison Study for Asia Phase II Method-ology and Overview of Findings, Atmos. Environ., Special Issue: MICS-ASIA II, 42, 3468–3490, 2008.
Chameides, W. L. and Stelson, A. W.: Aqueous-phase chemical processes in deliquescent sea-salt aerosols: a mechanism that couples the atmospheric cycles of S and sea salt, J. Geophys. Res., 97, D18, 20565–20580, 1992.
Chang, J. S., Brost, R. A., Isaksen, I. S. A., Madronich, S., Middle-ton, P., Stockwell, W. R., and Walcek, C. J.: A three-dimensional Eulerian acid deposition model: Physical concepts and formula-tion, J. Geophys. Res., 92, 14681–14700, 1987.
Choi, K.-D., Kim, J.-S., and Kim, B.-G.: Annual Report for the 1st year’s Joint Research on Long-Range Transboundary Air Pollu-tants in Northeast Asia, Secretariat of Working Group for LTP Project, NIER, Korea, 121 pp., 2001.
DeFries, R. S. and Townshend, J. R. G: NDVI-derived land cover classification at global scales, Int. J. Remote Sens., 15, 3567– 3586, 1994.
Gery, M. W., Whitten, G. Z., Killus, J. P., and Dodge, M. C.: A photochemical kinetics mechanism for urban and regional scale computer modeling, J. Geophys. Res., 94, 12925–12956, 1989. Grell, G. A., Dudhia, J., and Stauffer, D. R.: Description of the Fifth
Generation Penn state/NCAR Meso-scale Model (MM5), NCAR Technical Note, NCAR/Tn-398+STR, CO, USA, 1994. Han, Z.: A regional air quality model: Evaluation and simulation of
O3and relevant gaseous species in East Asia during spring 2001, Environ. Modell. Software, 22, 1328–1336, 2007.
Han, Z., Ueda, H., Matsuda, K., Zhang, R., Arao, K., Kanai, Y., and Hasome, H.: Model study on particle size segregation and deposition during Asian dust events in March 2002, J. Geophys. Res., 109, D19205, doi:10.1029/2004JD004920, 2004.
Han, Z., Ueda, H., and Matsuda, K.: Model study of the impact of biogenic emission on regional ozone and effectiveness of emis-sion reduction scenarios over eastern China, Tellus 53B, 171– 191, 2005.
Han, Z., Ueda, H., and Sakurai, T.: Model study on acidifying wet deposition in East Asia during wintertime, Atmos. Environ., 40, 2360–2373, 2006.
Han, Z., Sakurai, T., Ueda, H., Carmichael, G. R., Streets, D., Hayam, H., Wang, Z., Holloway, H., Engardt, M., Hozumi, Y., Park, S. U., Kajino, M., Sartelet, K., Fung, C., Bennet, C., Thongboonchoo, N., Tang, Y., Chang, A., Matsuda, K., and Amann, M.: MICS-Asia II: Model intercomparison and evalu-ation of ozone and relevant species, Atmos. Environ., Special Issue: MICS-ASIA II, 42, 3491–3509, 2008.
He, D. and Huang, M.: A numerical study on tropospheric ozone over China, Atmos. Environ., 30, 2449–2451, 1996.
Hong, S.-Y. and Pan, H. L.: Nonlocal boundary layer vertical diffu-sion in a Medium-Range Forecast Model, Month. Weather Rev., 124, 2322–2339, 1996.
Hylland, K.: Polycyclic Aromatic Hydrocarbon (PAH) ecotoxicol-ogy in marine ecosystems, J. Toxicol. Environ. Health, Part A, 69, 109–123, 2006.
Kajino, M. Ueda, H., Satsumabayashi, H., and An, J.: Im-pacts of the eruption of Miyakejima Volcano on air qual-ity over far east Asia, J. Geophys. Res., 109, D21204, doi:10.1029/2004JD004762, 2004.
Kajino, M. Ueda, H., Satsumabayashi, H., and Han, Z.: Increase in nitrate and chloride deposition in East Asia due to increased sulfate associated with the eruption of Miyakejima Volcano, J. Geophys. Res. 110, D18203, doi:10.1029/2005JD005879, 2005. Kazahaya, K.: Volcanic gas study of the 2000 Miyakejima volcanic activity: degassing environment deduced from adhered gas com-ponent on ash and SO2emission rate, J. Geogr., 110, 271–279, 2001 (in Japanese).
Kim, C.-H., Chang, L.-S., Kim, J.-S.., Meng, F., Kajino, M., Ueda, H., Zhang, Y., Son, H.-Y., He, Y., Xu, J., Sato, K., Song, C.-K., Ban, S.-J., Sakurai, T., Han, Z., Duan, L., Lee, S.-J., Shim, S.-G., Young, S., and Lee, T.-Y.: Long-term simulations of the sulfur concentrations over the China, Japan and Korea: A model comparison study, Asia-Pac. J. Atmos. Sci., in press, 2011. Lin, M., Oki, T., Bengtsson, M., Kanae, S., Holloway, T., and
Streets, D. G.: Long-range transport of acidifying substances in East Asia – Part II Source-receptor relationships, Atmos. Envi-ron., 42, 5956–5967, 2008.
Livingstone, D. R.: The fate of organic xenobiotics in aquatic ecosystems: quantitative and qualitative differences in biotrans-formation by invertebrates and fish, Comp. Biochem. Physiol, 120, 43–49, 1998.
Luo, C., John, J. C. St., Zhou, X. J., Lam, K. S., Wang, T., and Chameides, W. L.: A nonurban ozone air pollution episode over eastern China: Observations and model simulations, J. Geophys. Res., 105, 1889–1908, 2000.
Madronich, S.: Photodissociation in the atmosphere, 1. Actinic flux and the effects of ground reflections and clouds, J. Geophys. Res., 92, 9740–9752, 1987.
Nagashima, T., Ohara, T., Sudo, K., and Akimoto, H.: The rela-tive importance of various source regions on East Asian surface ozone, Atmos. Chem. Phys., 10, 11305–11322, doi:10.5194/acp-10-11305-2010, 2010.
Nenes, A., Pandis, S. N., and Pilinis, C.: ISORROPIA: A new ther-modynamic equilibrium mode for multiphase multicomponent inorganic aerosols, Aquat. Geoch., 4, 123–152, 1998.
Nyiri, A., Gauss, M., and Klein, H.: Transboundary data by main pollutants (S, N, O3) and PM, Country reports 2010 MSC-W Data Note 1/2010, ISSN 1890-0003, 2010.
Ohara, T., Akimoto, H., Kurokawa, J., Horii, N., Yamaji, K., Yan, X., and Hayasaka, T.: An Asian emission inventory of anthropogenic emission sources for the period 1980–2020, At-mos. Chem. Phys., 7, 4419–4444, doi:10.5194/acp-7-4419-2007, 2007.
Suzuki, N., Hayakawa, K., Kameda, T., Toriba, A., Tang, N., Tabata, M. J., Takada, K., Wada, S., Omori, K., Srivastav, A. K., Mishima, H., and Hattori, A.: Monohydroxylated polycyclic aromatic hydrocarbons inhibit both osteoclastic and osteoblastic activities in teleost scales, Life Sciences, 84, 482–488, 2009. Streets, D. G., Bond, T. C., Carmichael, G. R., Fernandes, S. D.,
Fu, Q., He, D., Klimont, Z., Nelson, S. M., Tsai, N. Y., Wang M. Q., Woo, J.-H., and Yarber, K. F.: An inventory of gaseous and primary aerosol emissions in Asia in the year 2000, J. Geophys. Res., 108, D218809, doi:10.1029/2002JD003093, 2003. Tang, Y., Carmichael, G. R., Kurata, G., Uno, I., Weber, R. J., Song,
C. -H., Guttikunda, S. K., Woo, J-. H., Streets, D. G., Wei, C., Clarke, A. D., Huebert, B., and Anderson, T. L.: Impacts of dust on regional tropospheric chemistry during the ACE-Asia exper-iment: A model study with observations, J. Geophys. Res., 109, D19S21, doi:10.1029/2003JD003806, 2004.
Walcek, C. J. and Aleksic, N. M.: A simple but accurate mass con-servative peak-preserving, mixing ratio bounded advection algo-rithm with Fortran code, Atmos. Environ., 32, 3863–3880, 1998.
Walcek, C. J., Brost, R. A., Chang, J. S., and Wesely, M. L.: SO2, sulfate and HNO3deposition velocities computed using regional landuse and meteorological data, Atmos. Environ., 20, 949–964, 1986.
Walmsley, J. L. and Wesely, M. L.: Modifiction of coded parameter-izations of surface resistances to gaseous dry deposition, Atmos. Environ., 30, 1181–1188, 1996.
Wang, Z., Xie, F., Sakurai T., Ueda H., Han, Z., Carmichael, G. R., Streets, D., Engardt, M., Holloway, T., Hayami, H., Kajino, M., Thongboonchoo, N., Bennet, C., Park, S. U., Fung, C., Chang, A., Sartelet, K., and Amann, M.: MICS-Asia II: Model Inter-comparison and evaluation of acid deposition, Atmos. Environ., Special Issue: MICS-ASIA II, 42, 3528–3542, 2008.