R E S E A R C H A R T I C L E
Open Access
Health impact assessment of air pollution in
megacity of Tehran, Iran
Kazem Naddafi
1,2, Mohammad Sadegh Hassanvand
1,2*, Masud Yunesian
1,2, Fatemeh Momeniha
1,3,
Ramin Nabizadeh
1,2, Sasan Faridi
1and Akbar Gholampour
1Abstract
The aims of the present study were to provide quantitative data on the impact of air pollution on the health of people living in Tehran city, the most populated city of Iran. The approach proposed by the World Health Organization (WHO) was applied using the AirQ 2.2.3 software developed by the WHO European Centre for Environment and Health, Bilthoven Division. Concentrations of ozone, nitrogen dioxide, sulfur dioxide and particulate matter of aerodynamic diameter≤10μm (PM10) were used to assess human exposure and health impacts in terms of attributable proportion of the health outcome, annual number of excess cases of mortality for all causes, and cardiovascular and respiratory diseases. The annual average of PM10, SO2, NO2and O3in Tehran were 90.58, 89.16, 85 and 68.82μg/m3, respectively. Considering short-term effects, PM10had the highest health impact on the 8,700,000 inhabitants of Tehran city, causing an excess of total mortality of 2194 out of 47284 in a year. Sulfur dioxide, nitrogen dioxide and ozone caused about, respectively, 1458, 1050 and 819 excess cases of total mortality. Results indicate that the magnitude of the health impact estimated for the city of Tehran underscores the need for urgent action to reduce the health burden of air pollution.
Keywords:Tehran air pollution, Air Q software, Health impact assessment, Mortality, Morbidity
Introduction
Exposure to air pollution can cause both acute (short-term) and chronic (long-(short-term) health effects. The acute effects of air pollution on human health were amply proven in the 20th century, when severe air pollution in Europe (Meuse Valley and London) and in the United States (Donora, Pa) caused deaths and disease in hun-dreds of thousands of people [1,2]. This episode has demonstrated that high concentrations of air pollution lead to an increase in mortality [2] and morbidity. In later studies, investigators found that levels below even current air pollution guidelines are associated with ad-verse effects on health [3-13] and air quality standards may not be protective enough for the most sensitive groups [14]. In addition, even though pollution due to combustion fuels has fallen dramatically in recent years, emerging pollutants such as O3 and NOX, and changes
in the composition and size distribution of particulate matter, have become important in the health effects of air pollution [3,15].
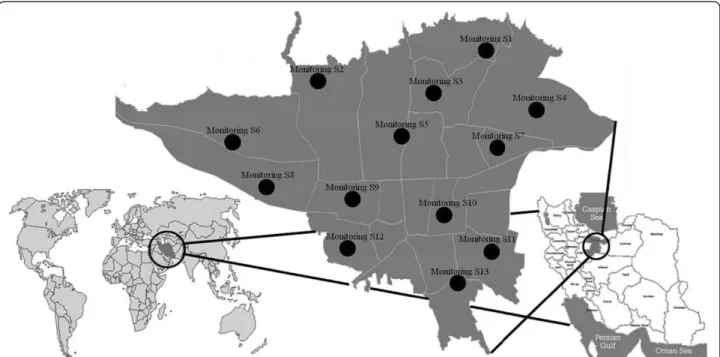
The present study assessed the health impact of air quality on the residents of Tehran, the capital city of Iran, the largest urban area of Iran with a population of 8,700,000 in 2011 (Figure 1) [16]. The city also is ranked as one of the largest cities in Western Asia and 19th in the whole world. As in other large cities, Tehran is faced with serious air quality problems. In general, 20% of the total energy of the country is consumed in Tehran. Pol-lutants such as PM10, SO2, NO2, HC, O3and CO are the major air pollutants in Tehran, about 80-85% of which is produced by mobile sources of pollution [8].
The city has a capacity for 700,000 registered cars yet 3 million roam its streets on a daily basis. Compounding Tehran’s air pollution problem is its geographical loca-tion. With the location of 35° 41' N - 51° 25' E and alti-tude of 1000–1800 meters above mean sea level, Tehran is located in valleys and is surrounded on the north, northwest, east and southeast by high to medium high (3800–1000 m) mountain ranges. The mountain range * Correspondence:[email protected]
1
Department of Environmental Health Engineering, School of Public Health, Tehran University of Medical Sciences, Tehran, Iran
2Center for Air Pollution Research (CAPR), Institute for Environmental
Research (IER), Tehran University of Medical Sciences, Tehran, Iran Full list of author information is available at the end of the article
stops the flow of the humid wind to the main capital and prevents the polluted air from being carried away from the city. Thus, during winter, the lack of wind and cold air causes the polluted air to be trapped within the city.
These concomitant conditions make Tehran as one of the worst areas in the world for atmospheric pollution with many days exceeding air quality standards during each year [17]. Because of the air pollution in the Great Tehran area, morbidity, mortality and symptoms emerge. At the moment, the concentration of these pol-lutants is higher than the standard level most of the time which means that they have numerous effects on the health of Tehran citizens [8].
Up to now the human health endpoints of air pollu-tion has not been quantified in Tehran. The main aim of this study was the quantification of the short-term health effect of air pollutants for people living in Tehran, by using World Health Organization (WHO) approach.
Materials and methods
AirQ software
The approach proposed by the WHO was adopted using the Air Quality Health Impact Assessment (AirQ 2.2.3) software developed by WHO European Centre for Envir-onment Health, Bilthoven Division. This program is used to estimate the impact of exposure to specific at-mospheric pollutants on the health of people living in a certain period and area. The assessment is based on the attributable proportion (AP), defined as the fraction of the health outcome in a certain population attributable to exposure to a given atmospheric pollutant, assuming
a proven causal relation between exposure and health outcome and no major confounding effects in that asso-ciation. The AP can be easily calculated by the following general formula [18]:
AP¼Σf½RRð Þc 1 P cð Þg
Σ½RRð Þ c P cð Þ ð1Þ
Where AP is the attributable proportion of the health outcome, RR is the relative risk (RR) for a given health outcome, in category “c” of exposure, obtained from the exposure–response functions derived from epidemio-logical studies and P(c) is the proportion of the popula-tion in category“c”of exposure.
If the baseline frequency of the health outcome in the population under investigation is known, the rate attrib-utable to the exposure can be calculated as
IE¼IAP ð2Þ
Where IE is the rate of the health outcome attributable to the exposure and I is the baseline frequency of the health outcome in the population under investigation.
Finally, knowing the size of the population, the num-ber of cases attributable to the exposure can be esti-mated as follows:
NE¼IEN ð3Þ
Where NE is the number of cases attributed to the ex-posure andNis the size of the population investigated.
RR gives the increase in the probability of the adverse effect associated with a given change in the exposure
levels, and comes from time-series studies where day-to-day changes in air pollutants over long periods were related to daily mortality, hospital admissions and other public health indicators. RR values used in the present assessment are shown in Table 1. The RR values used for PM10 were summary estimates derived from a quan-titative meta-analysis of peer-reviewed studies focused on European investigations [19], while for SO2 the RR implemented in the software and proposed as summary estimate in the WHO Air Quality Guidelines for Eur-ope [20] was used. Finally, for O3 and NO2 the RR values came directly from published studies on short-term effects within the Air Pollution and Health: a European Approach (APHEA) project [21,22]. The baseline rates of all mortality for the calendar year 2010 were obtained from death certificates recorded at the Civil Registration Office of Tehran. For hospital admis-sions, the baseline rates that proposed by WHO were used.
Exposure assessment
Air concentrations of the selected pollutants in the area of interest were measured by Tehran Air Quality Control Corporation (TAQCC), Iran, using 25 perman-ent monitoring stations (Figure 1). Finally, the air
pollutants data from the permanent monitoring station of Tehran city from January 2010 to January 2011 year were used.
There are 25 stations for the measurement of air pol-lution in Tehran, but some of them, based on WHO Criteria for Air Quality Health Impact Assessment, had an invalid data for assessment. Finally, data from 7, 10, 11, 13 and 13 stations located in north, west, south and central parts of Tehran that were consistently active dur-ing the study period for, respectively, PM10, SO2, NO2 and O3, were used.
For all the pollutants, the parameters required by the software (annual and seasonal maximum and annual 98th percentiles) were obtained and concentrations were recorded to 10 μg/m3 categories, corresponding to
equivalent exposure categories. For O3, data were expressed as an 8 h“moving average”; for NO2, as a 1 h average concentrations and for SO2 and PM10 as daily averages.
Exposure was estimated considering the city of Tehran as single agglomerate, with a residential population 8,700,000 people. The software assumes that concentra-tions measured are representative of the average expos-ure of the people. For example, if on 5% of sampling days concentrations were between 10 and 20 μg/m3, it
Table 1 Relative risk (RR) with 95% confidence intervals (95% CI), and corresponding reference, implemented in AirQ 2.2.3 software and used for the health effect estimates
Health endpoint Incidencea RR (95% CI) per 10μg/m3
O3 NO2 PM10 SO2
Mortality Total ICD-9-cmb <800
543.5 1.003
(1.002–1.005)e [21]
1.003 (1.002–1.004)c
[22]
1.006 (1.004–1.008)d
[19]
1.004 (1.003-1.0048)
[23] Cardiovascular
ICD-9-cm 390–459
231 1.005
(1.002–1.007)e [21]
1.004 (1.003–1.005)c
[22]
1.009 (1.005–1.013)d
[19]
1.008 (1.002-1.012)
[24] Respiratory
ICD-9-cm 460–519
48.4 1.013
(1.007–1.015)e [21]
- 1.013
(1.005–1.020)d [19]
1.01 (1.006-1.014)
[24] Morbidity HAfRespiratory
Disease
1260 - - 1.008
(1.0048-1.0112) [20]
-HA COPDg 101.4 - 1.0026
(1.0006-1.0044) [22]
1.0044 (1–1.011)
[25] HA
cardiovascular disease
436 - - 1.009
(1.006-1.013) [26]
-Acute myocardial
infarction
132 - - - 1.0064
(1.0026-1.0101) [27] aCrude rate per 100,000 inhabitants.
bInternational Classification of Diseases, 9th Revision, Clinical Modification (ICD-9-cm). c
1 h average.
dDaily average. e8 h“moving average”. fHospital admissions. g
was assumed that people were exposed to the corre-sponding concentration for 5% of their time.
Results
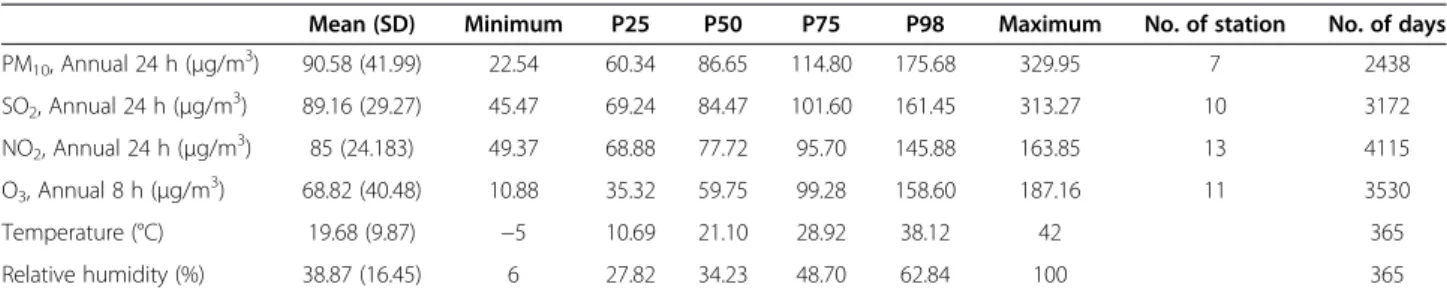
Table 2 shows the summary of the statistics of environ-mental data in Tehran.
The highest PM10 concentration was detected in the summer period with maximum value of 329.95 μg/m3.
For O3 the maximum 8 h average concentration was 187 μg/m3 detected as expected in summer, while the
maximum NO2 and SO2 concentrations, respectively, 163.85 and 313.27μg/m3were detected in winter.
The obtained results show that annual average of PM10 in Tehran was 1.3 times the world’s average
(71 μg/m3) [17] and 4.5 times the guideline values
pre-scribed by the WHO [28]. Also the annual average of NO2 in Tehran was 2.1 times the guideline value pre-scribed by the WHO [28].
Figure 2A–D illustrates the concentrations of different pollutants and the percentage of time to which people were exposed to these concentrations. The data were used to estimate the short- term effects.
The short-term health impacts of exposure to PM10, SO2, NO2and O3 above a reference value of 10 μg/m3
are shown in Table 3. The figures represent the esti-mated AP and number of excess cases in comparison to the cases if concentration values of the pollutants were 10μg/m3. For O3, the numbers of excess cases over total
Table 2 Summary of the concentrations of air pollutants, and meteorological variables, Tehran (2010–2011)
Mean (SD) Minimum P25 P50 P75 P98 Maximum No. of station No. of days
PM10, Annual 24 h (μg/m3) 90.58 (41.99) 22.54 60.34 86.65 114.80 175.68 329.95 7 2438
SO2, Annual 24 h (μg/m3) 89.16 (29.27) 45.47 69.24 84.47 101.60 161.45 313.27 10 3172
NO2, Annual 24 h (μg/m3) 85 (24.183) 49.37 68.88 77.72 95.70 145.88 163.85 13 4115
O3, Annual 8 h (μg/m3) 68.82 (40.48) 10.88 35.32 59.75 99.28 158.60 187.16 11 3530
Temperature (°C) 19.68 (9.87) −5 10.69 21.10 28.92 38.12 42 365
Relative humidity (%) 38.87 (16.45) 6 27.82 34.23 48.70 62.84 100 365
No. Station: number of monitoring stations with valid observations. No. days: number of days with valid observations.
0 2 4 6 8 10 12
% Person-days
Concentration for PM10(µg/m3)
A
0 2 4 6 8 10 12 14 16 18 20
% Person-days
Concentration for SO2(µg/m3)
B
0 2 4 6 8 10 12 14
% Person-days
Concentration for O3(µg/m3)
C
0 5 10 15 20 25 30
% Person-days
Concentration for NO2 (Daily Ave) (µg/m3)
D
mortality, cardiovascular and respiratory mortality (Table 3) were based on the RR values from the APHEA-2 project, which investigated health effects of ambient O3in 23 European cities/areas for at least three years [21]. For NO2 the estimated short-term effects (Table 3) are based on the pooled estimates for the in-crease in mortality associated with an inin-crease of 10μg/
m3 in 30 European cities participating in the APHEA-2 project [22].
Discussion
This paper offers a study case using the WHO approach to assess the impact of atmospheric pollution on human health for people living in Tehran, one of the most populated areas in the world, where the geographical features make the air quality among the worst in the world. The impact was estimated as the increase in all-causes, cardiovascular and respiratory mortality, and hospital admissions for cardiovascular and respiratory diseases, COPD and acute myocardial Infarction for short-term exposure.
Considering short-term effects, PM10 had the greatest health impact on the 8,700,000 inhabitants of Tehran city, causing an excess of total mortality of 2,194 out of 47,284 people in a year. The effect of SO2, NO2and O3 on total mortality was an excess of about, respectively, 1458, 1050 and 819 cases in a year.
The AirQ software has been used by other investiga-tors to assess the human health impact of PM2.5 [15,29] or PM10 [30]. [15] estimated the human health risk in relation to air quality in two municipalities in an indus-trialized area of Northern Italy, the authors found that PM2.5had the highest health impact on the 24,000 inha-bitants of the two small towns, causing an excess of total mortality of 8 out of 177 in a year; also Ozone and nitro-gen dioxide each caused about three excess cases of total mortality. [30] focused on short-term effects of PM10 in Trieste (about 200,000 inhabitants), a city in north-east Italy; For PM10 concentrations above 20 μg/m3, 52, 28
and 6 cases in excess, respectively, were estimated for total, cardiovascular and respiratory mortality. These fig-ures, if normalized to the population in Tehran (8,700,000 inhabitants), would result in a number of ex-cess cases very similar to those reported for PM10 in Table 2.
In another study, [31] found in Milan (1,308,000 inha-bitants), a big industrial city in the Po Valley, the central estimate of the number of excess cases attributable to PM10was 677 for total mortality. In a study of PM10and O3 impact on human health in 13 Italian cities, with about nine million inhabitants during the period 2002– 2004, [32] it was reported that on average 8220 deaths a year, excluding accidental causes, were attributable to PM10 above 20 μg/m3. For O3the effect was estimated at 516 extra deaths yearly. For short-term effects Table 3 Estimated attributable proportion (AP) expressed as percentage and number of excess cases in a year due to short-term exposure above 10μg/m3for PM10, SO2, O3and NO2
Health Endpoints Air pollutants AP (uncertainty range)a No. of excess cases (uncertainty range)a
Total mortality PM10 4.6 (3.14-6) 2194 (1486–2880)
SO2 3 (2.33-3.67) 1458 (1102–1739)
NO2 2.2 (1–2.93) 1050 (705–1389)
O3 1.73 (1.16-2.85) 819 (549–1349)
Cardiovascular mortality PM10 6.8 (3.89-9.35) 1367 (738–1916)
SO2 5.98 (1.56-8.7) 1202 (315–1751)
NO2 2.93 (2.22-3.64) 591 (446–733)
O3 2.85 (1.16-3.95) 574 (233–794)
Respiratory mortality PM10 9.53 (3.89-13.95) 402 (164–588)
SO2 7.73 (4.55-10) 310 (192–422)
O3 7 (3.4-8) 299 (143–341)
Hospital Admissions Cardiovascular Disease PM10 6.8 (4.64-9.53) 2580 (1760–3617)
Hospital Admissions Respiratory Disease PM10 6.09 (3.74-8.32) 6677 (4107–9126)
Hospital Admissions COPD NO2 2.79 (0.3-6.64) 247 (27–586)
O3 4.80 (2.52-7.09) 424 (222–626)
SO2 3.38 (0–8.04) 298 (0–710)
Acute Myocardial Infarction SO2 4.84 (2.02-7.43) 556 (233–854)
NO2 2.65 (1.12-5.97) 305 (129–687)
exposure to PM10 above 20 μg/m3 was responsible for
1372 extra deaths.
Results obtained from studies of health effects of air pollution in various parts of the world differ. Particulate matter is the pollutant with the biggest health effects in all of these papers, including the present study.
This study has several limitations. One of the limita-tions of this approach is that the health impact focuses on individual compounds without considering the simul-taneous exposure to several, which is what actually occurs [15]. The health effects of atmospheric pollution are indeed the consequence of interactions between dif-ferent air contaminants, and between these and other compounds of natural origin. Generally, in quantitative assessments of health effects, the interactions between different contaminants are not investigated as it would require a good knowledge of the mechanisms of toxicity for the different compounds, which is rarely available. In order to take account of co-exposure to different pollu-tants, it is often assumed that the health effects of indi-vidual compounds are additive. However the simple addition of the effects of the single pollutants would not be right because atmospheric pollutants are usually positively related.
A further limitation related to the exposure assessment is that the approach assumes that concentrations mea-sured in specific sampling points are representative of the average exposure suffered from people living in Tehran. Another limitation is due to the RR estimates derived in studies of different populations in comparison to the one under investigation. In particular, while for PM10, SO2, NO2and O3the RRs were mainly based on studies on the European population. The transferability of the mortality effect estimates from the evidentiary (e.g., the US cohort) to the target population, however, is feasible if no compelling evidence that the target popula-tion and the evidentiary populapopula-tion differ in the response to the air pollution [33].
Conclusion
In conclusion, this study applied the AirQ software and the approach proposed by the WHO to provide quanti-tative data on the impact of PM10, SO2, NO2and O3on the health of people living in a certain area. The results are in line with those of other investigations and, despite the limitations, which are in common to similar studies, indicate that this method offers an effective and easy tool, helpful in decision-making.
The magnitude of the health impact estimated for the city of Tehran underscores the need for urgent action to reduce the health burden of air pollution. Local author-ities, through policies that aim mainly to reduce emis-sions from urban transport and energy production, can achieve sizeable health gains.
Competing interests
The authors declare that they have no competing interests.
Authors’contributions
KN drafted the parts of the manuscript. MSH carried out the data processing, analysis of data by AirQ software and finalized the manuscript. MY carried out the some of a processing data. FM gathered the some of air quality data, population data and processed the some of data by Excell. RN drafted the parts of the manuscript. SF gathered the some of air quality data,population data and processed the some of data by Excell. AG gathered the some of air quality data,population data and processed the some of data by Excell. All authors read and approved the final manuscript.
Acknowledgements
The authors wish to thank Tehran University of Medical Sciences (grant number #11956) and the Institute for Environmental Research (IER) for their financial support for conduct of this study. We also thank Tehran Air Quality Control Corporation for providing us with pollutants concentrations data.
Author details
1Department of Environmental Health Engineering, School of Public Health,
Tehran University of Medical Sciences, Tehran, Iran.2Center for Air Pollution Research (CAPR), Institute for Environmental Research (IER), Tehran University of Medical Sciences, Tehran, Iran.3Center for Solid Waste Research (CSWR), Institute for Environmental Research (IER), Tehran University of Medical Sciences, Tehran, Iran.
Received: 28 November 2012 Accepted: 1 December 2012 Published: 17 December 2012
References
1. Ciocco A, Thompson DJ:A follow-up of Donora ten years after: methodology and findings.Am J Public Health Nations Health1961,
51:155–164.
2. Nemery B, Hoet PH, Nemmar A:The Meuse Valley fog of 1930: an air pollution disaster.Lancet2001,357:704–708.
3. Brunekreef B, Holgate ST:Air pollution and health.Lancet2002,
360:1233–1242.
4. Delfino RJ, Becklake MR, Hanley JA:The relationship of urgent hospital admissions for respiratory illnesses to photochemical air pollution levels in Montreal.Environ Res1994,67:1–19.
5. Downs SH, Schindler C, Liu LJ, Keidel D, Bayer-Oglesby L, Brutsche MH, Gerbase MW, Keller R, Kunzli N, Leuenberger P, Probst-Hensch NM, Tschopp JM, Zellweger JP, Rochat T, Schwartz J, Ackermann-Liebrich U:Reduced exposure to PM10and attenuated age-related decline in lung function.
N Engl J Med2007,357:2338–2347.
6. Gauderman WJ, Vora H, McConnell R, Berhane K, Gilliland F, Thomas D, Lurmann F, Avol E, Kunzli N, Jerrett M, Peters J:Effect of exposure to traffic on lung development from 10 to 18 years of age: a cohort study.
Lancet2007,369:571–577.
7. Ghorbanli M, Bakand Z, Bakhshi khaniki G, Bakand S:Air pollution effects on the activity of antioxidant enzymes in Nerium Oleander and Robinia Pseudo Acacia plants in Tehran. Iran.J Environ Health Sci Eng2007,
4:157–162.
8. Hosseinpoor AR, Forouzanfar MH, Yunesian M, Asgharic F, Holakouie K, Farhoodd D:Environ Res2005,99:126–131.
9. Jerrett M, Shankardass K, Berhane K, Gauderman WJ, Kunzli N, Avol E, Gilliland F, Lurmann F, Molitor JN, Molitor JT, Thomas DC, Peters J, McConnell R:Traffic-related air pollution and asthma onset in children: a prospective cohort study with individual exposure measurement.Environ Health Perspect2008,116:1433–1438.
10. Kunzli N, Jerrett M, Mack WJ, Beckerman B, LaBree L, Gilliland F, Thomas D, Peters J, Hodis HN:Ambient air pollution and atherosclerosis in Los Angeles.Environ Health Perspect2005,113:201–206.
11. Miller KA, Siscovick DS, Sheppard L, Shepherd K, Sullivan JH, Anderson GL, Kaufman JD:Long-term exposure to air pollution and incidence of cardiovascular events in women.N Engl J Med2007,356:447–458. 12. Pope CA, Burnett RT, Thun MJ, Calle EE, Krewski D, Ito K, Thurston GD:Lung
13. Schwartz J, Morris R:Air pollution and hospital admissions for cardiovascular disease in Detroit Michigan.Am J Epidemiol1995,
142:23–35.
14. USEPA:Air Quality Criteria for Particulate Matter. Final Report. Washington, DC: US Environmental Protection Agency; 1996. EPA 600/P-95/001. 15. Fattore E, Paiano V, Borgini A, Tittarelli A, Bertoldi M, Crosignani P, Fanelli R:
Human health risk in relation to air quality in two municipalities in an industrialized area of Northern Italy.Environ Res2011,111:1321–1327. 16. SCI:Statistic Center of Iran. 2011. Available at: www.amar.org.ir. 17. WHO:Urban outdoor air pollution database. Geneva, Switzerland: August
2011 Department of Public Health and Environment, World Health Organization; 2011. Available at: http://www.who.int/phe.
18. Krzyzanowski M:Methods for assessing the extent of exposure and effects of air pollution.Occup Environ Med1997,54:145–151. 19. Anderson R, Atkinson A, Peacock JL, Marston L, Konstantinou K:
Meta-Analysis of Time-Series and Panel Studies on Particulate Matter and Ozone (O3). Copenhagen, Denmark: Document EUR/04/5042688, WHO Task Group. WHO Regional Office for Europe; 2004.
20. WHO:World Health Organization Regional Office for Europe Copenhagen. Air Quality Guidelines for Europe. secondth edition. WHO Regional Publications (European Series, No. 91); 2000.
21. Gryparis A, Forsberg B, Katsouyanni K, Analitis A, Touloumi G, Schwartz J, Samoli E, Medina S, Anderson HR, Niciu EM, Wichmann HE, Kriz B, Kosnik M, Skorkovsky J, Vonk JM, Dortbudak Z:Acute effects of ozone on mortality from the“air pollution and health: a European approach”project.
Am J Respir Crit Care Med2004,170:1080–1087.
22. Samoli E, Aga E, Touloumi G, Nisiotis K, Forsberg B, Lefranc A, Pekkanen J, Wojtyniak B, Schindler C, Niciu E, Brunstein R, Dodic Fikfak M, Schwartz J, Katsouyanni K:Short-term effects of nitrogen dioxide on mortality: an analysis within the APHEA project.Eur Respir J2006,27:1129–1138. 23. WHO:Overview of the environment and health in Europe in the
1990s - Background document. World Health Organization Regional Publications, European Series, No 89; 1999.
24. Burret RT, Doles RE:Association between ambient carbon monoxide levels and hospitalization for congestive heart failure in the elderly in 10 Canadian cities.Epidemiology1997,8:162–167.
25. Spix C:Short-Term Effects of Air Pollution on Hospital Admissions of Respiratory Diseases in Europe: a quantitative summary of APHEA study results.Arch Enviro Health1997,53:54–64.
26. Touloumi G, Samoli E, Katsouyanni K:Daily mortality in“winter type”air pollution in Athens-a time-series analysis within the APHEA project.
J Epidemiol Community Health1996,50(suppl 1):S47–S51.
27. Anderson HR, Leon AP:Air pollution and daily mortality in London: 1987–92.BMJ1996,312:665–669.
28. WHO:Air quality guidelines for particulate matter, ozone, nitrogen dioxide and sulfur dioxide: Summary of risk assessment, Global update 2005.
World Health Organization; 2005. Available at: http://www.euro.who.int/ Document/E87950.pdf.
29. Boldo E, Medina S, LeTertre A, Hurley F, Mucke HG, Ballester F, Aguilera I, Eilstein D:Apheis: health impact assessment of long-term exposure to PM(2.5) in 23 European cities.Eur J Epidemiol2006,21:449–458. 30. Tominz R, Mazzoleni B, Daris F:Estimate of potential health benefits of
the reduction of air pollution with PM10 in Trieste, Italy.Epidemiol Prev 2005,29:149–155.
31. Martuzzi M, Galassi C, Ostro B, Forastiere F, Bertollini R:Health Impact Assessment of Air Pollution in the Eight Major Italian Cities. WHO Europe EURO /02/5040650; 2002. Available at: http://www.euro.who.int/ healthimpact.
32. Martuzzi M, Mitis M, Iavarone I, Serinelli M:Health Impact of PM10 and Ozone in 13 Italian Cities. WHO Europe; 2006. Available at: http://www.euro. who.int/pubrequest.
33. WHO:European Centre for Environment and Health. Quantification of the Health Effects of Exposure to Air Pollution. Bilthoven, Netherlands: Report of a WHO Working Group; 2000. EUR/01/5026342.
doi:10.1186/1735-2746-9-28
Cite this article as:Naddafiet al.:Health impact assessment of air pollution in megacity of Tehran, Iran.Iranian Journal of Environmental Health Sciences & Engineering20129:28.
Submit your next manuscript to BioMed Central and take full advantage of:
• Convenient online submission • Thorough peer review
• No space constraints or color figure charges • Immediate publication on acceptance
• Inclusion in PubMed, CAS, Scopus and Google Scholar
• Research which is freely available for redistribution