Não é permitido o uso das publicações do GVpesquisa para fins comerciais, de forma direta ou indireta, ou, ainda, para quaisquer finalidades que possam violar os direitos autorais aplicáveis. Ao utilizar este material, você estará se comprometendo com estes termos, como também com a responsabilidade de citar adequadamente a publicação em qualquer trabalho desenvolvido.
GV
PESQUISA
I
MPACTOS
E
CONÔMICOS DAS
M
UDANÇAS
DO
PIS-COFINS
U
TILIZANDO UM
M
ODELO DE
E
QUILÍBRIO
G
ERAL
COMPUTÁVEL
Relatório
10/2009
Título: Impactos econômicos das mudanças do PIS-COFINS
utilizando um modelo de equilíbrio geral computável
Title: Economic impacts from PIS-COFINS reform evaluated
with a general equilibrium model.
Resumo: Neste artigo é apresentada uma avaliação dos impacto da reforma tributária do PIS/PASEP e da COFINS, que passaram a ser coletados através de dois regimes associados aos fluxos domésticos (cumulativo e não cumulativo - misto) e a incidir sobre importações de bens e serviços. A metodologia adotada utiliza um modelo de Equilíbrio Geral Computável (CGE), adaptado para as novas características do sistema fiscal e especificado para simular os impactos sobre indicadores de bem-estar no Brasil. Estes impactos foram avaliados em duas etapas: a mudança do regime cumulativo para o novo regime tributário e a reforma completa. Os resultados mostram que esta reforma teria provocado deterioração dos indicadores macroeconômicos, de mercado de trabalho e de bem-estar.
Palavras-chave: PIS/PASEP e COFINS, reforma tributária, bem-estar, Brasil, modelo de equilíbrio geral computável.
Abstract: This research presents an evaluation of the impacts from the PIS/PASEP and COFINS tax reform, which started to be collected by means of two regimes associated to domestic flows (cumulative and non-cumulative - mixed) and to levy imports of goods and services. The adopted methodology uses a Computable General Equilibrium (CGE) model, adapted to new fiscal system characteristics and specified to simulate the impacts on welfare indicators in Brazil. The effects were computed in two steps: the changefrom the cumulative regime to new taxation regime and the full reform. The results show that this reform would caused a deterioration of macroeconomic, labor market and welfare indicators.
Key words: PIS/PASEP e COFINS, taxation reform, welfare, Brazil, computable general equilibrium model..
Autores:
Samir Cury: Engenheiro pela Escola de Engenharia de São Carlos da Universidade de São Paulo, Mestre e Doutor em Economia de Empresas pela Fundação Getúlio Vargas de São Paulo (FGV-SP), professor da FGV-SP.
Apresentação
No início de 2005, foi submetido ao GV Pesquisa, o projeto 461/04 intitulado
“Impactos Econômicos das Mudanças do PIS-COFINS, utilizando um Modelo de Equilíbrio Geral Computável”, com o objetivo de analisar economicamente uma das mais importantes mudanças na estrutura tributária brasileira.
A proposta de trabalho buscava, através de uma análise prioritariamente quantitativa, a resposta para as seguintes perguntas que foram especificadas no projeto:
(1) Que mudanças teriam ocorrido nos principais indicadores macroeconômicos, somente com a introdução da nova tributação?
(2) Quais foram os impactos desagregados, desta mudança de regime, sobre os diversos setores da economia brasileira?
(3) Que alterações ocorreram sobre a competitividade dos diversos setores? (4) Qual o impacto destas mudanças sobre o bem-estar dos indivíduos e famílias, diferenciados por classe de renda?
Desta forma, este relatório procura descrever os principais componentes que fizeram parte deste projeto de pesquisa, visando à construção de respostas às perguntas anteriores, no contexto de um arcabouço analítico compatível com os objetivos perseguidos.
Contents
1. Introduction ...4
2. The CGE Model – main features...10
2.1. The Product Market ...10
2.1.1. Product Supply ...10
2.2. Demand for products...11
2.2.1. Families ...11
2.2.2. Firms...12
2.2.3. Government...13
2.3. The Labor Market ...13
2.4. The Income Transfer Mechanisms...15
2.5. The Government ...16
3. The Model Data Base ...18
4. Simulations and closure...18
4.1. Simulations – modeling issue ...18
4.2. Closure ...20
5. Fiscal reform impacts ...20
5.1. Macroeconomic impacts ...20
5.2. Sectoral impacts ...23
5.3. Impacts on employment ...24
5.4. Impacts on household income...26
6. Conclusion...27
7. Future directions of research ...28
1. Introduction
The purpose of this research is evaluate the economic impacts, with emphasis in the individuals and households welfare, originated from a significant reform of Brazilian Tax system that established a non-cumulative taxation system for the “Contribuição do Programa de Integração Social e de Formação do Patrimônio do Servidor Público (PIS/PASEP)” 1 and the “Contribuição para a Seguridade Social (COFINS)” 2, and their incidence on imports of goods and services.
From the promulgation of the 1988 Constitution, several initiatives took place in the scope of the Union, aiming at changing the Brazilian tributary system. Among the changes that had been implemented, the most significant ones were the introduction of “Contribuição Provisória sobre Movimentação Financeira (CPMF)” in 1993, and the PIS-COFINS tax reform, that took place from 2003 on and will be our object of analysis.
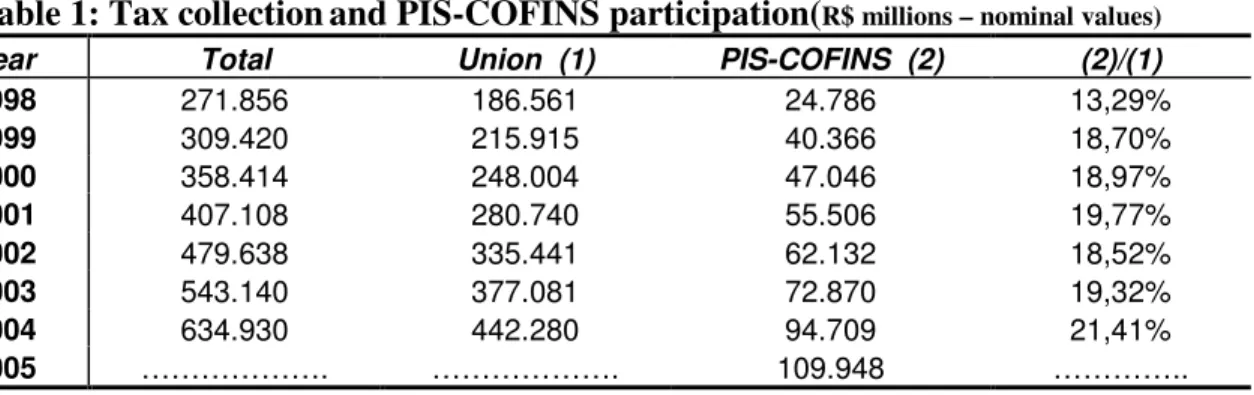
The PIS-PASEP origin traces back to the beginning of the 70’s, being created during the implementation of the labor market reforms that had finished with the employment stability. COFINS tax was originated from FINSOCIAL, which was created in 1982, in the context of the Brazilian external debt crisis that occurred in that period. To characterize the importance of these for the Brazilian public sector fiscal revenue, the table 1, below, presents the recent evolution of total taxes , the Union (broad Federal Government) taxes, and PIS-COFINS collections; in order to illustrate the relative importance of PIS-COFINS, its collection is compared to the Union values .
Table 1: Tax collectionand PIS-COFINS participation(R$ millions – nominal values)
Year Total Union (1) PIS-COFINS (2) (2)/(1)
1998 271.856 186.561 24.786 13,29%
1999 309.420 215.915 40.366 18,70%
2000 358.414 248.004 47.046 18,97%
2001 407.108 280.740 55.506 19,77%
2002 479.638 335.441 62.132 18,52%
2003 543.140 377.081 72.870 19,32%
2004 634.930 442.280 94.709 21,41%
2005 ………. ………. 109.948 …………..
Source: Receita Federal (2005)
Table 1 shows a continuous increase in the participation of these taxes in the Union revenue, reaching participation above 20.0%, by means of the recent legal changes that are object of our analysis in this research. Also, the significant increase of PIS-COFINS collection and share between 1998 and 1999 is most explained by the rise of COFINS rate, from 2.0% to 3.0%, applied firm’s total revenue, and the beginning of its incidence on Financial Institutions (law 9718/98).
The table 2, below, shows the four main tax groups in Brazil: the total state level value-added taxes (ICMS)3, all forms of Income Tax (IR)4, PIS-COFINS, and the Social Security Contributions (SSC – from employees and employers).
Table 2: Main Taxes of Brazil (R$ millions – nominal values)
Year ICMS IR PIS-COFINS SSC
1998 60,886 47,724 24,786 46,641
1999 67,885 55,215 40,366 47,425
2000 82,279 59,916 47,046 55,175
2001 94,267 69,494 55,506 61,060
2002 105,386 90,763 62,132 71,028
2003 120,233 99,850 72,870 80,730
2004 138,275 110,308 94,709 93,765
2005 ……… 124,618 109,948 …………
Source: Receita Federal (2005)
Adopting the same period presented in the previous table, we verify that, in 1998, the PIS-COFINS amount was equivalent to 51.9% of the Income taxes amount and 53.1% of the Social Security collection. Henceforth, its amount grew faster than the other amounts, reaching, between 1998 and 2004, a growth rate of 382%, followed by IR with 231%. Following this growth path, in 2004, the PIS-COFINS exceeded all revenues from Social Security Contributions, becoming the third bigger tax group, surpassed only by ICMS and all forms of Income Tax.
As mentioned before, the evolution during 2003 and 2004 was mainly due two essential changes in these taxes regime: (i) the introduction of a non-cumulative form of incidence for both PIS and COFINS and (ii) the incidence of both on imports of goods and services.
The table 3, below, identifies the main federal laws that had accomplished these changes, with a summary of their content and beginning date.
3 ICMS stands for “Imposto sobre Circulação de Mercadorias e Serviços” and it is a type of value added
tax by 27 Brazilian States.
Table 3: Main Federal Laws related to PIS-COFINS reform
Legal
Instrument Changes Starting date
Law 10637/2002
Establishment of non-cumulative regime for PIS on domestic flows (from firm’s revenue to value-added)
January 2003
Law 10833/2003
Establishment of non-cumulative regime for COFINS on domestic flows (from firm’s revenue to value-added)
February 2004
Law 10865/2004
PIS and COFINS start levying import flows of goods and services.
Several tax exemptions are established. May 2004
Law 10925/2004
Reduction of PIS and COFINS rates on agriculture inputs, public roads concession, postal services and tourism package selling firms.
PIS and COFINS rates on crops and cattle products were reduced to zero and a forecasted credit system (“crédito presumido”) is created to agribusiness activities.
November 2004
Law 11033/2004 PIS and COFINS rates on printed media wereexempted. January 2005
Law 11051/2004
The time period for using the PIS-COFINS credit to investment goods is reduced.
Outsource in transport operations and software services were exempted.
Extended the exemption or reduced rate to benefit all manufactured food
January 2005
Despite the analysis is focused on economic variables, some aspects of the of the related legislation must be emphasized, in order to better understand the modifications introduced into the CGE model as well as the simulations design that had been implemented.
monofásica”(a single-phase anticipation process). And finally, exports were totally exempted from this tax.
One year after the establishment of the non-cumulative regime for PIS, in December 2003, the similar regime for COFINS was established by means the law 10083. Also, this law established that the tax rate should be changed from 3.0% on gross revenue to 7.6% on value-added. Beyond allowing the exceptions and exemptions mentioned in the previous paragraph, the option to stay in the old cumulative regimen was permitted for many kinds of activities.5 Among them: health insurance firms; services of values monitoring and transport; cooperative societies; telecommunications services and media companies; services of public multi-modal transportation; health services provide by hospital or similar units and all kinds of educational services.
By means the law 10865/2004, March 2004, the two contributions started levying imports of goods and services. The basic percentage tax rates were the same of domestic contributions, 1.65% and 7.60 %, summing up to 9.25 %, but levying a different base from that one that is considered for Import Tariff (CIF value) collection. In the PIS-COFINS case, beyond the imports CIF value, must be added the Import Tariff (I.I.), the “Imposto sobre Produtos Industrializados” (IPI - a tax on manufactured products), the ICMS mentioned before, and the own PIS-COFINS. Thus, the final effect of this extended base is a multiplier that magnifies the original (nominal) tax rate legally established by the law.
Here again, some exemptions were introduced, for example, all the imports under drawback regime, equipment and inputs goods to the “Zona Franca of Manaus” were totally exempted from these taxes. Besides, some specific goods were also exempted, such as: press paper, intermediate inputs for aircraft and boats (maintenance and construction), equipment for the audiovisual industry, nafta petrochemical and natural gas.
The significant amount of exceptions, mainly exemptions or suspensions, common to the laws previously mentioned, created a subsequent pressure for the extensions of these benefits, being these the main aspect of laws 10925, 11033 and 11051, cited in the table 3, above. As example of this process, law 10637/2002, which created the non-cumulative regime for the PIS, was later modified by laws 10684, 10833, 10925 and 10996, in a period of only 2 years from the original edition.
Specifically for this work, this "mutant" characteristic caused a significant difficulty to simulate the economic effects of changes in the PIS-COFINS, in the context of a dynamic quantitative analysis.
To analyze the impacts of these tax policy changes, we used a Computable General Equilibrium (CGE) Model. The choice of this tool can be mainly justified by the possible changes in the relative prices structure of Brazilian economy, together with a significant increase of domestic production protection.
From the point of view of individuals and families, modifications in the structure of relative prices can modify significantly their welfare, by means of the changes in the structure of the real incomes and the expenditure of these agents. Besides, the taxation system together with the social public expenditure has been considered very ineffective in changing our income distribution6.
Specifically for this paper, we introduce the new fiscal system into a model whose first version was presented by Cury (1998), who extended the CGE model structure proposed by Devarajan et al. (1991) by increasing the number of types of labor recognized in the model and introducing a more detailed specification of the economic institutions. The social security system was specified as a specific agent apart from the Government, the firms were divided in different types and the representative family also was highly disaggregated.
This model was also extended in Barros et al. (2000) to evaluate the distributive impacts of the external (trade and capital flows) liberalization process in Brazil. This extension was characterized by the introduction of a more detailed specification of the labor market, which was completed in Cury et al. (2004). The specification of the labor market is characterized by the introduction of wage curves, as proposed by Blanchflower and Oswald (1990, 1994), empirically estimated for the Brazilian economy.7
The model presented in this paper has been adapted to reflect the new characteristics of our fiscal system. The main changes are: i) the introduction of PIS-COFINS on imports together with the former taxes: import duties, ICMS and IPI on
6 Robinson and El Said (2003) discussed the relationship between CGE Analysis and Income
imports; and ii) the partial change of former PIS–COFINS incidence from firms’ gross revenues to a value-added taxes, for some economic sectors8.
The economic literature on Multissectoral and General Equilibrium models for Brazilian fiscal policies is rare and very new. For this purpose, two studies were conducted at IPEA, Kume (2004) e da Silva et al. (2004), which specifically analyzed the case of PIS-COFINS. Kume (2004) employed a multissectoral fixed prices model, based on IBGE resources and uses tables, to estimate the variation of the domestic protection due to the proposed PIS-COFINS legislation. Although the simulation results from models with price rigidities must be interpreted carefully9, among the main results, we can mention that the domestic protection would have an average increase of 95.90%, from 7.50% to 14.40% of imports CIF value. The text also calculates the distinction between nominal and real tariffs.
Silva et al. (2004) extends the analysis of Kume (2004), using a CGE model that incorporated the changes to reflect the current structure of Brazilian tributary system. In the text, the authors present a descriptive section for a broader "tax reform" proposed by the Brazilian government, characterizing the participation of the main indirect taxes, before the PIS-COFINS tax reform. The simulations involve the ones previously mentioned as object of this paper, but also test a possible incidence change for the social contribution of employers.
There are several differences between this paper and that of Silva et al. (2004), among them are the data (our base year is 2003, theirs is 1998), the experiment design10 and results analysis. The second focuses on the macroeconomic and the sectoral impacts indicators due to the reform, while in our paper will extend the analysis through individuals’ and families’ welfare effects, taking the advantage of a specific institutional modeling for these questions.
8 Also further details of the tax system modifications will be presented in section 2.
9 Policy analysis in a environment of fixed prices must be interpreted with restrictions, mainly for not
allow agents reaction to relative prices change. About the results, is not clear if the simulations utilized the proposed or the approved law, which has differences for sectors and the way the tax, is calculated.
10There are small methodological differences in a way both articles incorporates the new tax system and
2. The CGE Model – main features
2.1. The Product Market
2.1.1. Product Supply
Foreign product supply is modeled as being totally elastic,11 while domestic supply is represented in a more elaborated way, through a nested production function, which considers three types of inputs: labor, capital and intermediate inputs. This production function form is identical for all sectors and can be obtained in three stages.12
In the first step, the amounts of the several types of existing labor (Fl), given by
the first order firm’s profit maximization conditions, are combined in a composite labor (Ld) for each sector (i), using for this purpose a Cobb-Douglas function with constant returns to scale.13 The labor types recognized in the model are: unskilled informal (l1), skilled informal (l2), formal with low skill (l3), formal with average skill (l4), formal with high skilled (l5), low skilled public servant (l6) and highly skilled public servant (l7)14, which are aggregated in the following form:
1
li
i il
Ld Fβ
=
∏
(1)where βil is the share of each type of labor.
In the second step, in each sector i, aggregated labor (Ldi) and capital (Ki)15 are associated using a constant elasticity of substitution (CES) function to obtain the sector
i’s production values (Xi) such as:
( )
1/
1 ip
ip ip
D
i i i i i i
X a Ld K ρ
ρ ρ
α α
= + −
(2)
where aiD is the CES shift parameter, αi is the sector’s i labor share in the production value and ρip is the elasticity of substitution between capital and labor.
11 In this sense, Brazilian demands for imported goods are fully satisfied without facing external supply
constraints.
12 The model represents the 42 sectors of activities listed in the 2003 Brazilian National Accounts. 13 This means that an identical increase of every type of worker results in an identical increase of the
aggregate worker.
14 Also, there are more 2 types of employers which are treated as labor and enter in the Cobb-Douglas
Finally, in the third step various intermediate inputs levels, (INTi ), can be
obtained, based on a Leontief production function (e.g., fixed proportion to sector j total
product, Xj):16
i ij j
j
INT = a X
∑
(3)where aijis the technical coefficient of input j in sector i.
Once the output is not entirely offered to the domestic market, producers react to the relative price of the domestic market vis a vis the international market and the domestic production is totally divided with imperfect substitution among products sold to these markets. The chosen functional form presents constant elasticity of transformation (CET) and assumes the following form:
( )
( ) ( )
( 1 /)
1 / 1 1 / it it
it it it it
T
i i i i i i
X a E D ρ ρ
ρ ρ ρ ρ
γ γ
+
+ +
= + −
(4)
where Xiis sector i’s total domestic production, Ei is the volume exported by sector i,
and Di is the domestic output of sector i sold in the internal market.
T i
a and γi are parameters of the model and ρit is the elasticity of transformation
17.
2.2. Demand for products
2.2.1. Families
Families are classified into eight categories, according to per capita household income, level of urbanization and household head characteristics. The family types considered are: poor urban families headed by active individual (f1), poor urban families headed by non-active individual (f2), poor rural families (f3), urban families with low average income (f4), urban families with average income (f5), rural families with average income (f6), families with high average income (f7), families with high income (f8)18.
16 It is worth mentioning that Devarajan et al. (1991) makes use only of the first and third steps, by
combining capital with labor and value added with intermediate inputs, in this order.
17 There are no empirical estimates of Brazilian export elasticities using a CET structure for a highly
disaggregated sectoral specification. Therefore, it was adopted the same procedure used in Cury (1998, pp. 112-113), which departed from the elasticities estimated by Holand-Holst, Reinert and Shiells (1994) to the American economy.
This classification yields more precision in the distribution of families according to their dependency degree to the various sources of household income, including the production factors earnings, social security monetary benefits, and net income from financial assets.
The families choose their consumption levels to maximize their utility subject to a budget constraint 19, according to a Cobb-Douglas functional form (similar to the production function presented earlier), whose arguments are the commodities available for consumption.
Once families and firms demand domestic and imported goods, following Armington (1969), we assume that goods differ according to their source (domestic or external) and that consumers consider them as imperfect substitutes, while their utility is measured (in product quantity) by a function with a constant elasticity of substitution (CES) with the following form:
( )
( ) ( )
( )
/ 1 1 / 1 1 / ic ic
ic ic ic ic
i i i i i i
Q a c M ρ ρ Dρ ρ ρ ρ
δ δ
−
− −
= + −
(5)
where Miindicatesthe volume imported of good i, and Di is the consumption of the domestic good i. a ci andδi are parameters, while ρic is the elasticity of substitution
between Di and Mi, whose values were taken from Tourinho et al. (2002), who estimated these Armington elasticities for the same sectors considered in the model. Finally, Qiindicates the utility derived from the consumption of good i, but it also can be interpreted as a quantity of a hypothetical mixed (imported and domestic) good, that would be demanded by consumers.
The external agents demand domestic goods, reacting to changes in relative prices as well. Similarly to the import demand form, the demand for exports arises from a CES utility function that represents the imperfect substitution between products from the external region and abroad.
2.2.2. Firms
Firms demand product to satisfy their requirements of intermediate inputs necessary in the productive process, according to the technical coefficients from the input-output matrix.
Due to the static nature of accumulation in the capital market, investments are important for product demand. As for the case of consumption, the investment is characterized as the purchases of certain goods and could be considered as a final consumption undertaken by firms. The savings represent this amount of resources, and we assume that a share of it corresponds to investment in stocks of finished goods, while the remaining share represents the net investment required to expand production. The first share is defined based on a fixed proportion of the sector output, while the second share is distributed exogenously among the different sectors, reflecting information from the input-output tables (goods by sector of origin) and the matrix of sectoral composition of capital (goods by sector of destination and origin).
As mentioned before, it is being considered that the investment goods are being produced but not considered as increments of capital stock. Thus, the model closure is closer to a medium-run type: constant capital stock, price flexibility and existence of involuntary unemployment in equilibrium.
2.2.3. Government
We assume that government consumption (GC) is derived from maximization of a Cobb-Douglas utility function subject to the budgetary restriction corresponding to the total expenditure that is fixed according with the total amount registered for the base year.
2.3. The Labor Market
Labor is modeled as a production factor used by firms and is classified into 7 types, reflecting different forms of insertion in the labor market (contract status) and schooling.20
We assume that the firms aim at maximizing profits taking the price of inputs, production factors and output as given. The firms also consider the technological constraints imposed by the production function specified before. Therefore, as a result
20 The labor treatment that follows is applied for the 5 types of private labors. The 2 types of public
of this maximization, the wages for each type of labor equalize their respective marginal productivity so that a demand curve for each type of labor is defined by:21
/
i i il il
P X∂ ∂F =W (6)
As mentioned earlier, our alternative to incorporate involuntary unemployment in the equilibrium consists of interacting the demand for labor with a wage curve, as proposed by Blanchflower and Oswald (1990, 1994), which describes a negatively sloped curve linking the employees’ wages to the unemployment rate in their region (or industry) and whose causality run from the unemployment rate to wages.22
The wage curve adopted represents the negative relation between the unemployment rate (Ul) and the wage level (Wl) for the each type of labor l in Brazil, and can be described by the following equation: 23
lnWl =αi−βllnUl (7)
According to Blanchflower and Oswald (1994), the theoretical foundations that justify the existence of wage rigidity are, basically, efficiency wages or union bargaining. In this sense, we can interpret the wage curve as a wage determination policy by the firms that takes into consideration competition among workers to occupy a job vacancy. When this competition is high (high unemployment rate), the firm can offer a relatively lower wage. The sensitiveness of this movement is given by the parameter β. 24
The labor market equilibrium determination can be visualized in the figure below.25 Point Eo represents the full employment equilibrium in a market affected only by supply (Lo) and demand (Ld). With the introduction of the wage curve (S), the equilibrium levels of employment and wages is determined by E/, the intersection point between the demand curve and the wage curve. The wage level defined by E/ does not correspond to the labor supply, and the difference is the excess supply of labor that corresponds to the unemployment level (U) in the economy.
21 The derivative of the profit function in relation to the demanded quantity of each factor must be equal
to the factors’ price (first order condition).
22 The estimated curve held after controlling for workers' personal and demographic characteristics, for
regional characteristics, and for macroeconomic and other aggregate influences, and presented very similar curvature of the function in each of the fifteen countries in which the curve has been found. Bhalotra (1993) and Hoddinot (1993), apud Blanchflower and Oswald (1994), found similar results for India and Cote d’Ivoire, respectively.
23 Further details about the wage curve can be found in Cury et al. (2005).
24 The values were taken from Reis (2002), who presents their econometric estimations for the Brazilian
Ld
L
W
E0 E'
S
L0
L U
Figure 1 - Equilibrium in the labor market for a given type of labor
Since the labor market closure is formulated by type of labor,26 the adjustment
mechanism is from the aggregate to the sectoral level. After defining the aggregate levels of employment, wages and unemployment for each type of labor, their sectoral wages are found by means of the relative wage differentials among sectors. Thus, from the average wage for each type of labor (wl), we can determine the wage of each kind of worker in each sector (wli). Then, by means of a sector and labor type specific demand curve (equation 6), we determine the sectoral employment level of each type of labor (Fil), which are aggregated by a Cobb-Douglas function (equation 1) to define the sector
i’s composite labor.27
2.4. The Income Transfer Mechanisms28
Here it will be presented the formation process of income flows received by families, firms, government, and the rest of the world, that encompasses two parts: the definition of the distribution of the value added in the productive process (primary income distribution) and the transfers among the mentioned agents (secondary income distribution). 29
25 In order to represent the relation in axis L, W we must have in mind that U = (Lo – L)/Lo.
26 The same applies for labor supply.
In the first part, the remuneration of capital is paid to firms30 and the labor earnings to workers. In each sector, the payments to capital are distributed to the firms according to the initial share in the total earnings of capital.
The earnings of the seven types of labor are distributed to the eight types of families according to the initial distribution of these workers by families. The share of income of each type of worker that goes to family h is given by the share of this type of labor in this type of family (εhl). The families also receive the remuneration of capital transferred by firms, YK. The distribution among each type of family is given by the family h’s proportion in each of these income flows (matrix εhk).
The families also receive net remittances from abroad (REh), adjusted by the exchange rate (R), and transfers from the Government (TG), that are made as payment of benefits (direct income transfers),31 and as other transfers (essentially domestic debt interest). These resources are allocated to the families according to the initial shares (θht for the government transfers). Therefore, the income of the family h can be represented as follows:
h hl l hk ht h
Y =ε W +ε YK+pindex TG R REθ + ⋅ (8)
2.5. The Government
The Government spends by consuming (∑
i CGi) and transferring resources to
economic agents. It plays a very important role in the process of determination of secondary income, once it also directs a share of its transfers to firms32 as interests on the domestic debt and demands products. Similar to families, the sharing of government transfers to the types of firms follows the proportions observed in the base year (θk). Finally, it also transfers resources to abroad (GE) and its total expenditure is given by:
(
)
TG RGEpindex
GG ht k
i CGi+ . + . + .
=∑ θ θ (9)
To face all expenditures, the Government relies on three types of collections: (1)
direct taxes levied on firms’ and families’ income (φh and φk, respectively), and (2) indirect taxes on domestic and imported goods (proportional to production (X), imports
30 Small (self-employed people) and large (other firms).
31 These transfers include the social security benefits as well as other programs such as unemployment
(M) and value added (VA) amounts). Besides these sources, it also receives transfers from abroad (gfbor) and, finally, there is the balance of the social security system (SOCBAL).33 Thus, the Government total revenue is:
SOCBAL PR R M VA K Y RG
i i i i i
i i i i
j j
k
h h Yh j j X
+ + + + + + + + + = ∑ ∑ ∑ + ∑ ∑ . ). ( ). ( . . . . . ( ) γ κ µ σ π ξ η φ φ (10)
where ηj are the tax rates on production, ξj and πi are, respectively, the sector i’s PIS-COFINS rates on production value (cumulative regime) and on value-added
(non-cumulative regime), σi and κi are ICMS-IPI tax rates, while γi are the PIS-COFINS
rates on imports of commodity type i.
An eventual lack of government resources is defined as a government deficit that, together with domestic private (firms and families) and foreign savings, defines the amount of resources spent in the form of investments.
The implementation of the PIS-COFINS fiscal reform changed the way by which the Government collects indirect taxes that levy domestic and imported commodities. Thus, the indirect tax revenue (INDTAX) from domestically produced goods is given by:
(
) (
)
{
}
∑(
)
∑ + + +
=
i j j i
j j j PXj Xj VA
INDTAX η ξ * . (π σ ). (11)
Where PXj.Xj is the production value and VAi , ηj , ξj , σjand πj were presented above
(equation 10).
The presentation of this equation is very important to understand the way the implementation of the fiscal reform will be simulated. According to PIS-COFINS tax revenue data from “Receita Federal”, all sectors would be being levied in both (cumulative and non-cumulative) regimes. Then, the domestic part of the simulation will consist in applying the ξj and πj tax rates that were verified in 2004 at sectoral level. The other equation that contributes to the Government revenue and deserves mention is the tariff on imports revenue, which is given by:
33 In fact, social security is treated as an agent apart from the Government in the model, not only because
(
)
∑ + +
=
i pwmi exr i i i Mi
TARIFF . * µ κ γ . (12)
where pwmi is the external price of imports (in US$), exr is the exchange rate, µi is the tariff on imports, κi is ICMS-IPI rates on Imports and γi are the PIS-COFINS rates on imports.
Again, the presentation of this equation is important to understanding the way implementation of the fiscal reform will be simulated, once another feature of this reform is that the imports will be levied by PIS and COFINS taxes. Thus, the implementation of this part of the reform will consist in applying γi tax rates that were collected from import flows of commodity type i in 2004.
3. The Model Data Base
Almost all data used in the model and simulations is derived from a Social Account Matrix (MSC-2003), which contains all the information concerning quantities and prices in the model’s base year, 2003. Besides, all the model’s coefficients and parameters obtained by means of a model calibration process are calculated from this data matrix. This matrix MCS-2003 was specifically made to be used in this research, and due to the large number of economic relationships and complexity encompassed by this matrix, it will be described in the Appendix 1. It deserves mention that it was made based on information from the latest officially published Brazilian National Accounts by Instituto Brasileiro de Geografia e Estatística (IBGE).
Another set of data used to calculated the economic shocks that willl be simulated and evaluated will be presented in the following section that describes the implemented simulations.
4. Simulations and closure
4.1. Simulations – modeling issue
calculate the former rates that must be applied on the value-added, it is necessary to consider the incidence of these taxes on the ICMS rates, which is sector specific. Besides, the legal and the applied rates can be different due to fiscal exemptions.
The PIS-COFINS fiscal reform established that sectors would remain in both taxation regimes, the previous (cumulative) and the new (non-cumulative). In this sense, it was assumed that, after the reform, the great majority of sectors and activities started to be levied by a mixed taxation regime. Thus, as exposed earlier, the domestic part of the simulation will consist in applying the tax rates on production and value-added amounts, calculated based on 2004 flows, at sectoral level.
More specifically, the economic shocks were calculated from data on PIS and COFINS by CNAE sectoral classification and by collection base (firms gross revenue and firms value-added), obtained from the Secretaria da Receita Federal (SRF). Once the sectoral classification of CNAE and in the matrix MCS-2003, which follows IBGE codification, are not the same, the sectors were matched assuring that the aggregated amounts of collections were equal.
The taxation reform has also established that, in general, the imports should be levied by a PIS rate of 1,65% and by a COFINS rate of 7,6%. The reform has also admitted different rates to PIS and COFINS on imports to the following sectors: machines and tractors (2,0% and 9,6%); automobiles, trucks and buses (2,0% and 9,6%); oil refinery (2,34% and 10,74%); pharmaceutical and perfumes (2,1% and 10,0%) and other food and beverages products (1,97% and 9,21%).
It is important to mention that the legal compound PIS-COFINS rates are not directly imposed on imports because the legislation establishes that to determine the rate to be applied it is necessary to use a specific formula by which these rates must interact with the ICMS and tariff rates on imports, besides themselves.
Also, the existence of special taxation regimes benefiting some import flows by exempting them from tariffs and/or indirect taxes, as for example, the imports under the drawback regime, can make the applied rates differ from the legal ones. Then, given these possible differences, the implementation of the incidence of PIS and COFINS on imports will consist in applying the tax rates that were verified from these flows in 2004.
levy sector’s revenue and value added, (2) application of the new tax rates on domestic flows (verified in 2004), (3) the taxes start levying imports and (4) application of the new tax rates on import flows (verified in 2004).
The taxation reform will be simulated in two steps. In the first step, the mixed taxation regime will be implemented (features (1) and (2)). Then, in the second step, the PIS-COFINS rates on imports are implemented (features (3) and (4)), taking as database the resulting scenario from the first step. Thus, the results from the second step capture all the impacts of the taxation reform. Henceforth, these simulations will be referred as PCVA (domestic reform) and PCVAM (complete reform).
4.2. Closure
As mentioned previously, the model closure is closer to a medium-run type, since it is being assumed that: (1) capital stock is constant, (2) prices are flexible, (3) involuntary unemployment exists in equilibrium and (4) trade balance is exogenous. The constancy of capital stock is due to the fact that, in the model, the investment goods are being produced but not considered as increments of capital stock. The existence of involuntary unemployment in equilibrium is a consequence of the labor market modeling (section 2.3).
By adopting trade balance as exogenous, the exports adjust not only due to the price responsiveness of external demand but also to adjust the changes in imports, in order to maintain the trade balance unchanged.
Since the one of main purpose of the simulation is to evaluate which would be the distributive impacts of the PIS-COFINS fiscal reform, the analysis will also focus on the impacts on employment, wages and household income. However, the impacts on some selected aggregated variables will be presented in order to evaluate the magnitude of the macroeconomic impacts.
5. Fiscal reform impacts
5.1. Macroeconomic impacts
presented in the first column (PCVAM). The impacts of domestic part of the reform are also reported (column PCVA), even they are not the focus of analysis.
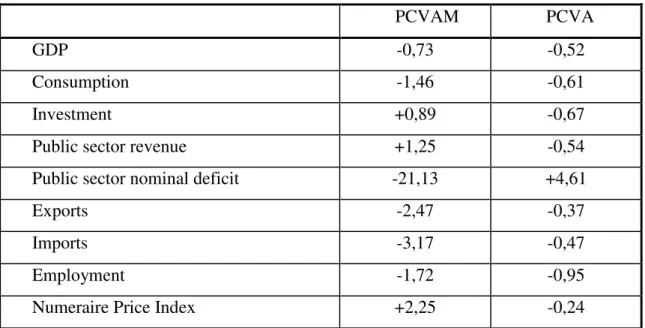
Table 4- Macroeconomic Indicators (% change from base year)
PCVAM PCVA
GDP -0,73 -0,52
Consumption -1,46 -0,61
Investment +0,89 -0,67
Public sector revenue +1,25 -0,54
Public sector nominal deficit -21,13 +4,61
Exports -2,47 -0,37
Imports -3,17 -0,47
Employment -1,72 -0,95
Numeraire Price Index +2,25 -0,24
Note : (1) real % variation, (2) from simulations results.
The overall impacts from fiscal reform are adverse, since it would induce a real GDP fall of 0.7%, an aggregate employment decrease of 1,72% and inflation of 2.3%. The effect on real GDP can be reflecting the fact that the elimination of the cumulativeness of these taxes had relatively strong negative effects on output at sectoral level and, therefore, on aggregate product.
The taxation of value-added (VA) induces an increase in its price, which is equivalent to a rise in marginal costs. To achieve the equilibrium, in perfect competition, the representative firm needs earn higher marginal revenue or reduce marginal costs, which can be done by reducing the VA components usage. Considering the way that the labor market operates and the model’s closure features, this implies in a lower demand by labor, inducing a decrease in wages, and so, reducing the available income and, consequently, consumption expenditure.
domestic commodities. In a similar way, the firms tend to substitute import inputs by domestic inputs. However, this positive effect is not strong enough to offset the negative effect on consumption induced by the taxation of imports, and so, there is a second adverse impact on consumption demand.
The macroeconomic closure considers that the investment is determined by the savings behavior and that the Government consumption is fixed. This implies that the changes in the tax revenue affect the Government savings and, therefore, the public deficit and investment. Thus, the investment increases by 0.9% due to the rise of 1.3% in the public sector revenue, which induces a decrease of 21.1% in the public sector deficit.
Exports fall due to the price-responsiveness behavior of external agents and the model external closure characteristics. First, the reform induces an increase domestically produced commodities prices, which, by turn, causes a decrease in external demand by Brazilian commodities. Second, the rise of import prices and the reduction of internal absorption (activity) induce a fall in demands for imported commodities, and in order to not affect the trade balance equilibrium, exports must decrease.
The fall in aggregate consumption and exports more than offset the increase in investment and the fall of imports, thus, the PIS and COFINS reform induce a decrease in the national GDP (–0.7%) and employment (–1.72%).
Although the implementation of a mixed taxation regime alone (column PCVA) is a more stylized scenario, its effects can reveal some interesting results when compared to the effects from the complete reform (column PCVAM). We see that the effect on GDP would still be negative but less strong (–0.5% and –0.7%, respectively). Taking in account the effects of imposing the partial reform, we can see a fall in the total government revenue (–0.54 %), which would be the opposite result from the complete reform. , showing the importance of PIS-COFINS taxation on imports, which would induce an decrease of public savings and, therefore a decrease in investment.
Table 5- PIS-COFINS values, before and after taxation reform (2003 R$ millions)1
Base (2003)34 PCVAM PCVA PIS-COFINS other than value added 62.686 31.528 31.877
PIS-COFINS on value added 11.577 44.647 45.168
PIS-COFINS on Imports ---- 13.593
----Total PIS-COFINS 74.025 89.588 77.057
Note : (1) real values deflated by model price index.
From the above data, we can verify that the partial reform total value collected (last column) is very similar to the base value with an increase of just 4 %. These results partially confirm the hypothesis that only changing the taxation regime would not significant change the total PIS-COFINS collection. On the other hand, when the taxation of imports are simulated, the total value collected increase significantly by R$ 15,563 millions (+21.6%) with PIS-COFINS collection on imports (R$ 13,593 billions) representing almost 90 % of that growth 35
5.2. Sectoral impacts
In the previous section we focused on macroeconomic indicators which showed a decrease in real GDP. In this section we will analyze the impacts at sectoral level, once each sector performance can vary in a significant way comparing to others. The analysis will be based on a combination of prices and quantities indicators, represented by real gross revenues.
Table 6- Five less and most benefited sectors (real gross revenue in PCVAM*) Damaged sectors Variation Benefited sectors Variation Leather and shoes -5,81% Other chemical products 1,11% Retail and wholesale trade -2,79% Non-iron metallurgy 1,20%
Steel industry -2,33% Non-metallic minerals 1,36%
Coffee industry -2,16% Companies services 2,04%
Sugar industry -1,90% Machines and tractors 4,26%
Note: (*) percentage change from base year; sectoral nominal gross revenue percentage changes were deflated by model price index.
34 The base year total value of this table has a small difference from the data reported in table 1 and 2
The least benefited sector, in table 6 above, is leather and shoes and its performance can be explained by the fall of quantity produced, basically due to the fall in exports and consumption. The results Coffee and Sugar industries are understood by a similar explanation. The effects on Retail/Wholesale trade and Steel industry are explained in a different way. These two sectors are benefited in the taxation reform by paying a lower indirect taxes amount which will reduce their production prices despite their increase of output.
On the other hand, the fifth most benefited sector is Machines and Tractors that would benefit from a quantity effect due to increase in import substitution and investment. On the opposite, service sector is benefited from a price effect due to a difficulty in finding substitution for its products. The three most benefited sectors, Non-metallic minerals, Non-iron metallurgy and Other chemical products share the property of increases both: production prices and quantities. These combinations of effects are possible in the context of a strong sectoral import substitution demanded for the market of intermediate inputs.
5.3. Impacts on employment
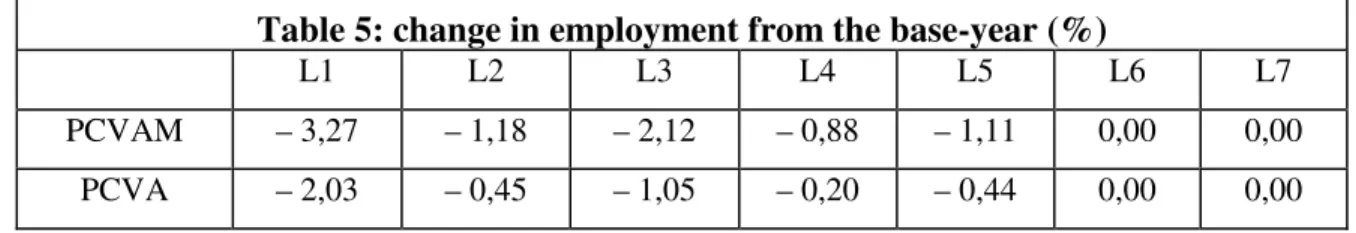
Table 4, presented earlier, reveals that the reaction to the reform would be a decline of aggregate employment (– 1.72 %). Table 7, below, reports the impacts on the level and the structure of employment that would be induced by the fiscal reform. As before, the analysis will be focused on the impacts of complete reform (line PCVAM).
Table 5:change in employment from the base-year (%)
L1 L2 L3 L4 L5 L6 L7
PCVAM – 3,27 – 1,18 – 2,12 – 0,88 – 1,11 0,00 0,00
PCVA – 2,03 – 0,45 – 1,05 – 0,20 – 0,44 0,00 0,00
Note:L1-unskilled informal; L2-skilled informal; L3-formal with low skill; L4-formal with average skill; L5- formal with high skill; L6- low skilled public servant; L7- highly skilled public servant.
The results show that employment would fall for all categories of workers in the private sector only. The public servants employment does not change because public sector does not follow the behavior of private sector concerning hiring/firing people and
35 Despite not being a good method for comparison, the total value showed in table 4 agree with real
so, by assumption, their employment levels are fixed and their labor market adjust only by means of wages.
Among workers in the private sector, the effects would be more pronounced among the less skilled workers (L1 and L3), regardless their labor contract status. The second higher impacts would be on employment of more skilled workers (L2 and L5), also regardless contract status. The less affected category would be the formal with average skill worker (L4).
In our interpretation, with lower imports there will be a pressure to overvalue the exchange rate that will tend to make exports more expensive, which will be reinforced by an increase in input prices used to produce exported goods. The sectors in which exports are more sensible to price changes are the most traditional ones. Thus, by exporting less, there would be a tendency for these sectors to produce less and, therefore, to employ less workers, especially the less skilled ones.
The employment decrease in employment of more skilled workers is due to the fall in the production quantities of sectors that produce goods with higher technological content (automobiles, auto parts, electronic, electrical, and pharmaceutical) and with more qualified workers.
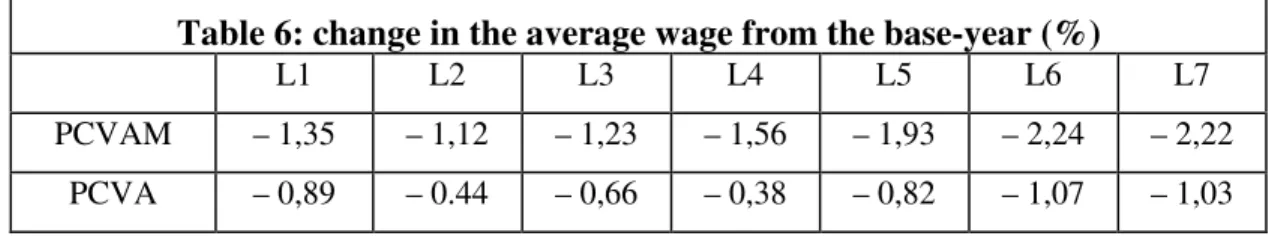
After examining the impacts on employment by labor type, it will be presented the effects on wages, also by labor type. It is worth remembering that, it is assumed that the sectoral wage differentials are rigid. Thus, the wage structure can only react to the type of labor. As a consequence, we report, in table 6, below, the changes in real wages for each type of worker without any sector desegregation.
Table 6:change in the average wage from the base-year (%)
L1 L2 L3 L4 L5 L6 L7
PCVAM – 1,35 – 1,12 – 1,23 – 1,56 – 1,93 – 2,24 – 2,22 PCVA – 0,89 – 0.44 – 0,66 – 0,38 – 0,82 – 1,07 – 1,03
Note:L1-unskilled informal; L2-skilled informal; L3-formal with low skill; L4-formal with average skill; L5- formal with high skill; L6- low skilled public servant; L7- highly skilled public servant.
higher reduction of public servants’ earnings is due to the assumption that the equilibrium in their labor market is almost exclusively achieved by means of wages adjustments.
In general terms, it does not seem that there was a labor category that had benefited more or less from the reform. Classifying the workers from the most to the less benefited worker group, according to the impacts on employment, we would have the ordering: public servants, formal with average skill, highly skilled and low skilled. However, according to the impacts on average real wage, we would have almost the opposite ordering. The classification of workers into informal, formal private and formal public categories also does not show any pattern.
5.4. Impacts on household income
The effects of the fiscal reform on household income are presented in table 7, below.
Table 7:change in household income from the base-year (%)
F1 F2 F3 F4 F5 F6 F7 F8
PCVAM – 1,61 – 0,25 – 1,51 – 1,54 – 1,50 – 1,22 – 1,55 – 1,64
PCVA – 0,95 – 0,28 – 0,90 – 0,93 – 0,86 – 0,75 – 0,88 – 0,93
Note:F1 – poor urban families headed by active individuals, F2 – poor urban families headed by non-active individuals, F3 – poor rural families, F4 – urban families with low average income, F5 – urban families with average income, F6 – rural families with average income, F7 – families with high average income, F8 – families with high income.
The results show that all types of households have their real incomes negatively affected by the fiscal reform. It is notorious that only the poor urban families headed by non-active individuals (F2) would present a much lower decrease in their real income (–0.25%) comparing to the fall experienced by the other types of families (stronger than –1.22%). This would happen because this is the family (F2) whose total income presents the lowest dependency on labor income.
In the Brazilian economy, the labor income has a large weight in the generation of the household income. Nevertheless, income transfers have an important participation, mainly for the poor households through the social security retirement pensions and benefits, besides the direct transfers from social programs.
the reform had almost linearly reduced the average real income in the country and had induced a decrease in employment and consumption, then, it is possible to interpret the general impact from the reform as a welfare reducing one.
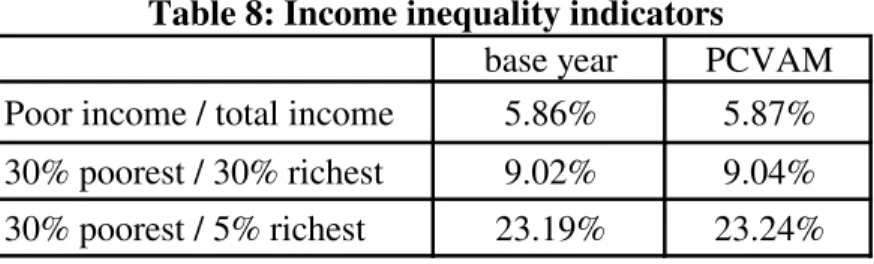
Table 8, below, reinforces the argument that the taxation reform would not have affected the income inequality in the country.
Therefore, taking in account the income levels, the main losers of PIS-COFINS tax reform would be the poorest households. Even it is not so clear to infer that the reform would unequivocally worse the income inequality, it is reasonable to expect that it had increased the poverty gap once the poor families real income levels would fall, reducing more their, already low, consumption levels.
6. Conclusion
In this paper, we have investigated the effects of a change in the Brazilian Fiscal System on some economic indicators, also trying to infer the impacts on social welfare. More precisely, together with macro indicators we have estimated how wages and employment structures, as well as the household income distribution would react to the tax reform characterized by the introduction of a mixed (cumulative and non-cumulative) tax system for PIS/PAEP and COFINS, and by the incidence of them on imports of goods and services.
Despite the increase of Government fiscal revenues and the reduction in the public deficit, that induces increase in investment, the results show that the reform would have adverse effects on macroeconomic aggregates, as GDP, general price level, employment, consumption and external trade flows (exports and imports) would present lower magnitudes. Also, the intensity of changes induced by the reform would depend on the taxation level of PIS-COFINS on imports. As imports are taxed, the public sector indicators would become better but the adverse effects on other macroeconomic would be enhanced, except for investment. The implemented simulation reveals another
base year PCVAM Poor income / total income 5.86% 5.87% 30% poorest / 30% richest 9.02% 9.04% 30% poorest / 5% richest 23.19% 23.24%
Note: Poor (F1+F2+F3), 30% richest (F7+F8), 5% richest (F8)
important macro issue related with the model macro-closures. It seems that the effect in the composition of aggregate demand will depend on the closure choices.
For the labor market, we can notice a clear general deterioration, but the effects differ among categories of workers. The negative effects on the employment structure are concentrated among less skilled workers in the private sector (L1 and L3), regardless their labor contract status. The second higher impacts would be on employment of more skilled workers (L2 and L5), also regardless contract status. These effects are due to the decrease in exports of sectors that represent high shares in these workers distribution along productive activities. Again, the intensity of results would be enhanced with taxation of imports.
There would be a general welfare loss for all families. Only the poor urban families headed by non-active individuals would present a relatively lower fall in income due to their low dependency on labor earnings. All other families would present percentage changes in income very close to the others. Therefore, considering the income levels, the main losers of PIS-COFINS tax reform in the simulation are the poorest households. Even it is not so clear to infer that the reform would unequivocally worse the income inequality, it is reasonable to expect that the reform had increased the poverty, once the poor families real income levels would fall, reducing more their, already low, consumption levels.
Finally, it deserves be emphasized that the imposition of PIS and COFINS taxes on imports induced a stronger and much more relevant impact than the effects related to domestic flows, which consisted in partially changing the tax base from firms gross revenue to firms value-added.
7. Future directions of research
Microssimulation procedure
In the CGE model, each type of family is represented by a specific representative (average) family. The incorporation of a microssimulation procedure to the CGE model would permit to improve the computation of welfare indicators that depends on the variables distribution by means of a better identification of more disaggregated agents groups, in the limit it could be done until the individualized family level.
The implementation of this microssimulation procedure must be done with a feedback procedure. By just integrating a microssimulation procedure (model) to the CGE model it is not assured that, when the impacts are transmitted from the later to the former, the income indicators be equal in the two models. The way of assuring that these indicators be equal is by a feedback procedure among the two models.
Temporal effects
The impacts from economic policies tends to spill over time. Then, the incorporation of temporal dynamic by means of capital and labor force stocks updates would permit to elaborate temporal economic scenarios.
Alternative structure for the full indexation hypothesis
From a distributive point of view, one hypothesis deserves attention. In relation to the formation of the household income, recall that we have fully indexed all types of transfers in a single way (with the model’s price index), which implies in the possibility of not capture all the effects arising from distributive conflicts. This fact poses an important question for CGE models aimed at measuring the impacts on poverty and inequality: how to reconcile the general equilibrium theoretical structure and its respective properties with model specifications concerned with the distributive conflicts that exist in the flow of income transfers, in situations where changes in relative prices take place.
Finally, we would like to reinforce that these topics are beyond the objectives of this study but are being considered as future direction of research.
References
ARMINGTON, Paul.. “A Theory of Demand for Products Distinguished by Place of Production”, IMF Staff Papers, vol. 16, pp. 157-178, 1969.
BARROS, R. P. de; CORSEUIL, C. H.; CURY, S. Abertura comercial e liberalização do fluxo de capitais no Brasil: impactos sobre a pobreza e a desigualdade. In HENRIQUES, R. (org.): Desigualdade e Pobreza no Brasil. Rio de Janeiro: IPEA, 2000, p. 271-298.
BARROS, R. P. de; CORSEUIL, C. H.; CURY, S. “Salário mínimo e pobreza: uma abordagem de equilíbrio geral”. Pesquisa e Planejamento Econômico, Rio de Janeiro: IPEA, v. 30, n. 2, p. 157-182, 2000a.
BLANCHFLOWER, D. G.; OSWALD, A. J. “The Wage Curve”, Scandinavian Journal of Economics, v. 92, p. 215-235, 1990.
BLANCHFLOWER, D. G.; OSWALD, A. J. “The wage curve”. Cambridge, Massachusetts: MIT Press, 1994, 493 p.
BOURGUIGNON, F.; SILVA ,L. P. da; STERN, N.. “Evaluating the Poverty Impact of Economic Policies” World Bank, draft, March 2002.
BOVENBERG, A. L.; GRAAFLAND, J. J.; de Mooij, R. A. “Tax reform and the Dutch labor market: an applied general equilibrium approach”, Journal of Public Economics, Elsevier, v. 78, n. 1, 10, p. 193-214 , 2000.
CURY, S. Modelo de equilíbrio geral para simulação de políticas de distribuição de renda e crescimento no Brasil. 1998, 176 págs, Tese (Doutorado) – Departamento de Economia, Fundação Getúlio Vargas, São Paulo, 1998.
CURY, S; COELHO, A. M. and CORSEUIL, C. H. “A Computable General Equilibrium Model to Analyze Distributive Aspects in Brazil with a Trade Policy Illustration”, Estudos Econômicos, v. 35, n. 04, São Paulo, 2005.
DEVARAJAN, S.; LEWIS, J.; ROBINSON, S.. “From stylized to applied models: building multisector CGE models for models for policy analysis”, USA, University of California at Berkeley, Department of Agriculture and Resources Economics, Working Paper 616, 1991.
FERGUSON, L. et al. “The Impact of the Barnett Formula on the Scottish Economy: A General Equilibrium Analysis”, Department of Economics, University of Strathclyde, Glasgow, Scotland, Discussion paper 03-04,2003.
GASTO SOCIAL DO GOVERNO CENTRAL: 2001 e 2002. Ministério da Fazenda, Secretária de Política Econômica, Brasília, Novembro de 2003.
GASTO SOCIAL DO GOVERNO: 2001-2004. Ministério da Fazenda, Secretária de Política Econômica, Brasília, Abril de 2005.
GINSBURGH, V.; KEYZER, M.. The Structure of Applied General Equilibrium Models. Cambridge, Massachusetts: MIT PRESS. 1997, 555 p.
HADDAD, E. A.; DOMINGUES, E P.; PEROBELLI, F S. “Regional effects of alternative strategies for economic integration: the case of Brazil”, Journal of Policy Modeling, v. 24, p.453-482. 2002.
HARRISON, G. W. et al.. “Políticas de Comércio Regionais, Multilaterais e Unilaterais do Mercosul para o Crescimento Econômico e A Redução da Pobreza no Brasil”,
Pesquisa e Planejamento Econômico, Rio de Janeiro: IPEA, v. 33, n. 1, p. 1-60, 2003.
HERTEL, T. W. et al.. “Multilateral Trade Liberalization and Poverty in Brazil and Chile”, Économie internationale, 94-95, p. 201-234. 2003.
HOLAND-HOLST, D. W.; REINERT, K.A.; SHIELLS, C.R.; A General Equilibrium Analysis of North American Economic Integration; in Modeling Trade Policy: Applied General Equilibrium Assessments of North American Free Trade. New York, Cambridge University Press, pp. 47-82.
IBGE. Sistema de Contas Nacionais – Brasil 2003, Contas Nacionais n. 12, Rio de Janeiro, 2004.
KUME, H.. “Mudanças na COFINS e no PIS/PASEP e a estrutura de incentivos à produção doméstica”, mimeo, Rio de Janeiro: IPEA, 2004.
KUME, H.; PIANI, G.; SOUZA, C. F.. “A política brasileira de importação no período 1987-98: descrição e avaliação”, mimeo, Rio de Janeiro: IPEA, 2000.
LEMGRUBER, A. “Competição tributária no Brasil”, Dissertação de Mestrado, Departamento de Economia, Universidade de Brasília, 1999.
PINHEIRO, A. C.; RAMOS, L. A. “Inter-industry wage differentials and earnings inequality in Brazil”, Estúdios de Economia, v. 21, p. 79-111, 1995.
RECEITA FEDERAL. “Carga tributária no Brasil 2004”, Estudos Tributários 14, Brasília: Receita Federal – Coordenação Geral de Política Tributária, Agosto de 2005.
REIS, M.. “Mudanças na estrutura da demanda por trabalho qualificado e na composição da oferta e seus impactos sobre desemprego”, mimeo, Rio de Janeiro: PUC-Rio, 2002.
ROBINSON, S.; El SAID, M. “Poverty and Inequality Analysis in a General Equilibrium Framework”. In : The Impact of Economic Policies on Poverty and Income Distribution”. BOURGUIGNON, F.; da SILVA , L. P.; (eds). Oxford University Press, 2003.
SILVA, N. L. C. da; TOURINHO, O. A. F.; ALVES, Y. B. “Impacto da reforma tributária na economia brasileira: uma análise com modelo CGE”. Rio de Janeiro: IPEA, Texto para discussão 1056, 2004.
1
Anexo 1: Base de dados
A construção da Matriz de Contabilidade Social-20031.
1. Introdução
Este texto apresenta os primeiros resultados advindos da elaboração da Matriz de Contabilidade Social (MCS), para o ano de 2003, como parte integrante do projeto de pesquisa “Impactos Econômicos das Mudanças do PIS-COFINS, utilizando um Modelo de Equilíbrio Geral Computável”, financiado pelo GV Pesquisa da EAESP-FGV. O objetivo maior do projeto que gerou esta MCS é a adaptação de um modelo aplicado de equilíbrio geral computável (Computable General Equilibrium Model – CGEM) para a simulação das mudanças tributárias ocorridas no PIS-COFINS.
É importante ressaltar a utilidade da MCS no campo da pesquisa econômica e social aplicada. Além de se constituir na base de dados dos modelos de equilíbrio geral2, a MCS é um importante instrumento de análise do processo de formação e repartição de renda no sistema econômico. Dentre as análises derivadas da MCS, podemos citar :
- a estimação da Renda Familiar agregada bruta e líquida;
- a interferência do setor público no processo de formação da renda das instituições;
- a composição da renda familiar, segundo suas diferentes fontes de geração;
- a incidência da carga tributária e das transferências governamentais;
- a composição da formação da poupança bruta da economia.
As análises citadas acima, quando realizadas na matriz desagregada, permitem identificar cada um dos efeitos sobre os componentes individualizados, ou seja, os 42 setores de produção, os 8 tipos de fatores- trabalho, os 4 tipos de fatores-capital e as instituições (8 tipos de famílias, 2 tipos de empresas, 2 blocos do “setor público” e o setor externo).
1 Coordenação de Samir Cury, baseado nos trabalhos de Samir Cury, Euclides Pedroso, Alexandro Mori
Coelho.
2 É reconhecido pelos pesquisadores de “ Aplied General Equilibrium”, que a fase de preparação de uma
Um outro ponto importante a destacar na utilização da MCS é o processo de conciliação de bases de informação distintas. Ao trabalhar conjuntamente, numa única estrutura, os produtos das contas nacionais, as pesquisas domiciliares e os registros administrativos; a MCS permite identificar as diferenças e/ou inconsistências reportadas nestas bases. Um exemplo da aplicabilidade deste trabalho é o processo de correção de renda das Pnads, essencial para estimativa efetiva dos indicadores de pobreza e distribuição.
2. O Conceito da Matriz de Contabilidade Social
A Matriz de Contabilidade Social (MCS) tem sua evolução associada com a tentativa de conciliação das Contas Nacionais (base de dados tradicional dos modelos macroeconômicos) com as Tabelas Insumo-Produto, que foram se constituíram na primeira base de dados dos modelos multissetoriais. Esta integração foi impulsionada pela necessidade de incorporar os fluxos de renda e de despesas entre instituições, dentro do instrumental de insumo-produto, que está voltado, principalmente, para a representação das contas setoriais de produção.
Dentro deste contexto, a MCS integra num único sistema estatístico os fluxos de produção e renda, representando de forma sistêmica a estrutura econômica de um determinado espaço geográfico. A formulação da MCS foi influenciada principalmente pelo economista e prêmio Nobel, Richard Stone, que participou ativamente da criação do “United Nations System of National Accounts (SNA)”, que serve como parâmetro básico dos “novos” Sistemas de Contas Nacionais de diversos países3.
Não existe um design ou um modelo específico padrão para se construir uma MCS. No processo de elaboração da mesma, o que determina sua estrutura é o tipo de problema que será analisado. Deste modo, por exemplo, o nível de desagregação dos setores e das famílias deve ser determinado pelo tipo de problema e pela disponibilidade de dados.
Todavia, um conjunto de restrições básicas deve ser atendido na construção de uma MCS:
- as linhas para cada agente/instituição representam receitas (créditos) e as colunas representam gastos (débitos). Para cada um dos elementos da matriz, a somatória das linhas (total de receitas) deve ser igual a somatória das colunas
3 Para uma visão geral sobre MCS e Sistemas de Contas Nacionais, vide United Nations(1975), Stone and