A Structure of Leadership Styles Based
on the Toyatrity Model in the Chosen Hotel
Borkowski Stanisław, Knop Krz ysztof, Adamus Kamila
Abstract
In this article results of the evaluation of leadership styles, brand managers and assessing the potential of employees in a four-star hotel in Poland are presented. The research were based on the Toyota’s leadership model, especially ninth principle of Toyota management and the BOST survey. On the basis of hotel employees answers the dominant leadership style of managers was determined, from the point of view of their degree of interest according to issues related to the quality of service. The statistical analysis of responses was made using the statistical position pa-rameters and whiskers-box plots. The identification of the leadership structure styles was made in analyzed hotel using leadership style maps and various approaches to the analysis of those maps. The correlation analysis and assessment of employees personal characteristics impact on the scores of the factors was made in the features of superiors. Correlative relationship was examined at three levels of significance 1. α = 0.2, 2. α = 0.1, 3. α = 0.05. The analysis showed that PA factor is judged better by women than by men; respondents differ significantly by level of education in the case of YA factor and by age in the case of YA and YB factors and by work experience in the case of YA factor. Workers differ statistically significantly by sex in evaluation of factor YA. Map of superiors brand was created in order to determine the structure of uncondi-tional behavior and of behaviors that support managers. This analysis showed high efficiency of decision managers and their large commitment (simultaneous dominance of managing behavior and support behavior). Personnel BCG matrix was created based on the traditional BCG matrix with the names used normally in the matrix but related to employees. The analysis showed that the majority of hotel workers rated themselves as people with high growth potential but low-ef-fects of their own work.
Keywords: hotel, leadership styles, BOST method, survey, statistical analysis
JEL Classification: L83
1. INTRODUCTION
Human resources are one of the main elements of the effective operation of any organization in the world. It is people, their knowledge, skills, value system are the factors that determine the ef-ficient operation and delivery of the overarching goals of the organization. In this context, there is also another very important aspect - appropriate management of these resources. Inseparably linked with this topic are also directing leadership styles (Borkowski, Stasiak-Betlejewska & Knop, 2013). Paul Hersey and Kenneth Blanchard in the late 1960s were the first to describe the directing leadership style. The directing leader clearly provides specific instructions, defines the roles and tasks of the “follower,” and closely supervises task completion. Decisions are made by
▪
Journal of Competitiveness
Vol. 7, Issue 1, pp. 53 - 70, March 2015
the leader and announced to the followers, so this communication style is largely one-way. In order to command respect and obedience leaders must be prepared to lead. Since their actions and attitudes set the example for others to follow, they must also be ready for any situation. Therefore, how they lead or their style of leadership can mean the difference between success or failure of a mission of any organization (Fołtyn, 2009). Leadership styles are the pattern of behaviors that one uses to influence others. Leadership styles are the personal manner and ap-proach of leading (providing purpose, direction, and motivation). It is the way leaders directly interact with their subordinates. Leaders can influence others in many different ways. Those patterns will be perceived by others as their leadership style (Koźmiński & Jemielniak, 2008). The three basic leadership styles are directing, participating, and delegating (Kuc, 2004). It’s up to leader to develop the flexibility to use all three styles – choosing the style that best meets the situation and team needs. Depending on the situation, they may want to use all three styles or different styles: with different followers or in different situations; when receive a new project or new personnel, or when supervisor changes and when and if team’s competence, motivation, or commitment changes.
Appropriate directing leadership style has very large impact on the company and may affect the staff both positively and negatively, which also reflects in the final effectiveness of the entire organization (Jelačić & Stasiak-Betlejewska, 2010).
The aim of the work is evaluation of leadership styles and leadership qualities of employees (divi-sion manager) in the four-star hotel. Managers were evaluated by the hotel staff. The evaluation was made using selected questions from BOST survey (exactly three), which are the answer to ninth principle of management Toyota and Toyota’s leadership model. The aim of the study is to answer the question of whether investigated hotel educates their leaders, i.e. managers in ac-cordance with a Toyota approach (whether hotel cares about development of their own people - managers and employees). Leaders by Toyota are treated as “builders of learning organization” who operate using thesis: “This is our purpose and direction - I will lead you and take care of you”. The combination of in-depth understanding of the work and the ability to develop peo-ple, makes employees respect them for technical knowledge and will follow them through their leadership abilities.
In the context of paragraph „research and analysis of results methodolog y” the presentation of the
re-search method will be made, i.e. rere-search “BOST - Toyota’s management principles in the ques-tions.” Then will be presented the research aim, the final results of these studies and what extent the information obtained from research can be used in the future - to modify/change
manage-ment style. In second paragraph “presentation of results and statistical analysis” the research facility
and the results of the statistical analysis of responses in the field of evaluation managers (E9b) is shown. The evaluation of employees (E9c) using statistical and positional parameters and whisk-ers-box plot is also included in this step. Next paragraph (“identification of the structure of leadership
styles”) presents the analysis results of the management styles structures. The structure of ratings on human and service issues can be as the basis to develop a grid of managers determining the dominant management style in the analysed hotel. It has been verified what extent management style in the hotel coincides with the Toyota’s optimum, that is management style used in Toyota
analysis of results in the scope of the direction and significance of correlation coefficient are shown. Correlation analysis results were made in the field of evaluation of brand managers E9c and in the field of potential employee’s evaluation (E11c). In the sixth paragraph “assessment of
managers’ brand and employees’ potential and development possibilities”, the presentation of results analysis of the brand managers based on responses to the question marked as E9c was made. Based on the responses for the E11c question from the BOST survey an evaluation and division of staff in view of their suitability for the organization is considered. In the last paragraph the summary and conclusion were described.
Toyota company has shown how to develop leaders who will enrich the organization, compre-hensively understand their own work, live overall concept of the company and teach others. Toyota leaders are role models, they understand the daily work in all its details, they are the best teacher of overall concept for staffs, embodying the way of doing business. In order to improve the way of doing business and the way of manage people it has to be determined firstly what this way it is now. For this purpose, it can be used the BOST survey.
Identification and analysis of management styles, leadership features and managers brand via the BOST surveys will provide comprehensive information about the current managers potential and their road towards improvement in accordance with the Toyota “spirit”.
2. RESEARCH AND ANALYSIS OF RESULTS METHODOLOGY
In the article as a research method was used a BOST method. The BOST method was elaborated by prof. Borkowski, director of Institute of Production Engineering on Faculty of Management in Technical University in Czestochowa, who gives this toll his name (acronym BOST derived from the first two letter of name and surname of the research method’s author). The BOST method, exactly the BOST poll is coming with prof. Borkowski fascination of Toyota and its management and production system, which was in essentially way presented in Toyota house model and was described in details in the book of The Toyota Way: 14 Management Principles from the World’s Greatest Manufacturer by Jeffrey Liker. In his book Liker calls the Toyota Way “a system designed to provide the tools for people to continually improve their work.” The system can be summarized in 14 principles (Liker, 2005). This method has used toyotarity concept, which is a scientific discipline dealing with the man-man relations and a man-machine relations with regard to the process approach, Japanese culture, especially Toyota (Liker, 2005), aimed at con-tinuous improvement of the use of knowledge (Borkowski, 2012). The BOST research is known as Toyota’s management principles in question is a toll which contains set of questions that allow to estimate production and services companies and their resources for the sake of utilization of modern rules of management in the context of Toyota’s achievements. The name of this toll and the structure is protected by low (Borkowski, 2012). The BOST is a research tool that uses a questionnaire technique aimed to workers and their superiors opinion collecting as the source of opinions about the organizations that apply Toyota’s principles (Borkowski, Knop & Szklarzyk, 2013).princi-ples, which may have never heard. These principles are the principles of the Toyota management (14). The BOST survey has two versions: a version for employees and a version for supervisors. The BOST survey has had wide application. It allows to evaluate: the importance of 14 factors describing the Toyota management principles; management styles (including Toyota optimum); leadership features, manager; employees/customers satisfaction; commanding features of man-agers; directors features of manman-agers; do the team or individual self-assessment; build 3x3 ma-trix; managers brand; the importance of improving the driving forces; the validity of the factors to achieve the goals; obtain information about the structure of the human potential; taking into account gender, education, age, job experiences, mobility, the mode of employment.
The BOST research are innovative and unique research in the world, which have been carried out only in Poland so far, among different companies (manufacturing and services), so at the mo-ment it is not possible to compare their results with other organizations in the world. The authors have not met with similar studies that concern the thematic scope such as the BOST research.
Value of the Toyota is behaviour of the entire senior staff (managers, superiors) of the organiza-tion should be aimed at aiming the organizaorganiza-tion to the total quality. Leaders of the Toyota (man-agers) are guided by special conceptions and apply specific Toyota road’s methods. The passion of Toyota leaders is drawing people into Kaizen – improvement of increase value realizing by them. However, supporting the commitment isn’t still favouring
the Toyota leader. Besides general managerial experience also far-reaching understanding the work is needed. According to Toyota principles, such a manager, who is relying on the top-down leadership and administers experience only in the scope of general management (bureaucratic manager), is least efficient manager. The large part of American managers are ranked to this cat-egory. They are creating the plenty of rules and principles and measurements of the work fitness in its light. It is leading to management directed to measures, which are dissuading the attention from clients’ fulfilling or the structure learning the organization (Jelačić & Stasiak-Betlejewska, 2010).
General idea of managers’ features that concerning Toyota leadership was concluded in the ninth management principle of Toyota. It says that, a world manufacturing leaders are like ‘grow lead-ers who thoroughly undlead-erstand the work, live the philosophy, and teach it othlead-ers’. According to this principle, fundamental task of Toyota leader is to build a learning organization, thus strengthening of particularly strong element of culture in this company. The main aim for each manager in modern enterprises is employees development in the direction of joint goals achiev-ing and thinkachiev-ing like the Toyota’s way. Enterprises like these one are ‘buildachiev-ing learnachiev-ing organiza-tion’ acting for real long-term successes (Liker, 2005). Management these days is about taking responsibility for a situation. Toyota’s leaders are leaders who are clear about the purpose and direction; at the same time they remain close to the business and have a deep understanding of the work. A manager needs to have a deep understanding of the Value to the customer. The value consists of “the right thing” for the customer and that the work is done “the right way” for the customer (Malmquist, 2013).
Eb. Rate the importance of the following factors in your hotel with using a scale from 1 to :
SL - human affairs, ZP - service issues.
where: 1 - disinterest, 8 - high interest.
In this question, the staff expressed their views on importance and interest by the management of human affairs, and manufacturing issues.
Respondents were asked also to answer to next two following issues as part of the BOST research:
Ec. Evaluate your superior with the use a scale from 1 to according to (1 – low, – high):
PA commitment, communication, activities (total)
PB effectiveness of his/her decision
E11c. Rate on a scale from 1 (low) to (high) your:
YA Effects of work
YB Potential for self-development
The survey has a ranking scale, which means that the respondents were given the task to assess the validity of a given factor by giving one of the numbers within the limits of the scale. The results were used to further scientific analysis.
The main aim in the research work was to determine leadership styles and managers brand in the research object - four-star hotel in view of the ninth Toyota management principle and the Toyota leadership model based on the results from the BOST survey. The main goal of the research was achieved by using two sub-goals. The first goal was to assess the degree of involve-ment of managers in case of “service” and the human. On this basis, a specific manageinvolve-ment style of managers will be determined, which will be referenced to the “Toyota optimum”. The second goal is to evaluate the managers’ directive behaviors (the effectiveness of their decisions) and support behaviors (the communication, commitment) in the hotel by analyzing the managers brand map. The aim of this study was also assess the potential development of the analysed hotel and on this basis, it will be determined the strategic position of the analysed object by means of modified BCG matrix (i.e. personal). This analysis will determine the percentage of the hotel staff who create their strong competitive position in market.
The BOST study sample consisted of 37 employees of analysed hotel. They were employees of different hotel departments (reception, service, cuisine). The employees sample for the BOST research was selected randomly. Percentage of surveyed employees amounted 80%.
convenience and comfort,
good cuisine,
excellent office equipment of conference halls,
communication availability.
This hotel was nominated to the Best Hotel Award in the following categories: the best 4*-5* hotel in the Silesia region and,
the best hotel in the conference category.
This award is a very prestigious award of the hotel trade. The following factors decided about the nominee:
the popularity of the hotel among clients, what means the number of website presentations and reservations made in 2012 via Internet,
the level of object’s opinions and evaluations among both clients and own perceptions.
The Hotel received also a certificate and promotion emblem of “Gold Standard in Client Serv-ice” in 2011. This award is granted to companies that fulfill requirements of high level of service quality (Borkowski, Knop & Stasiak-Betlejewska, 2013).
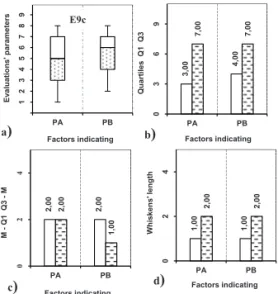
Knowing the specificity of the research object it can be proceed to the proper analysis of the results. At the beginning the statistical analysis of results relating to the E9c and E11c ques-tions were carried out. For a graphical approach to relaques-tionships between the selected statistical parameters the box-and-whisker plots were used (Pułaska-Turyna, 2008) (Fig. 1 and 2). Graph of this type will be evidenced, inter alia, the median, quartiles (Q1 and Q3), the length of the whiskers on the chart type.
Fig. 1 - Brand of manager. Box-and-whisker plots and its elements: a) basic graphs, b) Q1 Q3 quartiles, c) M - Q1, Q2 - M suitably, d) length of whiskers: upper (without filling), lower (with filling) for factors in E9c area.
Source: own study 1 2 3 4 5 6 7 8 9 PA PB E v a lu a ti o n s ' p a ra m e te rs Factors indicating D (F 3 ,0
0 4,0
Fig. 2 - Matrix BCG personal. Box-and-whisker plots and its elements: a) basic graphs, b) Q1 Q3 quartiles, c) M- Q1, Q2 - M suitably, d) length of whiskers: upper (without filling), lower (with filling) for factors in E9b area.
Source: own study
The analysis of Figure 1 showed that the commitment, communication, activities (PA) factor was selected almost whole range of responses beyond the assessment of the best “9”. Similarly, in the case of effectiveness of his/her decision (PB), but here the highest and the lowest assessment of “1” was not selected. The middle value, or median is at a level of 5 for PA and at the level of 6 for the second PB factor. Median position in the box is also a source of information about the skewness in the central part of the system. When the median lies straight middle between the other quartiles, the distribution is symmetrical in the central part, such as in case of the commit-ment, communication, activities (PA) factor. When the median is positioned closer to the first quartile, the central portion of the distribution is skew right-sided (positive). Moving median closer to the third quartile shows the left-sided skewness (negative) with respect to the 50% central of population, such as in case of the second research factor the effectiveness of his/her decision (PB). As for the length of the whiskers for both factors the left whisker is longer than the right, which indicates the left-sided skewness (asymmetry) for both research factors.
From the analysis of Figure 2 it is clear that the variation of the results for the factor potential for self-development (YB) is greater than for effects of work (YA). The median is at the level of 4 for YA factor, and 5 for the next YB factor. In case of the first effects of work (YA) factor central part is skew right-sided (positive), while for the second factor the distribution in the central part is symmetrical. The length of whiskers is the same for both analyzed factors, which indicates the symmetry of whole distribution.
1 2 3 4 5 6 7 8 9 YA YB E v a lu a ti o n s ' p a ra m e te rs Factors indicating D
(F 3 ,0
0 4,0
4. IDENTIFICATION OF THE STRUCTURE OF LEADERSHIP
STYLES
A key to identify a directing leadership styles in the hotel were responses to the E9b question from the BOST questionnaire. The survey results were a prelude to the in-depth analysis and identification of dominant directing leadership styles in the analysed hotel. In the first place a brief statistical analysis was made (Fig. 3).
Fig. 3 - Classic styles of management. Box-and-whisker plots and its elements: a) basic graphs, b) Q1 Q3 quar-tiles, c) M - Q1, Q2 - M suitably, d) length of whiskers: upper (without filling), lower (with filling) for factors in
E9b area. Source: own study
Figure 3 shows that the human affairs (SL) factor was selected almost in the whole range of re-sponses, beyond the assessment of the best “9”. In the second case the service issues (ZP) factor it can be seen another situation. Ratings of “1”, “2” and “9” were not selected. The middle value is at the level of 4 for factor SL and 6 for the ZP factor. The median is positioned closer to the first quartile for the SL factor, which means that the central part is characterized by a right-sided (positive) skewness of distribution. In turn, for the ZP factor, median shift was closer to the third quartile, which proves the left-sided skewness (negative) with respect to the central 50% of the units collectively. The length of whiskers is the same in both studied factors, reflecting the symmetry of the entire distribution.
At a later stage of the analysis (Fig. 4) the general distribution of directing styles on the map was presented with regard to the E9b area of the BOST research, Toyota’s optimum and method by professor Borkowski. According to this concept, the map presented in Figure 4a divides direct-ing styles into four main types: integrated style, autocratic style, not intrusive, and democratic (Borkowski, Pieszczoch & Bartnik, 2009). In Figure 4b, c marked an optimal area, characterized by knowledge, understanding of work of Toyota leaders. This area includes elements of all sepa-rated fields (quadrants) and applies to: box A - 55, 56, 57, 65, 66, 67, 75, 76, box B - 54, 64, 74, box C - 44, box D - 35 , 36, 45, 46 measuring points. A total optimum on Toyota’s leadership map takes 16 points of measurement, which in relation to 64 is 25%. Membership of measurement points map to the optimal area for the individual quarters is not the same: A field - optimum includes 8 points or 50%, B field - 3 measuring points (18.8%), C field - only 1 point (6.2%) D field - 4 points (25%).
1 2 3 4 5 6 7 8 9 SL ZP E v a lu a ti o n s ' p a ra m e te rs Factors indicating D
(E 3 ,0
0 4,0
0
6
,0
0 7,0
1 Fig. 4 - a) Management styles and their distribution. Map of Toyota’s leadership with regard to b) author approach,
c) original version. Source: (Borkowski, Jagusiak & Żelechowski, 2009; Borkowski, Ulewicz & Bartnik, 2009; Malmquist, 2013)
Therefore, there is a question here: which of presented management styles is the forefront in the analyzed research facility? In order to answer the above question, characteristic distribution of ratings on the leadership map and percentage distribution of ratings on the area leadership map, taking into account the Toyota’s optimum, which has been presented in Figure 5.
Fig. 5 - Classic styles of management. Characteristics: a) the distribution of ratings on the leadership map, b) distribution (%) ratings on the area map management, taking into account the optimum Toyota. Indicators: ░SKO
█WGC □SOT. Source: own study
Figure 5a is the basis to determine which map area management has cast the most votes of the respondents. This area is the area of B, which means that the respondents considered the hotel, dominates the autocratic management style (14 votes). Analyzing Figure 5a, the fact that much less - 12 votes were cast in the area A corresponding to integrated style. Therefore the hotel is dominated by two main directing styles: autocratic and integrated style. This means that the supervisor is the person that encourages subordinates to use their abilities, working in a team. However, while this is a definite person, issuing commands in the form of orders and making decisions often without consulting employees.
Number of votes cast for individual directing styles was the basis for further analysis and calcu-lations of SKO, SOT and WGC presented in Figure 5b. SKO ratio is expressed as
a percentage, by dividing the number of votes of the area map management styles (A, B, C or D) in relation to the total number of votes. The highest value for this indicator was observed in the
1 2 3 4 5 6 7 8 S c a le o f h u m a n p ro b le m s a) C D
1 2 3 4
Scale of service
C D Democratic style Not intrusive style
5 6 7 8
es problems A B Integrated style Autocratic style A 1 2 3 4 5 6 7 8 S c a le o f h u m a n p ro b le m s b)
1 2 3 4 Scale of service
5 6 7 8 e problems c)
4 2 1 5 4 1 5 1 5 4 5 4 2 1 1 4 4 5 1 1 1 2 1 1 1 1 1 2 2 1 2 4 1 1 1 4 1 1 2 3 4 5 6 7 8
1 2 3 4 5 6 7 8
S c a le o f h u m a n p ro b le m s
Scale of service issues a) B A D C 3
2 41
1 9 8 47 21 21 11 7 5 2 7 5 7 6 7 0 3 0 6 0 9 0
A B C D
P e rce n ta g e s h a re [% ]
Indication of directing styles b)
case of the B - 41%. SOT ratio is the ratio of the number of votes cast by the respondents in the optimum Toyota area in relation to all the optimum Toyota. This ratio was highest for the area A - 75%. In turn, the WGC indicator is the ratio of the number of votes cast in the map area man-agement styles in relation to the area (A, B, C or D) of optimum Toyota. In this case, the ratio obtained for A area, gained the highest value at the level of 47%. To sum up, it is worth noting that the area of optimum Toyota is 51.4% of the votes of all the respondents.
The final stage was the presentation of spatial analysis results, which are presented on Figure 6.
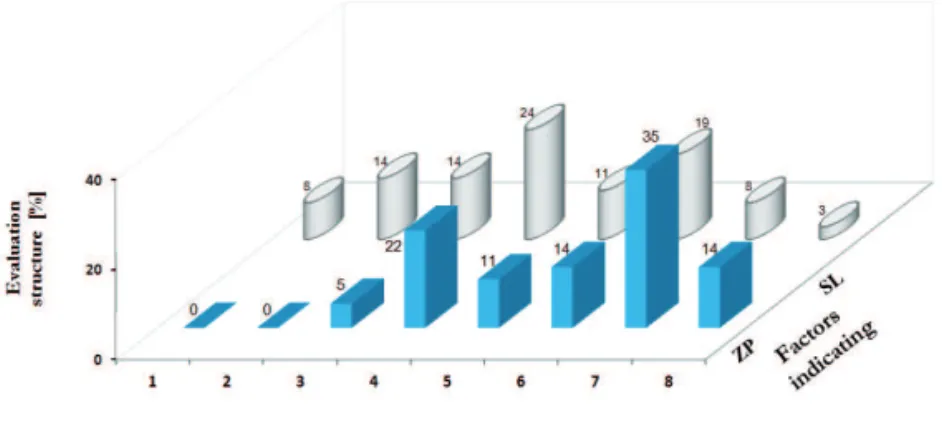
Fig. 6 - Classic styles of management. E9b area. Evaluation structure of the research results. Source: own study
Figure 6 presents the structure of the percentage allocated to evaluations. From Figure 6 it can be concluded that the largest number of respondents (24%) has awarded “4” rate to the human affairs (SL) factor. Also, the high number of votes (7) casted in this case the evaluation of “6”. In turn, for the second test agent service issues (ZP), the highest number of votes (35%) were cast for high score “7”. In conclusion, it is worth noting that the respondents definitely more important element in the operation of the hotel are service issues. This problem seems to be far more important than the issue of human affairs. It is a signal to the supervisor that perhaps too little attention to his subordinates and do not always care about their welfare. It might be worth a closer look at the motivational system, style of management, or other aspects related to the management of human resources, which would ensure that human affairs are equally important in the studied hotel, which service-related issues the functioning and efficiency of the object.
5. CORRELATION ANALYSIS, DETERMINE THE IMPACT OF THE
RESPONDENTS FEATURES
the analysed factors differ significantly in terms of the individual respondents’ characteristics in the research hotel. Direction of correlation dependence indicates sign of correlation coefficient, if the correlation coefficient is negative it means that with the increase (decrease) in the value of one variable decreases (increases) the value of the other variable, if the correlation is positive (positive) increasing the values of one variable correspond with increasing the values of the other variable.
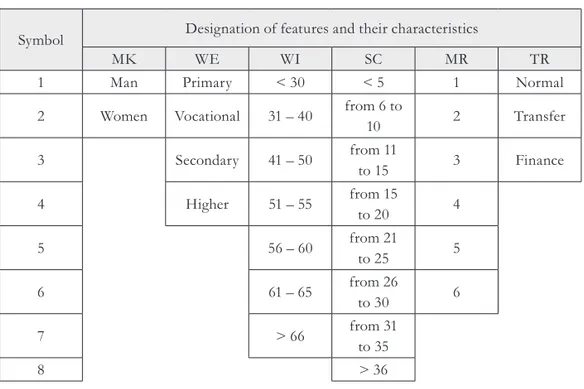
The analysis of correlation is conditional upon the existence of two sets of data, representing the explanatory variable and the dependent variable. Explanatory variable are the respondents‘ features: gender (MK), education (EC), age (WI), seniority (SC), mobility (MR) and the mode of employment (TR). Each of the variables is found in several variants (2, 4, 7, 8, 6, 3). Characteris-tic of respondents‘ features has been included in Table 1.
Tab. 1 - Features of respondents. Characteristic. Source: own study
Symbol Designation of features and their characteristics
MK WE WI SC MR TR
1 Man Primary < 30 < 5 1 Normal
2 Women Vocational 31 – 40 from 6 to
10 2 Transfer
3 Secondary 41 – 50 from 11 to 15 3 Finance
4 Higher 51 – 55 from 15
to 20 4
5 56 – 60 from 21 to 25 5
6 61 – 65 from 26
to 30 6
7 > 66 from 31
to 35
8 > 36
According to the research methodology adopted for the correlation analysis it should be taken into account two parameters: the significance levels α, assumed the existence of three levels (0.2, 0.1, 0.05, which was determined by the line, the lines closest to zero indicates
the significance level of 0.2, central line - on the significance level of 0.1, external - 0.05), and the direction of the impact (positive/positive - bars pointing right, and negative/negative - bars pointing to the left).
Fig. 7 - Brand of manager. Combination in 3D system of correlation analysis results for an influence of respondents’ features on importance evaluation factors in E9c area for different level α. Source: own study
Figure 7 shows that for the five respondents’ features in the basal plane are only contours of basic geometric figures. This means that there is no impact on the level of the characteristics of two considered factors describing the superiors’ features. Respondents’ features did not affect on the validity of subjective factors ratings are: education (WE), age (WI), job seniority (SC), mobil-ity (MR) and the mode of employment (TR). Only PA factor is correlated with gender (MK) and only at the level of α = 0.2; direction of the impact is positive. This means that respondents who are women evaluate the factor above (better) than respondents who are men.
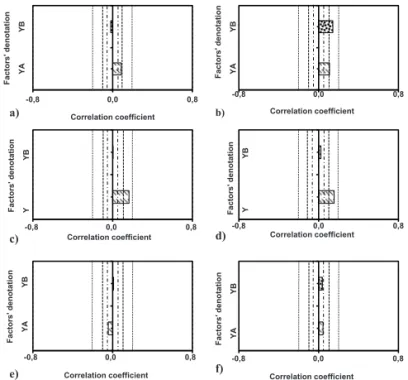
The results of the correlation analysis are also presented for the ratings on factors from E11c ques-tion in the form of so-called correlaques-tion graphs (Borkowski, Knop & Szklarzyk, 2013) (Fig. 8).
Fig. 8 - Personal BCG matrix. Correlation graphs of evaluations in E11c area depending on the respondents features: a) gender, b) education, c) age, d) job seniority, e) mobility, f) the mode of employment. α = 0,2 (internal
lines), α = 0,1 (central lines), α = 0,05 (external lines). Source: own study
<$
<%
&RUUHODWLRQFRHIILFLHQW
)DFWRUV
GHQRWDWLRQ
D
<$
<%
&RUUHODWLRQFRHIILFLHQW
)DFWRUV
GHQRWDWLRQ
E
<
<%
&RUUHODWLRQFRHIILFLHQW
)DFWRUV
GHQRWDWLRQ
F
<
<%
&RUUHODWLRQFRHIILFLHQW
)DFWRUV
GHQRWDWLRQ
G
<
$
<%
&RUUHODWLRQFRHIILFLHQW
)DFWRUV
GHQRWDWLRQ
H
<
$
<%
&RUUHODWLRQFRHIILFLHQW
)DFWRUV
GH
QRWDWLRQ
The analysis of the correlation coefficient value indicates that on the level of significance α = 0.05, it can be concluded that there is no significant statistical relationship between the respond-ents’ personal characteristics and the ratings on the research factor from the E11c area.
At the level of significance α = 0.1 it can be concluded that the respondents vary significantly due to:
education (EC) in the evaluation of factors identified as YA (positive correlation),
age (WI) in the evaluation of factors identified as YA and YB (positive correlation),
seniority (SC) in the evaluation of factors identified as YA (positive correlation).
At the level of significance α = 0.2 it can be concluded that the respondents differ significantly based on gender (MK) in ratings on factor labeled as YA (positive correlation).
6. ASSESSMENT OF MANAGERS BRAND AND EMPLOYEES’
POTENTIAL AND DEVELOPMENT POSSIBILITIES
To the hotel workers in the survey were asked the question from the BOST survey marked as E9c: Rate on a scale of 1 to 8 superior in terms of (1-low, 8-high):
PA commitment, communication, activities (total)
PB effectiveness of his/her decisions
Using the ranking scale in scope of 1-8 allows to create a map of the managers brand at the ho-tel. The division of the map into 4 parts leads to the separation of four quarters that represent two levels representing the effectiveness of the managers decision i.e. low (assessment 1-4) and high (5-8) and two levels in terms of such aspects as communication, commitment and action of managers (taken as a whole), i.e. low (assessment 1-4) and high (assessment 5-8).
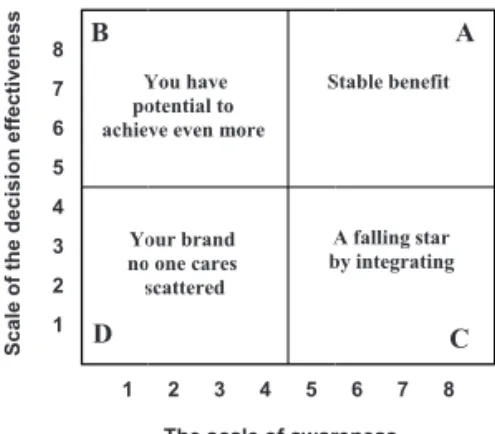
Figure 9 shows the general version of the map of the brand manager, together with separated four quarters and their meaning.
Fig. 9 - Map of the manager brand. Source: own study
1 2 3 4 5 6 7 8
1
S
c
a
le
o
f
th
e
d
e
c
is
io
n
e
ff
e
c
ti
v
e
n
e
s
s
D B
Y po achie
Yo no
s
2 3 4 5
The scale of awar
You have otential to ve even more
S
A b our brand o one cares scattered
6 7 8
reness A
C
Stable benefit
One of the matrix side reflects the effectiveness. High effectiveness means that the supervisor has ability to complete realization of what he promises, regardless of whether it concerns a prod-uct, person or the whole system. Low effectiveness is inability to fulfill the promises given by supervisor - he is not able to reflect up to expectations. High awareness means that the superior’s reputation (brand) goes far - it is known by many people. Low awareness is a symbol of relatively low supervisor’s recognizability (his brand).
The first summarizes the number of the ratings in terms of PA (empty rectangles) and PB factor (filled rectangles). The results are shown in Figure 10.
Fig. 10 - Managers’ brand. Number of ratings of awareness (PA) and efficiency (PB) validity - histograms filled. Source: own study
The graph shows that the aspects of superiors commitment, communication and action have been evaluated by staff at the medium level – ratings 4 and 6
(19 responses) were dominating, in turn, the effectiveness of their decisions has been evaluated at a high level - ratings 6 and 8 (7 responses in total) were dominating.
Distribution of ratings on the managers brand map for the research hotel along with the zoning map of the brand is shown in Figure 11.
Fig. 11 - Manager’s brand. Characteristics: a) the distribution of ratings on the brand map b) the distribution (%) of ratings on area of brand maps. Source: own study
The analysis of Figure 11 shows that in the opinion of many workers (35%) superiors have both a lot of directive behaviors (high effectiveness) and a lot of supporting behaviors (high
commu-2 2 6 6 3 7 4 7 0 2 4 1 0 2 9 4 6 0 5 1 0
1 2 3 4 5 6 7 8
E v a lu a ti o n s n u m b e r
E v a l u a t i o n s s c a l e
1 2 3 4 5 6 7 8
1 2 3 4 5 6 7 8
E ff ic ie n ty s c a le Awareness scale D & $ % ' 3 5 2
2 22 22
0 3 0 6 0 9 0
A C D B
P e rc e n ta g e s h a re [% ]
Indicating spheres of mark's map E
nication skills, commitment) - the majority of the managers go to the “best” “A” quarter. This means that superiors achieve high efficiency, which guarantees the full realization of the objec-tives. High communication skills means however that the managers’ brand reputation reaches far - it is known by many hotel’s employees.
The share of responses in the other quarters is the same and amount 22%. 22% of employees believe that managers have the potential to achieve even more (poor communication skills, high efficiency). It means that, according to employees, managers facilitate subordinates to the task execution and support them by sharing the responsibility for decision-making.
From Figure 11 it can be seen also that 22% of respondents identified their superiors as so called “shooting stars”, according to them managers use too many directive behaviors (high commu-nication skills) and not enough supporting behaviors (low efficiency). This means that accord-ing to the staff, the managers communicate only concrete guidances and strictly supervise the execution of the task.
In the opinion of 22% employees, managers use both little supporting behaviors (low effictive-ness) and the same directive (low communication). This behaviour means that the managers‘ brand no one cares. Low effectiveness means the inability of total realization of hotel managers‘ promises. Poor communication means however low managers‘ brand recognition. Managers com-municate to subordinates the responsibility for the decisions making and solving the problems. An important element of Toyota’s management style is the development of its own employees, which is implemented, among others by training (Liker J. K., 2005). Specialists sholud be in any enterprise. In their absence, it is a need to “buy” them (Borkowski, Jagusiak & Żelechowski, 2013). A company’s competitiveness increases when its employees have a chance to develop and improve. There is a phrase we have always had at Toyota that says: “build quality in at each work process.” („Leadership Style at Toyota“).
Next, the research results of employees evaluation were presented. The employees in question marked as E11c were asked to judge each other i.e. the results of their work and the potential of their own development. Content of the question marked as E11c is following: E11c. Rate with the scale from 1 (low) to 8 (high) your own:
YA effects of work
YB potential for self-development
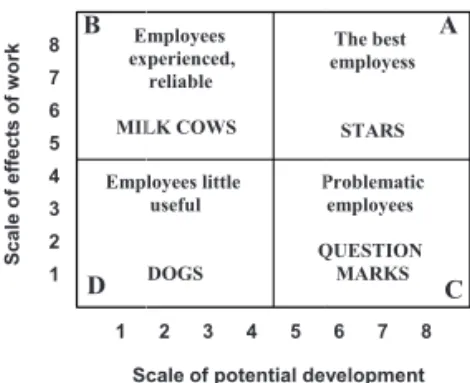
Fig. 12 – General characteristics of the personal BCG matrix. Source: own study
Based on the answers given by employees created the personal BCG matrix showing the distribu-tion of ratings in the BCG matrix zones and thier zone structure (Fig. 13).
Fig. 13 - Characteristics of the factors validity - the potential for development (YB) and the effects of work (YA): a) the distribution of BCG matrix areas, b) the structure of areas. Source: own study
The analysis shows that 38% of employees assess themselves as having a high potential for development, with low effects of their own work, they claim that their potential is not fully tapped in relation to the possibilities - the effects of work are low, but may be greater if their de-velopment (through training, coaching, mentoring, counseling) will be properly managed. 24% of employees believe that the results of their work are large in relation to the low potential for development. 22% of workers say that he sees great potential for development and large effects of work. The smallest is the group of employees that evaluates low both their effects of work and their potencial development (16%).
7. SUMMARY AND CONCLUSIONS
In the work the analysis of the management and leadership styles among managers (i.e. workers of management division) at the 4-star hotel in Poland was conducted. The analysis was based on an innovative survey „BOST-Toyota’s management principles in questions“, which were carried out in the research objects. In the analysis was used three questions from this survey marked as E9b, E9c and E11c. Survey people were blue collar workers.
1 2 3 4 5 6 7 8 1 S c a le o f e ff e c ts o f w o rk Sc D B E ex MIL Emp
2 3 4 5
cale of potential de
mployees xperienced, reliable LK COWS P Q loyees little useful DOGS
6 7 8
velopment A C The best employess STARS Problematic employees QUESTION MARKS 1 2 3 4 5 6 7 8
1 2 3 4 5 6 7 8
S c a le o f e ff e c ts o f w o rk
Scale of potential development D & $ % ' 2 2 3 8 1 6 2 4 0 3 0 6 0 9 0
A C D B
P e rc e n ta g e s h a re [ % ]
Using the E9b question was intended to indicate in the research hotel the importance of human affairs and service issues, and on this basis identify the dominant style of directing. According to the staffs of research hotel (its management department) pay more attention to issues rather than matters of human service, which is information that they need to pay more attention to subordinates, employees may feel unappreciated and disrespected. The analysis showed that in the research hotel dominate two main leadership styles: autocratic style (task-oriented, utilities) and integrated.
Using E9c question was intended to evaluate the managers’ brand in terms of their commitment, communication, actions (in total) and the effectiveness of their decisions. The analysis showed that the aspect of commitment, communication and operations of managers was evaluated by the staff at the secondary level, while the effectiveness of their decision has been assessed at a high level. In the opinion of employees superiors have both a lot of directing behavior (high effi-ciency) and a lot of supporting behavior (high communication skills, commitment). This means that superiors achieve high effectiveness, which guarantees the full realization of the objectives. High communication means that the reputation of the managers brand is far-reaching.
In E11c questions workers assessed themselves, own potential for self-development and the ef-fects of work. The largest number of employees believe that their potential is not fully tapped in relation to the possibilities - the effects of work are low, but may be larger if their development will be properly mastered.
In summary, personnel participating in the BOST study - the employees (the most important resource in every company) found much valuable information about level of managers’ interests in the scope of human problems and service issues in analysed hotel, they allowed to determine the leadership profiles of theirs own managers and allowed to determine their own potential and suitability for the hotel.
References
Borkowski, S. (2012). Toyotaryzm.Wyniki badań BOST. Warszawa: Wydawnictwo
Menedżerskie PTM.
Borkowski, S. (2012). Zasady zarządzania Toyoty w pytaniach. Wyniki badań BOST. Warszawa:
Wydawnictwo Menedżerskie PTM.
Borkowski, S., Knop, K. & Szklarzyk, P. (2013). Evaluation of Superiors with the Use of 12th Golden Rules of Toyota and the BOST Research in a Company from Machinery Branch. In S.
Borkowski & M. Popa (Eds.), Toyotarity. Strategic Factors Development of Companies (p. 86-99), Ankara: Savas Kitapve Yaymevi.
Borkowski, S., Stasiak-Betlejewska, R. & Knop, K. (2013). Superior Leadership Qualities in
the Public Administration Unit (p. 29-37). Zbornik vedeckych prispevkov z medzinarodnej vedeckej konferencie “Young V4 Science 2013” = II. International Scientific Conference on Young Science Conference Proceedings “Young V4 Science 2013”. 02-04.10.2013, Bratislava: Vysoka skola ekonomie a manazmentu verejnej spravy v Bratislave.
Borkowski, S., Knop, K. & Stasiak-Betlejewska, R. (2013). Satisfaction Evaluation of the
Hotel Staff. In S. Borkowski & J. Rosak-Szyrocka (Eds.), Servqual as Instrument of Services
Improvement and Resources Management (p. 81-92), Celje: Faculty of Logistics, University of Maribor.
1.
2.
3.
4.
Borkowski, S., Pieszczoch, D. & Bartnik, T. (2009). Concepts of leadership maps and managerial grid. In: Borkowski S. & Shevtsova O.J. (Eds.), Toyotarity. Styles of management (p. 65-76). Dnipropetrovsk: Yurii V. Makovetsky.
Borkowski, S., Ulewicz, R. & Bartnik, T. (2009). Management styles at the middle management level – a new approach. In: Borkowski S. & Shevtsova O.J. (Eds.), Toyotarity. Styles of management (p. 89-100). Dnipropetrovsk: Yurii V. Makovetsky.
Borkowski, S. Jagusiak, M. & Żelechowski, J. (2009). Toyota’s Approach to Management Styles. In S. Borkowski & O. J. Shevtsova (Eds.), Toyotarity. Styles of Management (p. 77-88). Dnipropetrovsk: Makovetsky.
Jelačić, D. & Stasiak-Betlejewska, R. (2010). Managers Evaluation in Production Plants of Wooden Industry. In S. Borkowski, D. Jelacic & R. Stasiak-Betlejewska (Eds.), Points of
Woodworking Industry Development (p. 122-138). Dnipropetrovsk: Yurii V. Makovetsky.
„Leadership Style at Toyota“. Retrieved May 4, 2011 from: http://www.managementparadise. com/forums/foundation-human-skills-f-h-s/221130-leadership-style-toyota.html Liker, J. K. (2005). Droga Toyoty. 14 zasad zarządzania wiodącej firmy produkcyjnej świata.
Warszawa: MT Biznes.
Fołtyn, H. (2009). Praca współczesnych menedżerów. Warszawa: Wydawnictwo Naukowe Wydziału Zarządzania Uniwersytety Warszawskiego.
Koźmiński, K. A. & Jemielniak, D. (2008). Zarządzanie od podstaw. Warszawa: Wydawnictwo Akademickie i Profesjonalne.
Kuc, B. R. (2004). Od zarządzania do prz ywództwa. Warszawa: Wydawnictwo Menedżerskie
PTM.
Malmquist, P. (2013). The Evolution of Leadership Styles. Agile Leadership. Retrieved March 12,
2015 from: http://www.applitude.se/2011/04/the-evolution-of-leadership-styles/ Pułaska-Turyna, B. (2008). Statystyka dla ekonomistów. Warszawa: Difin.
Contact information
Multi Prof. Stanisław Borkowski, PhD. Ing. Krz ysztof Knop, MSc Ing.
Kamila Adamus, MSc Ing.
Faculty of Management
Czestochowa University of Technolog y
Armii Krajowej 19B Street, 42-200 Czestochowa, Poland
e-mail: [email protected], [email protected], [email protected]
6.
7.
8.
9.
10.
11.
12.
13.
14.
15.