3D Simulation of a Medium scale Pool Fire
Naveen S*, Sivasubramanian V**
*(Department of ChemicalEngineering, National Institute of Technology, Calicut-673601)
**Corresponding author (Department of Chemical Engineering, National Institute of Technology, Calicut-)
ABSTRACT
Pool fires represent the most frequently encountered accidents of the different types of fires that are known to occur in the Chemical Process Industry (CPI). Exhaustive analysis of the history of past accidents in CPI's that have occurred across the world since early 1900's reveal that pool fires are major threats to industrial safety, and result in huge losses of life and property. Studies have been going on to study the interaction mechanisms of the fire and models have been developed which were mostly empirical, zone models and field models developed according to and based on the conditions available for the experiment. The experiment considered consisted of a 2-m-diameter methanol pool in an unconfined area with a cross-wind velocity of 13 m/s. Steady state simulations with uniform time step were done using computational fluid dynamics and the simulations showed sensitivity to the grid refinement, size of the pool and wind profiles.Comparison between calculated and experimental results are also made.Turbulence models were also investigated, and was observed that RNG model gave more predictable results for the test cases to the accuracy of almost 80%.
Keywords
–
Fire, Modeling, Unconfined, TurbulenceI.
INTRODUCTION
Accidents are a common occurrence in the process industry and can occur during transportation, storage and processing. Suchman [1] defines an event to be an accident if the occurrence is unexpected, unavoidable and unintended. He also adds that an event is more likely to be described in terms of its causal factors and less likely as an accident. With respect to this, accidents in a CPI can be broadly classified into three, namely Fire, Explosion, and Toxic releases[2]. All the three accidents are destructive and can cause severe loss to life and property, if not taken care of. A number of incidents can cause fire in process industry. This may arise as a result of leakage or spillage of flammable substances, cracks in the pipelines or vessels or abrupt change in the operating temperature or pressure of the system. Irrespective of the type of fire, it can cause huge monetary losses and loss of human life. The fires in process industry are classified according to the type of release into three groups, namely: jet fires, pool fires and flash/vapor cloud fires, the severity of which are varied and the occurrence of these fires defines the nature and the extent of occurrence of the fire.
In general, pool fires occur in pools of fuel, which can occur due to a release scenario either due to rupture of pipelines transporting the fuel, or in storage tanks where huge volumes of fuel are
stored[2].Lees [2] states ‘a pool fire occurs when a flammable liquid spills onto the ground and is ignited. A fire in a liquid storage tank is a form of pool fire, as is a trench fire. A pool fire may also occur on the surface of flammable liquid spilled onto
water’.Fay [3]defines pool fire as ‘a diffusion flame
driven entirely by gravitational buoyancy’. Hamins et. al.[4] define pool fire as ‘a buoyant diffusion
flame in which the fuel is configured horizontally’. Although the name implies that the fuel is a liquid, it may be a gas or a solid.
The severity of pool fires was notable in the accidents recorded in accident databases developed and maintained by various countries of the world, namely for example:
Major Hazards Incident Data System (MHIDAS) and the corresponding explosives data system EIDAS. These are operated by SRD (Safety and Reliability Directorate, UK Atomic Energy Authority) [5]
The FACTS incident database [6].
The Major Accident Reporting System (MARS)[7], [8]
The FIRE incident database for chemical warehouse fires
The Offshore Hydrocarbon Release (HCR) database [9]
Table 1 Classification of fires [10]
Type Number of incidents % of type
Fire 2413 87.4
Pool Fire 112 4.06
Tank Fire 111 4.02
Vapor/flash Fire 98 3.55
Jet Fire 15 0.54
Fireball 11 0.40
Fire storm 1 0.04
Total 2761 100
The analysis or study of the properties of the pool fire becomes important because of its sheer devastating potential as could be seen in Table 1. It could be observed that out of the total fires that occur in process industries, pool fires caused the maximum damage. The devastating potential of pool fires could be better observed from experiments conducted on laboratory scale or on a large scale. The difference between the experiments were that the laboratory scale experiments were developed based on the large scale tests, and that empirical models could be developed for the conditions and boundary conditions that were used for the specific experiment. These could be termed zone models, but for a better and specific understanding of the entire phenomena box models require to be developed[11]. The large scale tests became more frequent from the 1970’s, as Government funds improved and grants were allotted for the experiments. Tests were conducted throughout the world, most notably in the US and Europe, and were either on land or on water, as listed in Table 2 and Table 3 respectively. Different fuels were used, and the tests corresponded to a real fire scenario[12, 13].The experiments on land were simpler compared to spills on water, as the identification of the causes and the investments required are simpler and the
inventories are easier to be installed. The complexity of spills on water arises due to the type of spill that can occur and the variation in the properties of the fire that can arise because of that reason. The properties of the fire varied based on whether the release of water occurred on the surface of water, or from a shallow depth of water or spill was from a depth. The large scale experiments of pool fires on water were limited to either surface water releases or releases from shallow depths. There have been no experiments conducted which studies the nature of deep water releases, as the process is more complex and the investment required is very high.The experiments have mainly concentrated on the analysis of the burning rate and the flame height of the fuel. For a pool fire, the burning rate and flame height are found to vary greatly for different pool sizes. The geometry is assumed to be cylindrical and it is assumed that the combustion occurs in a quiescent and stable atmosphere. The only difference between the models applicable to the LNG fire on water and on land was the variation in liquid evaporation rate, the spill on water resulting inhigher evaporation rate, and hence a higher combustion rate [14, 8]. There was variation in the fire plume size, but the emissive power remained the same irrespective of
the surface [13,12].
Table 2 Tests on land
Sl no
Experiment Wind
speed (m/s)
Diameter of flame
Flame length (m)
L/D Ratio
Symmetry Burning
rate (kg/m2 s)
Average surface emissive
power (kW/m2)
Fraction of Combustion
Energy radiated (%)
Regression rate (m/s)
1 Esso, 1969 92 12 -16 1.6 x 10⁻⁴
2 Shell research
6.15 20 m LNG-
43
2.15 Cylindrical LNG – 0.106 LPG – 0.13
LNG- 153 LPG- 48
3 Gas de
France
2.7– 10.1
35 m 77 2.2 Circular
pool
0.14 290- 320
(narrow angle) 257-273(wide angle) 350 (max)
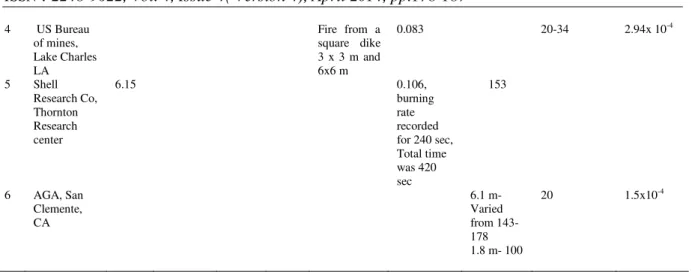
4 US Bureau of mines, Lake Charles LA
Fire from a square dike 3 x 3 m and 6x6 m
0.083 20-34 2.94x 10
5 Shell
Research Co, Thornton Research center
6.15 0.106,
burning rate recorded for 240 sec, Total time was 420 sec
153
6 AGA, San
Clemente, CA
6.1 m- Varied from 143- 178 1.8 m- 100
20 1.5x10⁻⁴
II.
POOL FIRE MODELING
Pool Fire modeling involves determining the dynamics of fire from the time it starts burning until it recedes. This involves understanding the nature of the fire burning and involves study of pool spreading, dependency of the intensity of fire on its shape, turbulence generated and the temperature at the different fire zones. For the pool fire experiments on land, measured the intensity of the fire, as the instrumentation was easier and could be observed that such fires generated a large amount of smoke. It is important for risk management planning to understand the predicted consequences of a spill. A key parameter in assessing the impact of a spill is the pool size. Spills onto water generally result in larger pools than land spills because they are unconfined [15, 16]. Modeling of spills onto water is much more difficult than for land spills because the phenomena are more complex and the experimental basis is more limited [17, 18]. Out of the tests on land, Montoir tests with a diameter of 35 m was the biggest in which a total of three LNG pool fire experiments over a wind speed range of 2.7–10.1 m/s were performed [19].The experiment measured the flame geometry, incident thermal radiation at various ground level positions, spot and average flame
surface emissivity, gas composition in pool, fuel mass burning rate, and flame emission spectra in both the visible and infra-red regions. In the Esso tests, LNG was allowed to form pools in irregularly shaped trenches into which LNG was transferred at a metered rate[19], and initiated a set of tests for modeling. These tests showed that LNG fires burned with the production of copious amount of smoke. These were hence helpful in studying the smoke generation characteristics of LNG Fires[20]. This concluded that the smoke obscured the inner parts of the fire, affecting its radiation characteristics.
The most prevalent practice in predicting pool sizes is to treat the fire as instantaneous or constant-rate, and to calculate the pool size using an empiricalevaporation or burn rate. The keys to this approach are to:
Use rigorous multi-component physical properties.
Use a time-varying analysis of spill and evaporation.
Use a material and energy balance approach. Estimate the heat transfer from water to LNG in
a way that reflects the turbulence
Table 3 Tests on Water
Sl no
Experiment Diameter of pool (effective)
Flame length (m)
L/D Ratio
Symmetry Burning
rate (kg/m2 s)
Average surface emissive power (kW/m2)
Fn of Combustion Energy radiated (%)
Regression rate (m/s)
1 China Lake 15 25-55
2.8-4.4
Cylindrical 0.18-0.495
210 ± 20 (narrow)220 ± 50(wide angle)
4 x 10⁻⁴– 11 x 10-4
2 Maplin sands 30 80 2.6 Cylindrical 0.0945 178-248
203 (avg)
2.1 x 10⁻⁴
The fire is basically modeled as the ejection of fuel from a liquid surface that burns when mixed with
3 2 2 2
3
2 2
CH OH O CO H O
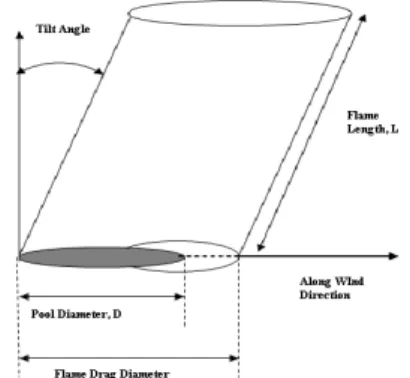
As suggested by Fay[3], for hydrocarbon fuel–air flames, whether laminar or turbulent, the ratio of mass flow rate of air to that of fuel needed to completely burn the fuel is in the range of 15–17. About 80% of the air mass or product mass is nitrogen, which does not enter into the combustion reactions, but acts as a diluent that carries most of the mass, momentum, and thermal energy fluxes in the flame. Or in other words, one can think of the diffusion flame as a nitrogen dominated flow in which the minor species of fuel and oxygen react to form carbon dioxide and water vapor, releasing thermal energy to the nitrogen. Of the species, the fuel mass flux is generally the smallest.As seen in Fig. 1, the pool fire could be assumed to be cylindrical and at an angle to the horizontal. This assumption have been derived from measurements of the visible part of the flame. The derivation of the expressions is done by splitting the visible part of the fire into different zones, depending on the supply of air and the type of combustion that is occurring in the zones. Some of the fuels are found to produce a significant amount of smoke and soot production which affects the burning rate and emissive power distribution[21], the flame length ‘L’ is found to have a direct relation to the diameter of the flame. Hence, for a pool fire, it is usually specified the flame length to diameter ratio, also called as the characteristic length, which has a dependence on the various aspects of the fire [3, 21]. For small scale fires (< 2 m) of hydrocarbon fuels, Moorhouse and Pritchard (1982)[2] correlation can be used and the basis of the flame length for the experiment was that the experiments conducted on LNG pools with the help of thermography imagery, and assumed that the flames could be either cylindrical or conical in shape. The proposed correlation is given as:
0.254 * 0.044
42(
)
( )
L
Fr
u
D
(1)0.2104 * 0.1144
42(
)
( )
L
Fr
u
D
(2)where
Fr
the Froude number, defined by,� = ��(��)
1 2
, a ratio of the inertial to buoyant forces
[2,34], which is found to be dependent on the fraction of fuel burned and the density of the fuel,
u
*is the flame characteristic velocity.Figure 1 Pool Fire Dynamics
For tilt angles of hydrocarbon fires, Moorhouse and Pritchard (1982) [2] observes the angle varied greatly based on the type of fuel that undergoes combustion and also the influence of wind on the flame. The tilt angle greatly influences the downwind radiation heat fluxes and may even lead to flame impingement [22, 23]. The predictions of flame tilt described are all for open air flames with constant wind speed, which in reality is variable and can change regularly in an offshore site. The correlation is given as
* 0.25
0.050 2 0.399
cos
0.86( )
tan
1.19
cos
a
a
u
Du
u
Dg
(3)
The correlations have been derived based on a balance between the buoyancy forces acting on the flame due to the density difference between the hot combustion gases and the ambient air and the inertia forces exerted by the wind on the flame to push it sideways [11]. The expression that was developed by Welker and Sliepcevich is found to have good agreement with large diameter LNG and LPG fires on land, but it fails to correlate for tilt of other fuel types, but the other correlations that are listed have good agreement with open pool fires of large diameters.
2.1 Surface Emissive power (SEP)
Emissive power is a key parameter in calculating the thermal radiation emitted by a fire. It can be defined as the power that is radiated per unit surface area. The value of the SEP depends on whether the fire is modeled using a one zone or two zone model which has been proposed in literature. The one zone solid flame model assumes that a certain fraction of combustion energy is radiated. It has also been found that SEP depends on the type of fuel used and also on the diameter of the pool fire[24, 25]. Using a one zone solid flame model, we see that
(1
k Dm)
where the constant �� depends on the mass burning rate of the fuel that is used. The above expression is valid only for light burning, non smoky flames which burn almost continuously. For heavy hydrocarbon fuels, a smoky flame correlation is often used, as given by Mudan and Croce [23]:
(1
)
sD sD
m s
E
E e
E
e
(5)
The above correlations tend to be used within models which assume a constant mean surface emissive power over the full flame surface.However, a model which uses multiple layers of surface emissive power will give more accurate predictions of near-field incident radiation, especially downwind of the flame where the single-layer model can under-predict incident heat fluxes at ground level. The use of a multi-layer model arises from observations of large smoke-producing hydrocarbon fires, where a distinct base layer to the flame, which is almost unobscured by smoke and is emitting radiation at the maximum level for the fuel, can be seen. Above this layer, smoke is released from the fire, thereby obscuring the flame surface from the field of view of the target and heat is radiated in `plumes’ [26].
The view factor or the configuration factor is a purely geometric quantity, which provides the fraction of the radiation leaving one surface that strikes another surface directly (Table 4). In other words, this factor gives the fraction of hemispherical surface area seen by one differential element when looking at another differential element on the hemisphere. The view factor or the configuration factor is a function of target location, flame size (height), and fire diameter, and is a value between 0 and 1. When the target is very close to the flame, the configuration factor approaches 1, since everything viewed by the target is the flame. The flame is idealized with a diameter equal to the pool diameter, D, and a height equal to the flame height, L. If the pool has a length-to-width ratio near 1, an equivalent area circular source can be used in determining the flame length, L, for non-circular pools.
Figure 2 Solid Flame Model
2.2Burning Rate
The burning rate is a critical parameter in pool fire modeling since it determines the amount of material which burns per unit area per unit time. A burning rate is a mass flux, which should be directly related to the total heat flux to the LNG pool. It includes the effects of several heat transfer mechanisms and many variables. A higher burning rate provides a higher thermal radiation result. The burning rate depends on the diameter of the pool and to a great extent on the type of fuel that is involved. The early models of heat transfer from flames are based on the 1959 review byHottel [27]and data include a number of fuels in pans with diameters rangingfrom 0.4 cm to 30 m and are presented in Figure 3.The heat fluxto the fuel was decomposed into conduction, convection, and radiation to give,
.
4 4
0 0 0
4
(T ) (T ) F(T )(1 eKad)
vap F F F
K
m h q T h T T
d
(6)
where
q
is the heat flux density,.
m
is thevaporizationrate of the fuel,
h
vapis the heat of vaporization of the fuel. The expression developed by Babrauskas [28] has been adopted for the determination of the mass burning rates in many of the literatures. It is given as
1 exp(
)
m
m
k d
(7)4
f g
T m
h
(8)
Table 4 View Factor
Model View Factor
Point Source Fp = 1
4 �2
Solid Flame ���
2→�1 =
cos�1cos�2
�2 ��1
�
Figure 3 Burning Correlation Hottel[27]
2.4 Burning Duration
When a spilled liquid is ignited, a pool fire develops. Provided that an ample supply of oxygen is available, the amount of surface area of the given liquid becomes the defining parameter. The diameter of the pool fire depends upon the release mode, release quantity (or rate), and burning rate. In some instances, the spill is not contained by curbs or dikes, allowing it to spread across the ground and establish a large exposed surface area. Liquid pool fires with a given amount of fuel can burn for long periods of time if they have a small surface area or for short periods of time over a large spill area. For a fixed mass or volume of flammable/combustible liquid, the burning duration (tb) for the pool fire is estimated using the following expression:
2
4
b
V t
D
(9)
where
V = Volume of liquid (m3) D = pool Diameter (m)
� = regression rate (m/sec) or liquid burning rate
III.
Experiment and Results
The computational domain has a dimensions of 18mx 15m x 13m with the 2-m diameter LNG pool approximated by a rectangular surface inthe simulation. The pool is located 5 m downstream and the wind profile is assumed steady (Fig 4). The velocity profile is parabolic with a peak velocity of 13 m/s. The ground is raised by 0.09 m and the poolsurface is located at 0.27 m in the simulations.In the experiment [14] in order to understand the detailed, local turbulent nature of the fire flow field, measurements of the instantaneous values of velocity and temperature to calculate power spectra, Reynolds stresses, turbulent heat flux terms, and other turbulence quantities such as Re, length scales, and
kinetic energy production and dissipation were made. Weckman [14]discusses that in the classical description of turbulence, the integral scales of turbulence are proportional to the characteristic scale of the structures which are responsible for the extraction of energy from the mean flow. Thecoupling between the velocity and temperature fields, and hence the role of momentum and buoyancy in determining the turbulence characteristics of the fire flow field, were investigated by examining point correlations between the time resolved velocity and temperature data, by the use of Reynolds stress and the turbulent heat fluxes. The magnitude of the maximum value of each correlation increases and the radial extent of the region of high values broadens with height above the fuel surface.
A reaction model is used to calculate the species concentrationsand temperatures. The chemistry is assumedto be very fast so that chemical time scales are much smaller thanany turbulence scales. The conserved mixture fraction model isused for the major species concentrations [29]. In this model, an ideal mechanismis used where the composition of the reaction components andsoot are calculated to obtain a linear relationship with mixturefraction. LNG is used here. The heat release is calculatedbased on the consumption of oxygen. Constant CO and sootyields are set equal to 0.012 and 0.042 respectively. Usinga direct relationship between mixture fraction and CO-soot concentrationis questionable given the finite-rate kinetics for COand soot formation. Nonetheless they are used for simplicity inthe first stages of this study.Radiation is included by solving the radiative transport equation.It is here assumed that soot is the most significant factor in radiativetransfer and that the gas behaves as a gray medium.The energy released in the above reaction between methanol and the entrained air heats up the methanol liquid pool. This raises the temperature of the liquid pool above the ignition temperature of the fuel and in turn the combustion process occurs. This continuous heating causes the methanol vapors to convect away from the fuel surface, and the liquid level in the pool regresses, resulting in a continuous stream of methanol to be vaporized. The energy transfer during the combustion process is mainly governed by radiation from the hot combustion gases to the pool surface. A turbulent mixing process occurs, bringing together air, unburnt fuel and hot combustion products. Conduction is present only in the region close to the vapor liquid interface, and transfers energy from the pool surface to layers beneath the fuel surface, hence causing better heat transfer and thereby introducing fresh fuel into the combustion zone. Convection is less predominant in the combustion process. It occurs only very near to the vapor liquid interface, or beneath the level of liquid fuel where a constant temperature is formed.
Initial runs showed that the flowfield and the temperature predictionswere sensitive to wind speed and direction.As observed in Fig. 7, mean temperaturethroughout the fire flow field compares well with the experiment. Trends inthe data agree very well with results reported. The maximum mean temperatureof 1330 K occurs near the centerline at 8 cmabove the fuel surface. Between 4 and 8 cmabove the fuel and at radial positions between6 and 16 cm from the centerline of the fire,mean temperatures remain less than 1200 K.Some instantaneous temperature values are ashigh as 2000 K in these regions however, whichsuggests that some gases are
burning at closeto the adiabatic flame temperature for Liquefied Natural Gas.
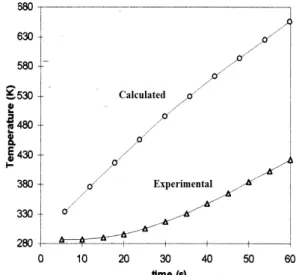
The temperature measurements as shown in Fig. 5indicates that the continuous flame zone of the methanol fire comprises a zone of combustion which spreads almost horizontally across the fuel surface from the pan rim towards the fire centerline, with flames in the continuous combustion zone. The flame fronts in the lowest regions of the fire undergo flapping motions due to the convection occurring due to the continuous mixing occurring between the flame surface and the air that is blowing. Hot eddies are formed at the edge near the base of the burner, which roll into the center of the fire with the air entrainment and rise upwards, continuing to evolve during the process. The calculated temperatures were over predicted (Fig. 4), which could be due to the lack of capacity of the turbulence model that was used. Different turbulence models were analyzed, and it was observed that the DO (Discrete ordinates) model gave the maximum accuracy in the computation.
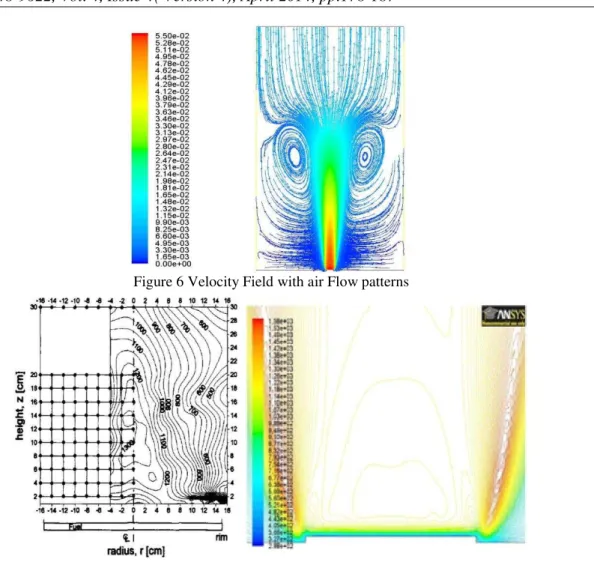
Figure 5Comparison of temperature inside the fire
Figure 6 Velocity Field with air Flow patterns
Figure 7 Temperature evolution (Experimental vs Simulation)
In the lowest regions, local flammable mixtures are formed near the rim of the pool and support flapping flame fronts which undergo a succession of instabilities, resulting in air entrainment. Peak entrainment occurs very near the base of the fire in regions around the small vapor core and before significant combustion reaches the fire centerline. As combustion reaches the centerline, the flow quickly develops into a pronounced fire neck composed of strongly accelerating gases. The air required to support continued combustion flows radially inward near the base of the fire, accelerates as it reaches the edges of the fire and is sucked upward into the buoyant column. Above the strongly entraining region, the inflow of air decreases and further air entrainment is largely by engulfment along the edges of the fire plume, although there is still an accelerating flow in the fire neck. In these regions, the inflow of air is presumably that required to sustain combustion of the fuel vapor remaining in the intermittent flame zone.Fig. 6 shows good symmetry in the velocity measurements,and indicates the overall developmentof the flow field. Relatively high rms values of bothradial and axial velocity occurnear
the edge of the fire. This is consistentwith the observed flapping motion of flamefronts which are anchored to the pool rim.In the lowest regions, local flammable mixtures are formed near the rim of the pool and support flapping flame fronts which undergo a succession of instabilities, resulting in air entrainment. They further report that peak entrainment occurs very near the base of the fire in regions around the small vapor core and before significant combustion reaches the fire centerline.
IV.
Conclusion
the fire.Weckman [14] reports that the emerging of the fire flow field is rather slow, with flow moving upwardly to the core of fuel vapor just above the liquid surface. The flow can be affected by the entrainment of the air at the far field causing constant mixing of the fuel with the surrounding air, causing inconsistencies in the reported values. Using different turbulence models can result in different values for the velocity, and the temperature during the simulation predicts closer to the experiment with the use of DO model for turbulence. The model has shown that once the turbulence has been determined, it is easy to find the temperature distribution on the surface. Although the temperatures obtained with the model are lower than the experimental values, the trend in the temperature distribution is very similar. The proposed model is a step forward in modeling of the behavior of equipment engulfed in fire.
References
[1] E. A. Suchman, A conceptual analysis of the accident problem, Social Problems, 8(3),1961,241.
[2] S. Mannan, Lee’s Loss Prevention in the Process Industries Hazard Identification, Assessment and Control (Elsevier, Butterworth-Heinemann, Oxford, 2005)
[3] J. Fay, Model of large pool fires, Journal of Hazardous Materials , B136, 2006, 219–232 [4] A. Hamins and T. Kashiwagi,Characteristics of
pool fire burning, in Proc. ASTM STP 1284, Philadelphia, PA., 1996.
[5] Major Hazard Incident Data Service (MHIDAS), Health and Safety Executive and the Safety and Reliability Directorate of the United Kingdom Atomic Energy Authority, Cheshire, UK..
[6] "www.factsonline.nl," [Online].
[7] "http://mahbsrv.jrc.it/Activities-WhatIsMars.html.," [Online].
[8] Z. Nivolianitou, M. Konstandinidou and C. Michalis, Statistical analysis of major accidents in petrochemical industry notified to the major accident reporting system (MARS),Journal of Hazardous Materials, A137, 2006, 1–7. [9] " http://www.hse.gov.uk," [Online].
[10] E. Planas-Cuchi, J. A. Vılchez and J. Casal, Fire and explosion hazards during filling/emptying of tanks, Journal of Loss Prevention in the Process Industries,12, 1999, 479–483,
[11] G. Heskestad, Dynamics of the fire plume,
Philosophical Transaction Society London, A356, 1998, 2815 – 2833,.
[12] W. G. Weng, D. Kamikawa, Y. Fukuda, Y. Hasemi and K. Kagiya, Study on flame height of merged flame from multiple fire sources, Combustion Science Technolgy,176 (12), 2004, 2105-2123.
[13] N. Liu, Q. Liu, J. S. Lozano, L. Shu, L. Zhang, J. Zhu, Z. Deng and K. Satoh, Global burning rate of square fire arrays: Experimental correlation and interpretation,Proc. Combustion Institute, 32, 2009, 2519–2526.
[14] E. J. Weckman and A. B. Strong, Experimental Investigation of the Turbulence Structure of Medium-Scale Methanol Pool Fires, Combustion Flame,105, 1996, 245-266. [15] J. Fay, Model of spills and fires from LNG and
oil tankers, Journal of Hazardous Materials, B96, 2003, 171–188.
[16] D. Hissong, Keys to modeling LNG spills on water,Journal of Hazardous Materials, 140 (3), 2007, 465 - 477.
[17] S. Brambilla and D. Manca, Accidents involving liquids: A step ahead in modeling pool spreading, evaporation and burning, Journal of Hazardous Materials,161(2-3), 2009, 1265 - 1280.
[18] W. J.L, Coupling dynamic blow down and pool evaporation model for LNG, Journal of Hazardous Materials, 14 (3),2007, 478-487. [19] A. Luketa-Hanlin, A review of large-scale LNG
spills: Experiments and modeling, Journal of Hazardous Materials, 132, 2010 119-140. [20] R. Phani K, LNG fires: A review of
experimental results, models and hazard prediction challenges, Journal of Hazardous Materials, 140, 2007, 444–464.
[21] P. K. Raj, Large hydrocarbon fuel pool fires: Physical characteristics and thermal emission variations with height, Journal of Hazardous Materials, 140, 2007, 280–292.
[22] D. M. Webber, A Model for Pool Spreading and Vaporization and its Implementation in the Computer Code, G*A*S*P, AEA Technology, SRD/HSE/R507, 1990.
Engineering, (Boston, MA., Society of fire Protection Engineers, 1995).
[24] K. B. McGrattan, H. R. Baum and H. A, Thermal Radiation from Large Pool Fires(NISTIR 6546. NIST, 2000)
[25] H. Anthony, C. Y. Jiann and K. Takashi, A Global Model for Predicting the Burning Rates of Liquid Pool Fires(Building and Fire Research Laboratory NISTIR 6381, 1999)
[26] K. Mudan, Thermal radiation hazards from hydrocarbon pool fires, Progress in Energy and Combustion Science, 10, 1984, 59.
[27] J. Spinti, J. Thornock, E. Eddings, P. Smith and A. Sarofim, Heat transfer to objects in pool fires, in Transport Phenomena in Fires, (Springer USA, 2008), 68.
[28] V. Babrauskas, Estimating Large Pool Fire Burning Rates, Fire Technology, 19, 1983, 251-261.
[29] N. Peters, Laminar Diffusion Flamelet Models in Non-Premixed Turbulent Combustion, Progress in Energy and Combustion Science, 10, 1984, 319–339.
[30] Z. Nivolianitou, M. Konstandinidou and C. Michalis, Statistical analysis of major accidents in petrochemical industry notified to the major accident reporting system (MARS), Journal of Hazardous Materials, A137, 2006, 1-7.
[31] C. B. Devaud and E. J. Weckman, "Numerical Simulation of a Pool fire and large object in a Cross wind," in ASME Heat Transfer/Fluids Engineering Summer Conference, USA, 2004. [32] Heskestad. G, Dynamics of the fire
![Table 1 Classification of fires [10]](https://thumb-eu.123doks.com/thumbv2/123dok_br/18160349.328705/2.892.108.789.826.1177/table-classification-of-fires.webp)

![Figure 3 Burning Correlation Hottel[27]](https://thumb-eu.123doks.com/thumbv2/123dok_br/18160349.328705/6.892.211.703.160.447/figure-burning-correlation-hottel.webp)