www.atmos-chem-phys.net/13/4839/2013/ doi:10.5194/acp-13-4839-2013
© Author(s) 2013. CC Attribution 3.0 License.
Atmospheric
Chemistry
and Physics
Geoscientiic
Geoscientiic
Geoscientiic
Geoscientiic
Evaluation of discrepancy between measured and
modelled oxidized mercury species
G. Kos1, A. Ryzhkov2, A. Dastoor3, J. Narayan4, A. Steffen4, P. A. Ariya5, and L. Zhang4
1McGill University, Atmospheric and Oceanic Sciences, 801 Sherbrooke Street West, Montreal, QC, H3A 2K6, Canada 2Independent Researcher, 4998 Maisonneuve West, Westmount, QC, H3Z 1N2, Canada
3Air Quality Research Division, Environment Canada, 2121 Transcanada Highway, Dorval, QC, H9P 1J3, Canada 4Air Quality Research Division, Environment Canada, 4905 Dufferin Street, Toronto ON M3H 5T4, Canada 5McGill University, Atmospheric and Oceanic Sciences and Chemistry, 805 Sherbrooke Street West, Montreal, QC, H3A 2K6, Canada
Correspondence to:A. Dastoor ([email protected])
Received: 29 May 2012 – Published in Atmos. Chem. Phys. Discuss.: 12 July 2012 Revised: 16 April 2013 – Accepted: 18 April 2013 – Published: 14 May 2013
Abstract. L. Zhang et al. (2012), in a recent report, com-pared model estimates with new observations of oxidized and particulate mercury species (Hg2+and Hgp) in the Great Lakes region and found that the sum of Hg2+and Hgp var-ied between a factor of 2 to 10 between measurements and model. They suggested too high emission inputs as Hg2+ and too fast oxidative conversion of Hg0to Hg2+ and Hgp as possible causes. This study quantitatively explores mea-surement uncertainties in detail. These include sampling ef-ficiency, composition of sample, interfering species and cal-ibration errors. Model (Global/Regional Atmospheric Heavy Metals Model – GRAHM) sensitivity experiments are used to examine the consistency between various Hg measure-ments and speciation of Hg near emission sources to bet-ter understand the discrepancies between modelled and mea-sured concentrations of Hg2+and Hgp. We find that the ratio of Hg0, Hg2+and Hgpin the emission inventories, measure-ments of surface air concentrations of oxidized Hg and mea-surements of wet deposition are currently inconsistent with each other in the vicinity of emission sources. Current specia-tion of Hg emissions suggests higher concentraspecia-tions of Hg2+ in air and in precipitation near emission sources; however, measured air concentrations of Hg2+and measured concen-trations of Hg in precipitation are not found to be signifi-cantly elevated near emission sources compared to the re-mote regions. The averaged unbiased root mean square er-ror (RMSE) between simulated and observed concentrations of Hg2+ is found to be reduced by 42 % and for Hgp
1 Introduction
Knowledge of the relationship between emission and deposi-tion of atmospheric mercury is critical for the development of policies to reduce the levels of mercury in the environment, but mercury chemistry, including its sources and sinks, is still not fully understood. While most mercury is present in the at-mosphere in elemental form (Hg0), other oxidized mercury species (mostly as Hg2+) contribute significantly to over-all processes due to their reactivity with other atmospheric species and constituents (Schroeder and Munthe, 1998). Both elemental and oxidized mercury species in gaseous and par-ticulate forms are emitted from anthropogenic sources into the atmosphere, while only gaseous elemental mercury (Hg0) originates from terrestrial and oceanic (biogenic) sources (Lindberg and Stratton, 1998). Gaseous oxidized mercury (Hg2+)is further produced from slow oxidation of elemen-tal mercury in gas and aqueous phases (Liu et al., 2010). Low solubility and a comparatively long atmospheric life-time of six months to one year results in global transport and slow deposition to the earth’s surface of Hg0(Schroeder and Munthe, 1998). Hg2+and particle-bound mercury (Hgp) species, on the other hand, are removed by precipitation and surface uptake (dry deposition) at a much faster rate (i.e. within one to two weeks), making these species regional pol-lutants. Due to their solubility and reactivity, oxidized and particulate species are subject of a considerable body of re-search despite significantly lower concentrations (ng m−3for Hg0 vs. pg m−3 levels for Hg2+/Hgp; e.g. see Engle et al., 2010; Huang et al., 2010; Yatavelli et al., 2006; Poissant et al., 2005; Liu et al., 2011).
Many of the factors determining concentration changes of mercury species in the atmosphere remain poorly explored or unknown. The ratios of the emissions of Hg0, Hg2+ and Hgp species at the anthropogenic sources and oxidation-reduction processes in the emission plume and atmosphere determine the speciation of Hg in the atmosphere (Seigneur et al., 2004). While atmospheric mercury reactions have been studied extensively, the impact of in-plume reactions on spe-ciation is less known. A modelling study suggests reduction of Hg2+ in the plume by SO2 (Lohmann et al., 2006), but there are very few and contradictory in-plume experimental studies that neither confirm nor deny the possibility of in-plume reduction with certainty (Edgerton et al., 2006; Landis et al., 2009; Kolker et al., 2010; Deeds et al., 2013). As a con-sequence observations for oxidized and particulate mercury are required to determine the actual ratio of mercury species that will subsequently undergo tropospheric reactions.
For Hgp, aerosol size distribution and composition are the major driver for processes involving particles, clusters and heterogeneous chemistry. Besides established aerosol re-search, the chemistry and properties of atmospheric ultrafine particles (UFPs,<100 nm, also called nanoaerosols) have received growing attention in recent years (Justino et al., 2011). While it represents a small mass fraction of
over-all aerosol, its surface area and number density are consid-erable, and, therefore, UFPs are involved in heterogeneous chemical reactions and the formation of cloud condensation nuclei. While aggregates of UFPs into clusters are greater in size, their properties are still distinct from aerosol particles of similar size, featuring a larger surface area for chemical reac-tions (Maynard and Aitken, 2007). A primary source of UFP is combustion, as hot exhaust gases mix with cooler air, and photochemically driven gas-to-particle formation processes. Detailed studies specific for mercury are not yet available to the authors’ knowledge.
Since the mercury deposition-characteristics highly de-pend on speciation, accurate determination of mercury frac-tions is key to the precise estimation of deposition near and away from the sources. An extensive network of mercury monitoring stations has been established in North America in recent years. The Mercury Deposition Network (MDN) monitors total mercury Hgtconcentrations from wet deposi-tion over a large part of the continental US supplemented by Canadian stations (Prestbo and Gay, 2009). Measurement re-sults agree reasonably well with model output data, typically within a factor of 2, because of a good correlation with pre-cipitation data and the fact that no mercury fraction analysis is performed (Ryaboshapko et al., 2007b). The MDN net-work has recently been supplemented by Atmospheric Mer-cury Network (AMNet) with the goal to provide fraction measurements to assess the impact of oxidized and particu-late mercury species (Fitzgerald, 1995). Operational param-eters and data management of AMNet are evolving with the goal of harmonizing protocols for better comparability (Stef-fen et al., 2012). AMNet has been providing oxidized and particulate mercury data in a structured fashion since 2009. Data analysis and model comparisons in this and previous studies rely mainly on AMNet data sets or pre-2009 data sets recorded at the same sites before the network was formally established.
The Tekran system is the most commonly employed anal-ysis system for the determination of Hg0, Hg2+ and Hgp for AMNet and Canadian measurement sites. It combines automatic unsupervised long-term measurements with high sensitivity and field-based analysis (NAD Program: Atmo-spheric Mercury Network Site Operations Manual Version 1.0, 2011). Selective sample collection regimes are used to collect Hg0, Hg2+ and Hgpfrom the atmosphere. Since the system is the work horse for atmospheric mercury detec-tion, its analytical performance has been well studied and a number of methodological uncertainties and limitations were identified (e.g. Swartzendruber et al., 2009; Slemr et al., 2009; Lyman et al., 2010). These include calibration non-linearity at low concentrations, and losses due to interfer-ence of oxidants and incomplete capture of Hg2+. We aim to present a cumulative estimate for these uncertainties to better understand the variability of measurements.
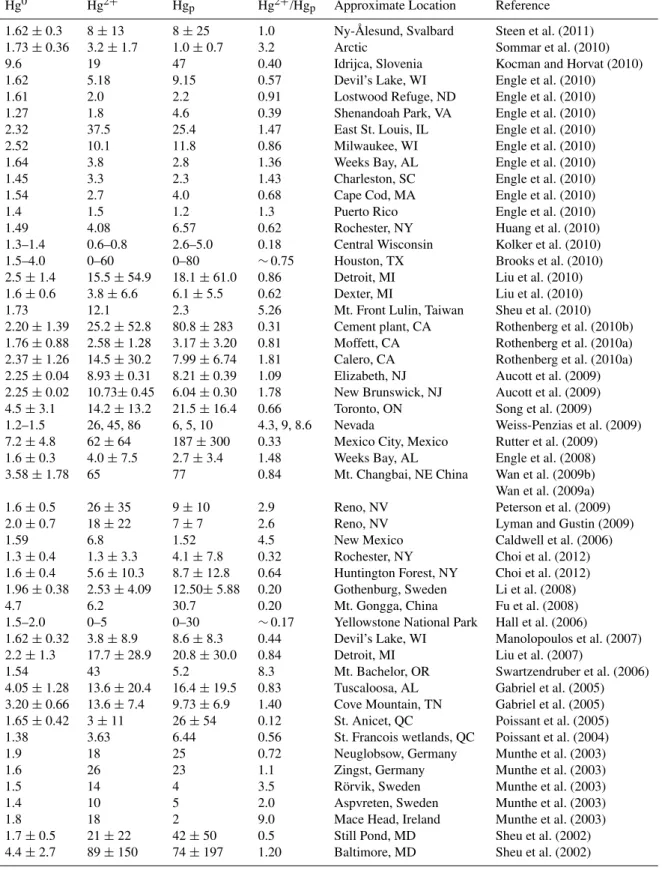
and Hgp concentrations are often close to the instrument method detection limit (MDL; Hg2+: 0.5–6.2 pg m−3, Hgp: 1.10–4 pg m−3; for details see Table 3). Both species concen-trations are found at similar orders of magnitude and make up less than 1 % of total atmospheric mercury. Studies aim to as-sess the regional impact associated with their short lifetimes (Weiss-Penzias et al., 2007). Observation data show consid-erable variation and concentration of up to 89±150 pg m−3
for Hg2+ in Baltimore, MD, and 80.8±283 pg m−3 near a
cement plant in the San Francisco Bay Area, CA (see Ta-ble 1). The average Hg2+/Hg
pratio from the data in Table 1 is 0.85±0.38 (mean±standard deviation of calculated ratio for all ratio data<3), illustrating the importance of particu-late mercury species in atmospheric processes.
Until now, it was not possible to perform a comprehen-sive evaluation of Hg2+ and Hgp species simulated by the Hg models, mostly because of a lack of a sufficient body of measurement data. Recently, AMNet results were used in a comparative study of model estimates (L. Zhang et al., 2012). In brief, outputs from three different atmospheric mercury models including Environment Canada’s mercury model GRAHM (Global/Regional Atmospheric Heavy Met-als Model) were compared to AMNet measurement results from 15 sites in the Great Lakes region. Model results of Hg2+and Hg
pat the 15 sites were overestimated by a factor of 2–10 for the sum of Hg2+and Hgp. Zhang et al. (2012) provide several hypotheses for this discrepancy: (1) too high emission inputs; (2) too fast oxidative conversion of Hg0to Hg2+ and Hgp; and (3) too low dry deposition velocities. While deposition velocities are discussed in some detail and not identified as the main source for the observed discrep-ancy, the authors suggest further investigation that led to the overestimation of the dry deposition results.
Currently, the modelling estimates of dry deposition ve-locities of mercury species are not constrained with observa-tions; therefore it is difficult to use the limited measurements of dry deposition fluxes of mercury to evaluate the ambient concentrations of oxidized mercury. Moreover, measured dry deposition estimates are considered highly uncertain. Com-paratively, ambient concentrations of Hg0and wet deposition fluxes of mercury have been extensively measured and are considered more reliable for constraining the models. There-fore, we make use of the measured wet deposition fluxes to constrain and evaluate the uncertainties in model-estimated ambient concentrations of oxidized mercury species in ad-dition to the recent measurements of the oxidized mercury concentrations.
The presented study strives to analyse reported discrep-ancies between observed Hg2+and Hgpconcentrations and explores the seeming disconnect with mercury wet deposi-tion by means of a detailed analysis of uncertainties for mea-surements, highlighting chemistry knowledge gaps and using model sensitivity experiments.
2 Materials and methods
2.1 Model description
GRAHM is an Eulerian model built on top of Environ-ment Canada’s Global EnvironEnviron-mental Multiscale-Global De-terministic Prediction System (Cˆot´e et al., 1998a, b). Mete-orological and mercury processes are fully integrated in the GRAHM online chemical transport model. Mercury species described are Hg0, Hg2+and Hg
p. At each time step, mer-cury emissions are added to the atmospheric model concen-trations, the meteorological processes are simulated, and the atmospheric mercury species are transported, transformed chemically and deposited. GRAHM has been seen to perform well in past studies (Ryaboshapko et al., 2007a, b; Dastoor et al., 2008; Durnford et al., 2010). Model sensitivity runs were conducted using the same configuration of GRAHM as used in the study by L. Zhang et al. (2012) to explore the main reasons for the discrepancy between modelled and measured oxidized mercury concentrations.
The gaseous oxidation of mercury by O3/OH, with a temperature-dependent rate constant for O3 oxidation fol-lowing Hall (1995) and forOH oxidation following Pal and
Ariya (2004) (and Sommar et al., 2001), occurs throughout the atmosphere. The gaseous oxidation of mercury by halo-gens, including atomic and molecular chlorine and bromine as well as bromine oxide, occurs in the Arctic and ma-rine boundary layer using reaction rate constants from Ariya et al. (2002), Raofie and Ariya (2003) and Donohoue et al. (2006). Mercury is reduced in the aqueous phase pho-tochemically and by the sulfite anion using rate constants from Xiao et al. (1995) and Van Loon et al. (2000). The reduction processes in GRAHM are insignificant, and their elimination in the model has no impact on the simulated Hg0 distribution or wet deposition. Holmes et al. (2010) noted that atmospheric reduction is not required to explain any of the major features of the global mercury cycle un-til better constraints on Hg0 oxidation rates are available. Dry deposition in GRAHM is based on the resistance ap-proach (Zhang, 2001; Zhang et al., 2003). In the wet depo-sition scheme, Hg0and Hg2+are partitioned between cloud droplets and air using a temperature-dependent Henry’s law constant. We use the global anthropogenic mercury emission fields produced by AMAP for 2005 (Pacyna et al., 2010). Non-anthropogenic terrestrial and oceanic emissions of Hg0 in the model are based on the global mercury budget of Ma-son (2009). Horizontal resolution of the model runs is 1◦×1◦ latitude/longitude and in the vertical model has 28 layers up to 10 hPa.
Table 1.Summary of literature data of Hg0, Hg2+and Hgpmeasurements published from 2002 to 2010. All concentrations in pg m−3. Uncertainties, where available, and significant figures are as reported by authors. Hg2+/Hgpratios were calculated from reported speciation data. “∼” indicates Hg2+/Hgpestimations based on concentration ranges reported by original authors.
Hg0 Hg2+ Hgp Hg2+/Hgp Approximate Location Reference
1.62±0.3 8±13 8±25 1.0 Ny- ˚Alesund, Svalbard Steen et al. (2011) 1.73±0.36 3.2±1.7 1.0±0.7 3.2 Arctic Sommar et al. (2010)
9.6 19 47 0.40 Idrijca, Slovenia Kocman and Horvat (2010)
1.62 5.18 9.15 0.57 Devil’s Lake, WI Engle et al. (2010)
1.61 2.0 2.2 0.91 Lostwood Refuge, ND Engle et al. (2010)
1.27 1.8 4.6 0.39 Shenandoah Park, VA Engle et al. (2010)
2.32 37.5 25.4 1.47 East St. Louis, IL Engle et al. (2010)
2.52 10.1 11.8 0.86 Milwaukee, WI Engle et al. (2010)
1.64 3.8 2.8 1.36 Weeks Bay, AL Engle et al. (2010)
1.45 3.3 2.3 1.43 Charleston, SC Engle et al. (2010)
1.54 2.7 4.0 0.68 Cape Cod, MA Engle et al. (2010)
1.4 1.5 1.2 1.3 Puerto Rico Engle et al. (2010)
1.49 4.08 6.57 0.62 Rochester, NY Huang et al. (2010)
1.3–1.4 0.6–0.8 2.6–5.0 0.18 Central Wisconsin Kolker et al. (2010)
1.5–4.0 0–60 0–80 ∼0.75 Houston, TX Brooks et al. (2010)
2.5±1.4 15.5±54.9 18.1±61.0 0.86 Detroit, MI Liu et al. (2010) 1.6±0.6 3.8±6.6 6.1±5.5 0.62 Dexter, MI Liu et al. (2010) 1.73 12.1 2.3 5.26 Mt. Front Lulin, Taiwan Sheu et al. (2010) 2.20±1.39 25.2±52.8 80.8±283 0.31 Cement plant, CA Rothenberg et al. (2010b) 1.76±0.88 2.58±1.28 3.17±3.20 0.81 Moffett, CA Rothenberg et al. (2010a) 2.37±1.26 14.5±30.2 7.99±6.74 1.81 Calero, CA Rothenberg et al. (2010a) 2.25±0.04 8.93±0.31 8.21±0.39 1.09 Elizabeth, NJ Aucott et al. (2009) 2.25±0.02 10.73±0.45 6.04±0.30 1.78 New Brunswick, NJ Aucott et al. (2009) 4.5±3.1 14.2±13.2 21.5±16.4 0.66 Toronto, ON Song et al. (2009) 1.2–1.5 26, 45, 86 6, 5, 10 4.3, 9, 8.6 Nevada Weiss-Penzias et al. (2009) 7.2±4.8 62±64 187±300 0.33 Mexico City, Mexico Rutter et al. (2009) 1.6±0.3 4.0±7.5 2.7±3.4 1.48 Weeks Bay, AL Engle et al. (2008) 3.58±1.78 65 77 0.84 Mt. Changbai, NE China Wan et al. (2009b) Wan et al. (2009a) 1.6±0.5 26±35 9±10 2.9 Reno, NV Peterson et al. (2009)
2.0±0.7 18±22 7±7 2.6 Reno, NV Lyman and Gustin (2009)
1.59 6.8 1.52 4.5 New Mexico Caldwell et al. (2006)
1.3±0.4 1.3±3.3 4.1±7.8 0.32 Rochester, NY Choi et al. (2012) 1.6±0.4 5.6±10.3 8.7±12.8 0.64 Huntington Forest, NY Choi et al. (2012) 1.96±0.38 2.53±4.09 12.50±5.88 0.20 Gothenburg, Sweden Li et al. (2008)
4.7 6.2 30.7 0.20 Mt. Gongga, China Fu et al. (2008)
1.5–2.0 0–5 0–30 ∼0.17 Yellowstone National Park Hall et al. (2006)
1.62±0.32 3.8±8.9 8.6±8.3 0.44 Devil’s Lake, WI Manolopoulos et al. (2007) 2.2±1.3 17.7±28.9 20.8±30.0 0.84 Detroit, MI Liu et al. (2007)
1.54 43 5.2 8.3 Mt. Bachelor, OR Swartzendruber et al. (2006)
4.05±1.28 13.6±20.4 16.4±19.5 0.83 Tuscaloosa, AL Gabriel et al. (2005) 3.20±0.66 13.6±7.4 9.73±6.9 1.40 Cove Mountain, TN Gabriel et al. (2005) 1.65±0.42 3±11 26±54 0.12 St. Anicet, QC Poissant et al. (2005) 1.38 3.63 6.44 0.56 St. Francois wetlands, QC Poissant et al. (2004)
1.9 18 25 0.72 Neuglobsow, Germany Munthe et al. (2003)
1.6 26 23 1.1 Zingst, Germany Munthe et al. (2003)
1.5 14 4 3.5 R¨orvik, Sweden Munthe et al. (2003)
1.4 10 5 2.0 Aspvreten, Sweden Munthe et al. (2003)
1.8 18 2 9.0 Mace Head, Ireland Munthe et al. (2003)
Table 2.Description of model runs and most important parameters that were used in this study. The “base” experiment corresponds to configuration used in L. Zhang et al. (2012).
Experiment Hg0: Hg2+: Hgp Oxidant Remarks
Base 50:40:10 O3; std rate Base run
NoEmit 100:0:0 O3; std rate No anthropogenic Hg2+and Hgpemissions
NoChem 50:40:10 No mercury chemistry
Ex-ox1.5-CFPP 90:5:5 O3; 1.5×rate Emission adjustment for coal-fired power plants (CFPPs) only Ex-ox1 90:8:2 O3; std rate Emission adjustment for all anthropogenic emissions Ex-ox2 90:8:2 O3; 2×rate Emission adjustment for all anthropogenic emissions Ex-ox2-HiHgp 90:8:2 O3; 2×rate Hg2+: Hgpratio 0.5:0.5=>0.25:0.75
Ex-oxOH 90:8:2 OH OH oxidation
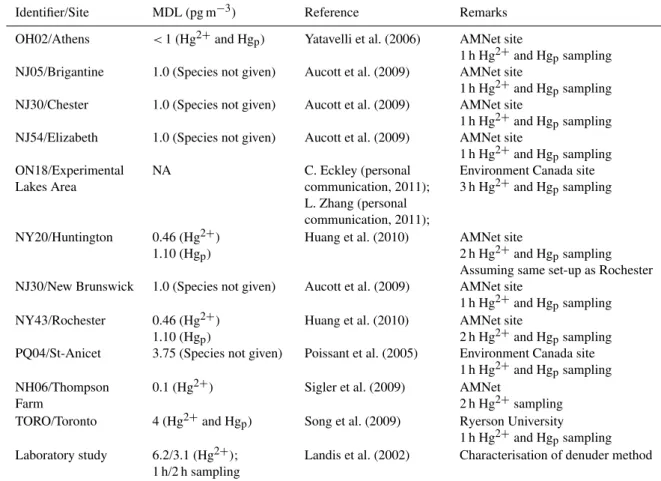
Table 3.Measurement details and limits of detection for Hg2+and Hgp(all CVAFS; Tekran 2537A/1130/1135) at selected stations used for comparison with model results in L. Zhang et al. (2012). Method performance data and parameters as cited. MDL: method detection limit.
Identifier/Site MDL (pg m−3) Reference Remarks
OH02/Athens <1 (Hg2+and Hgp) Yatavelli et al. (2006) AMNet site
1 h Hg2+and Hgpsampling NJ05/Brigantine 1.0 (Species not given) Aucott et al. (2009) AMNet site
1 h Hg2+and Hgpsampling NJ30/Chester 1.0 (Species not given) Aucott et al. (2009) AMNet site
1 h Hg2+and Hgpsampling NJ54/Elizabeth 1.0 (Species not given) Aucott et al. (2009) AMNet site
1 h Hg2+and Hgpsampling ON18/Experimental
Lakes Area
NA C. Eckley (personal
communication, 2011); L. Zhang (personal communication, 2011);
Environment Canada site 3 h Hg2+and Hgpsampling
NY20/Huntington 0.46 (Hg2+) 1.10 (Hgp)
Huang et al. (2010) AMNet site
2 h Hg2+and Hgpsampling Assuming same set-up as Rochester NJ30/New Brunswick 1.0 (Species not given) Aucott et al. (2009) AMNet site
1 h Hg2+and Hgpsampling NY43/Rochester 0.46 (Hg2+)
1.10 (Hgp)
Huang et al. (2010) AMNet site
2 h Hg2+and Hgpsampling PQ04/St-Anicet 3.75 (Species not given) Poissant et al. (2005) Environment Canada site
1 h Hg2+and Hgpsampling NH06/Thompson
Farm
0.1 (Hg2+) Sigler et al. (2009) AMNet
2 h Hg2+sampling TORO/Toronto 4 (Hg2+and Hgp) Song et al. (2009) Ryerson University
1 h Hg2+and Hgpsampling Laboratory study 6.2/3.1 (Hg2+);
1 h/2 h sampling
Landis et al. (2002) Characterisation of denuder method
Tossell (2003), Shepler and Peterson (2003) and Goodsite et al. (2004) concluded that Hg0+O
3and Hg0+OH reactions should not be significant in the atmosphere since HgOH+, a possible intermediate of the reaction Hg0+OH, is likely to dissociate based on the binding energy, and the production of HgO(g), as a product of these reactions, is highly
endother-mic. However, in a more recent theoretical work, Cremer et al. (2008) found the reaction energy of Hg0+OH to be com-parable to the reaction energy for Hg0+Br, and concluded
that the reaction Hg0+OH is possible in the atmosphere. Use of much larger reaction chamber and low reactant con-centrations in more recent studies of Hg0+O3reaction sug-gests that the rate constants obtained previously are viable in the atmosphere and are free of surface effects (Snider et al., 2008; Sumner et al., 2005). Tossell (2006) suggest that stable oligomers of Hg oxide, HgOn, can subsist in the atmosphere.
atmospheric aerosols and recommend the inclusion of this re-action in the models. Calvert and Lindberg (2005) and Subir et al. (2012) suggest that Hg0oxidation by O3and OH may be occurring in the atmosphere through complex reaction mechanism possibly involving surfaces. Subir et al. (2012) suggest that, given the abundance of O3and OH radicals in the atmosphere, the Hg0oxidation with O3and OH should not be eliminated from Hg models.
Hg0+Br reaction is generally accepted as an important
oxidation pathway in the atmosphere in the polar regions and marine boundary layer; however, very little data exists with respect to its mechanism in the global atmosphere (Dibble et al., 2012). Holmes (2012) investigated Br vs. O3/OH mech-anisms as main oxidants of Hg0 in the atmospheric mod-els based on observational constraints and concluded that both Br and OH/O3oxidation mechanisms are capable of re-producing the distribution of Hg at northern mid-latitudes; however some of the observed features of atmospheric Hg were better described by O3/OH oxidation mechanism while others were better described by Br oxidation mechanism. Holmes (2012) suggested that both oxidation mechanisms, and possibly others, may be present together in the atmo-sphere. Since Hg0 oxidation by Br is well demonstrated in the Marine Boundary Layer (MBL) and the polar regions, currently GRAHM uses this oxidation pathway only in these environments.
Only a limited number of reduction pathways for Hg in the aqueous phase have been identified. Recently, Si and Ariya (2008) studied reduction of Hg2+ by dicarboxylic acids (C2–C4)in aqueous phase. Although they proposed a tentative reaction mechanism, sufficient details are unavail-able for its implementation in the model. Moreover, they found that presence of chloride ion and dissolved oxygen significantly inhibited the reduction reaction; therefore this reduction pathway may not be significant in atmosphere. Hynes et al. (2009) concluded that the atmospheric impor-tance of Hg reduction processes has not been established for any of the suggested reductants for Hg2+ so far; so the role of Hg2+reduction in the global atmosphere remains conjec-tural. Determined reaction rate constants for the oxidation of Hg0 by O3, OH and Br in the atmosphere suggest signifi-cantly shorter lifetime of Hg0in the atmosphere compared to the∼1 yr lifetime suggested by the observations. This im-plies that important unknown reduction processes are occur-ring in the atmosphere. Possible reduction of oxidized mer-cury on surfaces of atmospheric aerosols, ice and snow, etc. could be important but has not been studied so far.
2.2 Sampling, measurement and data analysis of oxidized mercury species
While several methods for the measurement of mercury species in the atmosphere have been developed (Munthe et al., 2001), the most popular methodology for field-deployed systems and continuous monitoring is the detection
of mercury species using cold vapour atomic fluorescence spectrometry (CVAFS) (Bloom and Fitzgerald, 1988). The widely employed Tekran 2537A analyzer system quantifies mercury species as Hg0 after amalgamation and concentra-tion on a gold surface followed by thermal desorpconcentra-tion into the CVAFS analysis system.
Mercury fractionation, commonly called “speciation”, al-though the “species” definition for Tekran measurements is strictly operational, is achieved using two different inline sampling protocols, for Hg2+ and Hg
p species. KCl-coated annular denuders made of quartz are most commonly used for Hg2+ at air sample flow rates of 10 L min−1 leading to the collection of species on the modified denuder surface, followed by thermal desorption and detection. Hgp is de-posited on a quartz filter surface followed by pyrolysis and detection (Lindberg et al., 2002). A combination set-up was commercialized by Tekran as systems 1130 (Hg2+)and 1135 (Hgp)speciation units, which are now used for Hg concen-tration monitoring. Samples are sequentially desorbed from the collection device and analysed as Hg0after reduction us-ing CVAFS. Table 3 lists samplus-ing times for Hg2+and Hgp, which are comparatively long (hours vs. typically 5 min for Hg0)due to the low concentrations observed (Landis et al., 2002). The table also illustrates the large variability of sam-pling times and resulting differences in the method detection limit (MDL), which is difficult to estimate due to lack of stan-dards for Hg2+and Hgp. The MDL is certainly dependent on sampling time and the quantity of material collected for anal-ysis and varies between 1.0 and 4.0 pg m−3. The MDL is not always specified separately for Hg2+and Hgp, and the mode of calculation is rarely reported. A better documented ratio-nale for Hg2+ and Hgp MDLs is desirable since observed concentrations are often, if not mostly, below or around the MDL for both species and actively being addressed (Steffen et al., 2012).
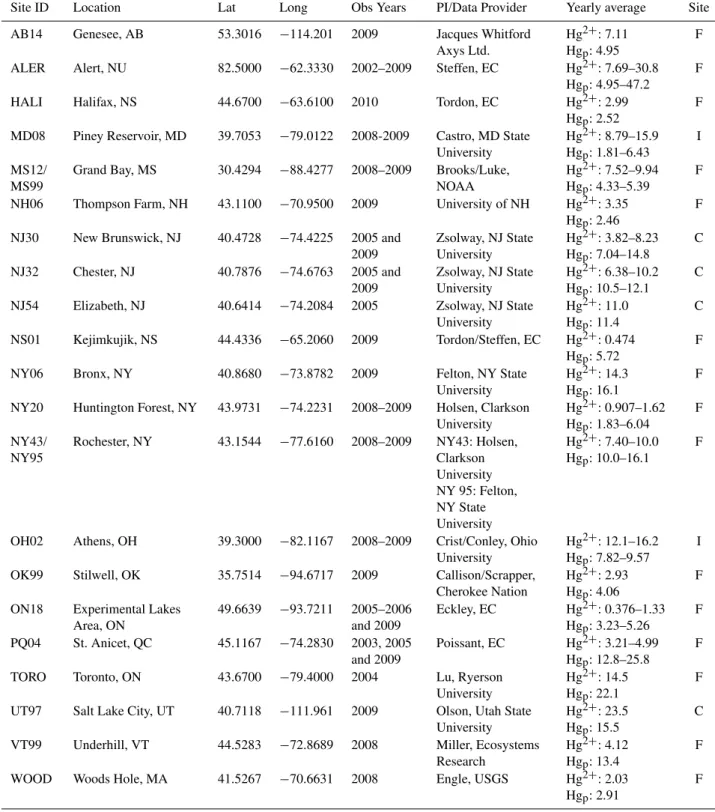
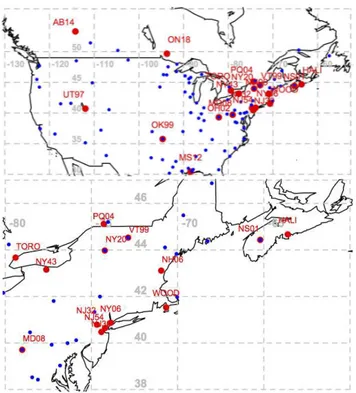
Measurement data and the range for yearly means used for analysis in this study are listed in Table 4 and represent an expanded data set including but not limited to sites from Table 3 in order to allow for a comparison on a continental scale and maintain comparability with results from L. Zhang et al. (2012). Data from 21 sites were analysed with 2 co-located instruments for a total of 41 yearly data sets from 2002 to 2010. A minimum of 7 (seven) months of observa-tions per year was required for a data set to qualify for con-sideration. Co-located data were treated as coming from a single location, i.e. for MS12 and NY43, respectively (also shown in Fig. 1).
Table 4.Observation sites for data used in this study. Two site identifiers at the same location indicate co-located instrument data. Yearly means (pg m−3)for multiple years are similar. Sites were classified as C=close (60–90 pg m−3), and I=intermediate proximity to sources (30–60 pg m−3)and F=far from sources (0–30 pg m−3)according to model calculation results plotted in Fig. 5. PI and data providers as of October 2010.
Site ID Location Lat Long Obs Years PI/Data Provider Yearly average Site
AB14 Genesee, AB 53.3016 −114.201 2009 Jacques Whitford Axys Ltd.
Hg2+: 7.11 Hgp: 4.95
F
ALER Alert, NU 82.5000 −62.3330 2002–2009 Steffen, EC Hg2+: 7.69–30.8 Hgp: 4.95–47.2
F
HALI Halifax, NS 44.6700 −63.6100 2010 Tordon, EC Hg2+: 2.99 Hgp: 2.52
F
MD08 Piney Reservoir, MD 39.7053 −79.0122 2008-2009 Castro, MD State University
Hg2+: 8.79–15.9 Hgp: 1.81–6.43
I
MS12/ MS99
Grand Bay, MS 30.4294 −88.4277 2008–2009 Brooks/Luke, NOAA
Hg2+: 7.52–9.94 Hgp: 4.33–5.39
F
NH06 Thompson Farm, NH 43.1100 −70.9500 2009 University of NH Hg2+: 3.35 Hgp: 2.46
F
NJ30 New Brunswick, NJ 40.4728 −74.4225 2005 and 2009
Zsolway, NJ State University
Hg2+: 3.82–8.23 Hgp: 7.04–14.8
C
NJ32 Chester, NJ 40.7876 −74.6763 2005 and 2009
Zsolway, NJ State University
Hg2+: 6.38–10.2 Hgp: 10.5–12.1
C
NJ54 Elizabeth, NJ 40.6414 −74.2084 2005 Zsolway, NJ State University
Hg2+: 11.0 Hgp: 11.4
C
NS01 Kejimkujik, NS 44.4336 −65.2060 2009 Tordon/Steffen, EC Hg2+: 0.474 Hgp: 5.72
F
NY06 Bronx, NY 40.8680 −73.8782 2009 Felton, NY State University
Hg2+: 14.3 Hgp: 16.1
F
NY20 Huntington Forest, NY 43.9731 −74.2231 2008–2009 Holsen, Clarkson University
Hg2+: 0.907–1.62 Hgp: 1.83–6.04
F
NY43/ NY95
Rochester, NY 43.1544 −77.6160 2008–2009 NY43: Holsen, Clarkson University NY 95: Felton, NY State University
Hg2+: 7.40–10.0 Hgp: 10.0–16.1
F
OH02 Athens, OH 39.3000 −82.1167 2008–2009 Crist/Conley, Ohio University
Hg2+: 12.1–16.2 Hgp: 7.82–9.57
I
OK99 Stilwell, OK 35.7514 −94.6717 2009 Callison/Scrapper, Cherokee Nation
Hg2+: 2.93 Hgp: 4.06
F
ON18 Experimental Lakes Area, ON
49.6639 −93.7211 2005–2006 and 2009
Eckley, EC Hg2+: 0.376–1.33 Hgp: 3.23–5.26
F
PQ04 St. Anicet, QC 45.1167 −74.2830 2003, 2005 and 2009
Poissant, EC Hg2+: 3.21–4.99 Hgp: 12.8–25.8
F
TORO Toronto, ON 43.6700 −79.4000 2004 Lu, Ryerson University
Hg2+: 14.5 Hgp: 22.1
F
UT97 Salt Lake City, UT 40.7118 −111.961 2009 Olson, Utah State University
Hg2+: 23.5 Hgp: 15.5
C
VT99 Underhill, VT 44.5283 −72.8689 2008 Miller, Ecosystems Research
Hg2+: 4.12 Hgp: 13.4
F
WOOD Woods Hole, MA 41.5267 −70.6631 2008 Engle, USGS Hg2+: 2.03 Hgp: 2.91
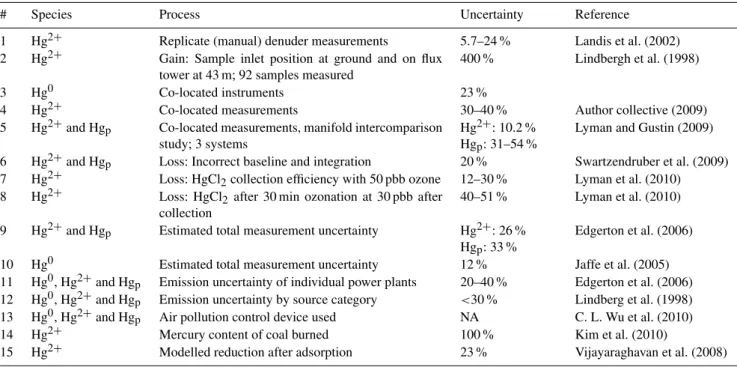
Fig. 1. (a)Location of measurement sites evaluated: oxidized mer-cury (red) and wet deposition (blue). (b) Zoomed insert shows northeastern sampling and evaluation sites resolved. Sampling sta-tion at Alert, NU, at the northern tip of Ellesmere Island not shown.
calculations; zero data as a result of blank correction were kept as is. Negative data as a result of blank correction were replaced by zero. Kaplan–Meier (KM) methods were em-ployed for all calculations to avoid the introduction of a bias by arbitrarily assigning zero or 0.5 MDL to data below the re-porting limit (Helsel, 2005). KM daily, weekly and monthly means were compared to corresponding arithmetic means from model estimates (not shown). For sets with the vast ma-jority of data points above the MDL (>90 %, e.g. for Hg0), no significant difference was observed between KM and nor-mally averaged data. For Hg2+and Hgpdata, however, up to 80 % was<MDL resulting in differences for mean val-ues of up to 16 % comparing KM and normally averaged data sets. Statistical calculations and analyses were carried out employing R (version 2.14), a programming language for statistical computing and graphics.
3 Results and discussion
3.1 Uncertainty of CVAFS measurements
Atmospheric mercury measurement data from 15 sites around the Great Lakes region and the eastern United States were used by L. Zhang et al. (2012) for comparison with model estimates. These data and the additional data used in this study were collected as part of AMNet and
Environ-ment Canada sampling and measureEnviron-ment stations and were in reasonable agreement regarding instrumentation and op-erating parameters (see Table 3 for remarks; Hg2+ and Hgp sampling times show some notable differences). Most im-portantly, all experiments were carried out using the same type of instrumentation, thus eliminating uncertainties aris-ing from different measurement principles, includaris-ing species measured. Nevertheless, the employed sample collection and analyte detection method leads to significant uncertainties as-sociated with the data, which will be discussed with a focus on Hg2+and Hg
p, where due to low observed concentrations near the MDL the impact is most significant (Sigler et al., 2009).
The immediate sampling environment including inlet po-sition of CVAFS sampling devices has a pronounced influ-ence on Hg2+ concentrations. Forested areas tend to scrub Hg2+concentrations in its surroundings leading to underesti-mation, when applying these concentrations to estimate con-centrations above the canopy. Hence, results might not be representative for regional and larger scale predictions and, therefore, less suited for comparison (E. Prestbo, personal communication, 2011). The change of Hg2+concentrations with altitude has not yet been studied in detail, and the effect of the immediate sampling environment on the Hg2+ con-centration gradient from above to below the canopy is un-known. There are some indications that concentrations are higher with increasing altitude, but a statistical analysis has not been performed for lack of data. Concentration differ-ences for Hg2+measured with refluxing mist chambers were a factor of 4 apart (Lindberg and Stratton, 1998). Because of these local sub-grid effects, it can be assumed that some ob-servations do not correspond to surface layer concentrations estimated by models.
3.1.1 Hg2+sampled as Hg0
Hg0concentrations are often measured with a Tekran 2537A unit without the speciation units (e.g. EC CAMNet). Higher concentrations were observed for Hg0data from stand-alone systems compared to combination systems with denuder and quartz filter set-ups. At Alert, NU, Hg0 data are available from both systems and significant differences are observed. It is unclear if co-sampled Hg2+ is the reason, since pre-cautions (e.g. long sample lines) are taken to avoid cross-contamination. For Hg0 differences were calculated to be 18 % with a yearly average of 1.5 ng m−3 for the stand-alone instrument vs. 1.3 ng m−3for the combination system in 2005. For now, CAMNet reports data from stand-alone in-struments for Hg0 at Alert and supplements Hg2+and Hgp data from a combination system.
concentration will be closer to total gaseous mercury, the sum of Hg0and Hg2+. While the combination systems eliminate this drawback by sampling Hg2+and Hgpright after the in-let, care has to be taken when comparing data coming from different sources and systems to account for operational dif-ferences.
3.1.2 Hg2+sampling uncertainties
Since the true composition of Hg2+ is unknown, a detailed assessment of quantitative sampling of Hg2+ is impossible (Selin, 2009). Major species that are assumed to be part of Hg2+ are HgCl2, HgBr2and HgO (Munthe et al., 2001; Aspmo et al., 2005; Lyman et al., 2010), and Hg2+is (oper-ationally) defined as water-soluble oxidized mercury species (Landis et al., 2002) that can be reduced by stannous chlo-ride in aqueous solutions without pretreatment (Munthe et al., 2001). Reactive gaseous mercury (RGM) is a commonly used alternative term for these species. Other candidate com-pounds suggested for the Hg2+ component pool are cross halogen species with chlorine, bromine and iodine atoms. Their contribution to the overall Hg2+ concentration is un-known, and no literature data exist.
HgCl2is commonly employed as a surrogate standard for Hg2+to evaluate method performance, since it is a thermo-dynamically favoured product of fossil fuel and waste com-bustion facilities (Landis et al., 2002, citing Klockow et al., 1990). The full composition of the Hg2+ fraction captured by the annular denuder set-up is not known (Lindberg et al., 2007; Landis et al., 2002); it has been reported that species with diffusion coefficients>0.1 cm2s−1are typically mea-sured (Poissant et al., 2005). No further quantitative data are available, making a quantitative error analysis not feasible.
Recently, the impact of the presence of ozone on Hg2+ sampling using the denuder technique was investigated (Ly-man et al., 2010). Significant loss of oxidized mercury (HgCl2, HgBr2)as elemental mercury was observed in lab-oratory experiments (39–55 % loss) and at a field site (3– 37 %). Precision of replicate denuder measurements was de-termined to be around 30 %. Additionally collection effi-ciency of denuders for HgCl2 decreased by 12–30 % in the presence of ozone. Hence, any Hg2+will subsequently be de-tected as Hg0employing the combination set-up with the de-nuder sampling device placed upstream of the Hg0detection unit. Further investigation of ozone and other potential inter-fering oxidizing species such as peroxides is recommended.
3.1.3 Hgpsampling and aerosol size distribution
For Hgpsampling a quartz filter with an upper size cut-off at 2.5 µm is employed (Landis et al., 2002). This raises issues with both ultrafine (UFP) and large particle fractions of the total aerosol distribution. For particles>2.5 µm, Keeler et al. (1995) showed bimodal distribution with a second max-imum at 3.8 µm for some samples indicating that a
signif-icant portion of mercury species from larger aerosol frac-tions are potentially not collected and reported as Hgp. The lower size cut-off is less clearly defined. Mercury adhering to UFP shows gas-like behaviour despite its particulate charac-ter thus potentially misclassifying Hgpas Hg0and Hg2+. The distinct character of UFP and its clusters apart from classic aerosol has been recognized as has its potential for hetero-geneous chemistry reactions due to the large surface area. Mercury has not been determined in UFP, and the degree of underestimation by current sampling methodologies is not known.
Furthermore, for 1 h sampling durations elevated tem-peratures in the filter assembly (typically 50◦C to exclude moisture) have been shown to lead to identification of Hgp as Hg2+ (Rutter and Schauer, 2007a). Prolonged collection times of up to 12 h as they often occur to reach the filter loadings necessary for detection led to filter losses for Hgp (Malcolm and Keeler, 2007). Collection times for the dis-cussed studies were typically lower (1–3 h; see Table 3), thus minimising the risk for filter losses.
3.1.4 Operational uncertainties
While AMNet has made considerable progress towards har-monisation of instrument operation, earlier data were not necessarily acquired in a fully standardised fashion. Differ-ent operating parameters might compromise comparability of data. These issues are being dealt with by an AMNet stan-dard operating procedure (Steffen et al., 2012).
Among the issues to be addressed is the 2-point calibra-tion at 0 and 15 ng sm−3 that the Tekran system uses, and for low concentrations problems with linearity of the cali-bration curve were previously reported (Swartzendruber et al., 2009). Since low concentrations (in the pg m−3 range) are typically observed for Hg2+and Hgp, a thorough assess-ment of linearity is especially important for these species. Hg0 measurement uncertainty was reported to be 12–20 % (2σ ), which has direct implications for Hg2+and Hgp, since these species are ultimately detected as Hg0(Aspmo et al., 2005; Temme et al., 2007 and Brown et al., 2008).
A good assessment of the method detection limit (MDL) is imperative for the same reasons. Sampling for Hg2+and Hgp typically takes 1–3 h followed by 1 h of desorption and anal-ysis (sum equals “cycle time”). Landis et al. (2002) found MDLs of 6.2 pg m−3and 3.1 pg m−3for Hg2+for sampling durations of 1 h and 2 h at 10 L min−1sample flow rate.
better but not objective means for what data could be trusted (C. Eckley, personal communication, 2011). Separate MDLs for Hgpare rarely specified. Depending on the MDL used for statistical calculations, a significant fraction (up to 40–80 %) of Hg2+and Hgpdata fall below the MDL with implications for interpretation and statistical procedures used (Engle et al., 2010). The uncertainty in establishing a suitable MDL to-gether with data near the MDL highlights the challenges that a reliable determination of Hg2+and Hgpface.
The precision of the denuder method was determined by the collection of co-located samples (n=63) to be 15.0±9.3 % (Landis et al., 2002). Precision for automated 1130/1135 methods is, according to Poissant et al. (2005), unknown and usually not listed.
3.2 Statistical treatment of observational data
With a large number of observations and observed concen-trations at the MDL, a suitable treatment of data has to be employed to account for non-detect data. In the current litera-ture environmental data are either used as-is or undergo some form of treatment, e.g. substitution with a fraction of the MDL, typically one-half, for values<MDL (Helsel, 2005). A considerable loss of information is the consequence, to-gether with the potential introduction of a biased estimate and as a result fabricated data. In conjunction with the MDL used as a criterion for censoring data, significant differences and reliability of results can occur. For example raw data from Poissant et al. (2005) at St-Anicet, QC, have a reported MDL of 3.75 pg m−3. Due to its more rural location, a much smaller number of data points is>MDL (22.2 %). Median and mean values are different for Kaplan–Meier treated data censoring at the MDL compared to classical statistics calcu-lating the arithmetic mean and median: the median changes from 1.3 with classical treatment to 0.82 pg m−3for Kaplan– Meier treated data. The change of the mean is smaller from 3.3 to 3.2 pg m−3. Concluding, a standardised procedure of data treatment has to be agreed upon that treats non-detects in a suitable fashion and takes into account instrument-specific MDLs. Methods such as robust statistics, Kaplan–Meier esti-mates and maximum likelihood estimation (MLE) are much more suitable for the treatment of censored environmental data (Helsel, 1990), especially for Hg2+ and Hgp concen-trations, which are often found to be below the detection limit (Engle et al., 2010). Table 5 describes uncertainties for CVAFS measurements together with other sources of uncer-tainty related to emissions and atmospheric chemistry pro-cesses. Regarding measurements, individual parameter as-sessments (e.g. for accuracy and precision of the denuder sampler) are typically not available because of a lack of stan-dards (Aspmo et al., 2005), but some estimates exist regard-ing the cumulative uncertainty of Hg2+ and Hg
p measure-ments.
3.3 Emission uncertainties
Current emission inventories prescribe a fixed Hg0: Hg2+: Hgp emission ratio for any coal-fired power plant (CFPP), currently 50 % : 40 % : 10 % (Pacyna et al., 2010). Stack data, however, indicate a large variability of the mercury species ratios between CFPPs, depending on multiple parameters such as air pollution control devices (APCD) used and the mercury content of coal burned at a given time (Hsi et al., 2010). Such variations are not accounted for in inventories.
Measurements of mercury species at observation sites near CFPPs revealed that there was indeed a large variability in, for example, Hg2+ emissions ranging from 5 to 35 % dur-ing different plume events at a sampldur-ing site with three CF-PPs within a <60 mile radius and 4 to 29 % for a sam-pling site with a single CFPP within 15 miles (Edgerton et al., 2006). Quite variable data on mercury species’ contribu-tions to flue gas composition were also recently published for South Korea showing differences between bituminous coal (Hg2+: 0.73 µg m−3 after treatment) and anthracite (Hg2+: 1.41 µg m−3)for CFPPs and treatment of flue gas using wet or dry APCD. Dry APCDs were reported to lead to higher Hg2+concentrations, whereas wet treatment yielded less ox-idized effluent gas (Kim et al., 2010). Incinerating facilities with Hg2+concentrations in the flue gas after treatment were up to 190 µg m−3for industrial waste incinerators. Wang et al. (2010) also reported significant variability of Hg2+ con-centrations from different CFPP after flue gas treatment (0.13 to 24 µg m−3). Analysis of coal composition is also provided including correlation of Hg2+ with halogen content of the coal confirming previous studies that reported increased con-version to Hg2+ at high halogen content (e.g. Niksa et al., 2009). A summary of Hg2+ concentrations ranging from 2–76 % in coal with 37 to 510 µg kg−1 total Hg including work by the authors also provides information on coal used and APCDs in place (Shah et al., 2010). Additionally mod-elled emission estimations for Chinese provinces by Y. Wu et al. (2010) indicated a high uncertainty for Hg2+of up to a factor of 3.
3.4 Uncertainties associated with chemistry knowledge gap
CFPPs are considered the major source of anthropogenic mercury emissions due to the natural occurrence of cury in coal at trace levels (Wang et al., 2010). Emitted mer-cury then undergoes reactions with a multitude of chemi-cal species (Shah et al., 2010). Edgerton et al. (2006) and Weiss-Penzias et al. (2011) found that, at ground-based sites 7–15 km downwind of CFPPs, the fraction of oxidized mer-cury in total mermer-cury concentrations was lower by a factor of ∼3–5 than the fraction of oxidized mercury measured
Table 5.Quantitative uncertainty data for sampling, measurement (Tekran 2537A/1130/1135), emission and atmospheric chemistry-related parameters. Data are presented as calculated by the original authors. Summary discussed in Sect. 3.5.
# Species Process Uncertainty Reference
1 Hg2+ Replicate (manual) denuder measurements 5.7–24 % Landis et al. (2002) 2 Hg2+ Gain: Sample inlet position at ground and on flux
tower at 43 m; 92 samples measured
400 % Lindbergh et al. (1998)
3 Hg0 Co-located instruments 23 %
4 Hg2+ Co-located measurements 30–40 % Author collective (2009)
5 Hg2+and Hgp Co-located measurements, manifold intercomparison study; 3 systems
Hg2+: 10.2 % Hgp: 31–54 %
Lyman and Gustin (2009)
6 Hg2+and Hgp Loss: Incorrect baseline and integration 20 % Swartzendruber et al. (2009) 7 Hg2+ Loss: HgCl2collection efficiency with 50 pbb ozone 12–30 % Lyman et al. (2010) 8 Hg2+ Loss: HgCl2after 30 min ozonation at 30 pbb after
collection
40–51 % Lyman et al. (2010)
9 Hg2+and Hgp Estimated total measurement uncertainty Hg2+: 26 % Hgp: 33 %
Edgerton et al. (2006)
10 Hg0 Estimated total measurement uncertainty 12 % Jaffe et al. (2005) 11 Hg0, Hg2+and Hgp Emission uncertainty of individual power plants 20–40 % Edgerton et al. (2006) 12 Hg0, Hg2+and Hgp Emission uncertainty by source category <30 % Lindberg et al. (1998) 13 Hg0, Hg2+and Hgp Air pollution control device used NA C. L. Wu et al. (2010)
14 Hg2+ Mercury content of coal burned 100 % Kim et al. (2010)
15 Hg2+ Modelled reduction after adsorption 23 % Vijayaraghavan et al. (2008)
causes. In an in-plume measurement study, ter Schure et al. (2011) concluded that significant reduction of Hg2+ oc-curs in CFPP plumes. Observations from a CFPP at Nan-ticoke, ON, showed a discrepancy between stack and in-plume Hg2+concentrations; the Hg0: Hg2+: Hgpratios were reduced to an approximate ratio of 82 % : 13 % : 5 % in the plume compared to 53 % : 43 % : 4 % at the stack (Deeds et al., 2013). However, because of the differences between the two measurement techniques used in-stack and on the air-craft, the authors were unable to attribute the discrepancy between the stack and plume Hg speciation to the in-plume reduction of Hg2+to Hg0, but rather suggest that Hg0 concentration changes are due to plume dilution after leaving the stack.
In contrast to the above studies, concurrently measured concentrations of Hg2+ and SO2 suggest potential oxida-tion of Hg0 at the Devil’s Lake site in rural Wisconsin (Manolopoulos et al., 2007). Also increase of Hg2+ con-centrations with increasing distance of the plume from the source was also presented (Kolker et al., 2010). A lack of understanding of atmospheric mercury chemistry was un-derlined by recent measurements of elevated concentrations of Hg2+ in anthropogenic pollution plumes pointing to ox-idation of Hg0 (Timonen et al., 2012). Vijayaraghavan et al. (2008) incorporated a rapid in-plume reduction of Hg0 by SO2 in a regional model study and found that this im-proved the wet deposition estimates in the Northeast US. Considering limited and contrasting observational evidence, the mechanism of in-plume chemistry is unclear.
There is also evidence for Hg2+ adsorption on parti-cles (Rutter and Schauer, 2007a) and an adsorption mech-anism was introduced into initial model calculations result-ing in a ground-level Hg2+reduction by 23 % (Vijayaragha-van et al., 2008). Temperature-dependent adsorption ratios were also investigated in model calculations, resulting in a 90 % reduction of Hg2+ concentrations in cold air (Rutter and Schauer, 2007a, b), modelled in GEOS-Chem (Amos et al., 2012). Both mechanisms, in-plume reduction by SO2or other species and particle adsorption, could reduce Hg2+ es-timates in the model, provided that evidence from observa-tions supports these mechanisms, which so far is not the case for in-plume reduction processes. Lohman et al. (2006) and Vijayaraghavan et al. (2008) proposed a reduction mecha-nism for Hg2+ to Hg0 in the presence of SO2. Additional work, including stack and in-plume measurements, is neces-sary to reduce the high uncertainty associated with the pro-posed processes.
Recently, Y. Zhang et al. (2012) evaluated a nested-grid regional version of the GEOS-Chem model with AMNet data and found that assumption of in-plume reduction near the stack improves the model results. The significance of plume chemistry and atmospheric reduction processes (e.g. gas phase reactions, heterogeneous chemistry and aqueous chemistry) need to be further investigated as they could have a significant impact on Hg2+and Hpconcentrations. A sum-mary of uncertainties in atmospheric mercury chemistry was recently presented by Subir et al. (2011 and 2012).
3.5 Summary of uncertainties
The overall uncertainty and ultimately the discrepancy be-tween measured and model concentrations arise from mea-surement errors of atmospheric concentrations and stack measurements. Furthermore, the accuracy and precision of model estimates is impacted by errors in emissions concen-trations and lacking representation of chemical processes, one of which has been hypothesized to consist of in-plume reduction, albeit without confirmation from observations. Quantitative estimates of published uncertainties in measure-ments are summarized in Table 5. A quantitative summary estimate is difficult to achieve since the modes of calculation vary by author. A number of items lead to underestimation of measurement data, which could help in closing the gap between potentially overestimated model data and underesti-mated observations. Among these are the following for Hg2+ in Table 5: issues 6–8 result in losses and underestimation of oxidized mercury concentrations. Issue 2 could potentially lead to higher observed concentrations, reducing immediate local effects (Sect. 3.1). However, there is a significant lack of data requiring additional studies, and the item is excluded from subsequent calculations.
The summed-up average measurement uncertainties that lower concentrations (Table 5, items 6–8) are 86 % for Hg2+. Calculating the root sum of squares of uncertainties for cri-teria that lower or increase concentrations results in 36 % for Hg2+(items 1, 4), 43 % for Hg
p(item 5), and 23 % for Hg0 (item 3). The root sum of squares for anthropogenic emis-sion uncertainties is 36 % for Hg0and Hgp(items 11, 12) and 106 % for Hg2+(items 11, 12, 14). For item 12, 20 % uncer-tainty was assumed for the emission unceruncer-tainty by source category (listed as<30 %). These emission uncertainty es-timates are in good agreement with the recently published Arctic Monitoring and Assessment Programme report, which lists anthropogenic Hg0 emission uncertainties at 20–40 % (AMAP, 2011).
Additional sources of error not included in the above esti-mate stem from the differences between the sampling height and the model layer height used to extract the data. Also, the effects of vegetation on sampling carried out under the canopy may not be represented in the models (see Lindberg et al., 1998, for an example).
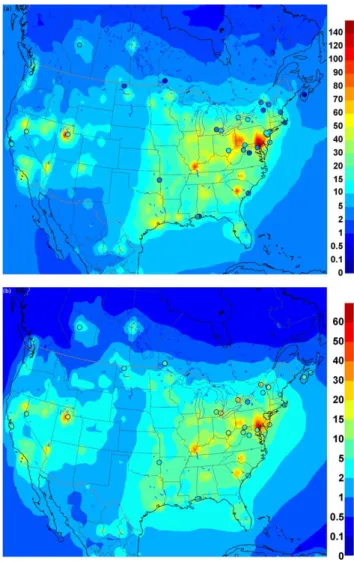
Fig. 2.Comparison of modelled and observed (circles) concentra-tions for (a)Hg2+ (pg m−3)and (b) Hgp (pg m−3) considering emissions only (NoChem; see Table 2 for details). A considerable discrepancy is observed especially in regions of high concentra-tions.
Table 5 demonstrates clearly that eliminating the discussed discrepancies and reducing observational uncertainties re-quires additional efforts from both modelling and measure-ment communities. The presented analysis, however, pro-vides starting points to address the improvement of analyt-ical and emission data: (1) choice of sampling locations and heights well represent atmospheric Hg2+concentrations and are in-line with model vertical structure, (2) assessment of interferences such as ozone, (3) elimination of data analy-sis issues related to low Hg2+and Hgpconcentrations, and (4) improved treatment of CFPP emission estimates with re-gard to coal burned and flue gas treatment systems.
3.6 Model sensitivity analysis
oxidized mercury concentrations in light of other measure-ment constraints such as Hg0 concentrations and wet de-position which are known to be more reliable measure-ments compared to the oxidized mercury measuremeasure-ments. The base model simulation for 2005 was performed using the GRAHM configuration used in L. Zhang et al. (2012); ozone is the main oxidant in this simulation. Several model sensi-tivity runs were conducted to expose the knowledge gaps in Hg chemistry and uncertainties in measurements of Hg spe-ciation in air and in emissions (Table 2 lists the experiments). First experiment was conducted to examine the impact of anthropogenic emissions of Hg2+ and Hgp on the ambient concentrations of these species in the model by eliminating the mercury chemistry in the model (Experiment NoChem). The air concentrations of oxidized mercury in this model experiment are the result of atmospheric transport of these species from the anthropogenic sources and removal by dry and wet deposition processes. Figure 2 illustrates the com-parison between model estimated surface air concentrations of Hg2+ and Hgpfrom “no chemistry” simulation and ob-served oxidized Hg concentrations. Even without the produc-tion of oxidized mercury through chemistry, an overpredic-tion of up to 20 times for Hg2+(for site NJ30 in 2009; see Table 4 for a detailed site description) and up to 7.6 times for Hgp (site MD08 in 2009) was found. The overpredic-tion of oxidized mercury is seen to be largest in the vicinity of emission sources. The wet deposition (not shown here) is also overpredicted in the vicinity of emissions sources; however it is underpredicted away from the sources due to lack of oxidation processes. Since only anthropogenic emis-sions contribute to the emisemis-sions of oxidized mercury, sig-nificant overprediction of surface air concentrations of Hg2+ and Hgpand wet deposition in the vicinity of major emission sources suggests that either the speciation of Hg in the an-thropogenic emissions is inaccurate or there are in-plume or other gas phase (and/or surface initiated) reduction reactions occurring in the atmosphere, which are very significant close to emission sources. The aqueous phase reduction processes in clouds cannot account for meaningful changes in specia-tion in the boundary layer as these processes are mostly ac-tive in free troposphere, and the cloud condensation occurs only∼50 % of the time in the atmosphere.
As seen in Fig. 2, the emission ratios of Hg0: Hg2+: Hgp at the stack and/or subsequent reactions in the plume ap-pear to be important parameters and processes that need improvements to better represent atmospheric oxidized and particulate mercury concentrations in the models. In the absence of better knowledge of emission speciation and in-plume chemistry, several model sensitivity runs were conducted by changing the emission ratios of emitted Hg species at the sources to simulate the impact of reduced oxi-dized mercury emissions and/or in-plume reduction or possi-bly other gas/heterogeneous phase reduction processes near emission sources. Further sensitivity simulations were per-formed where anthropogenic emissions of oxidized mercury
(Hg2+and Hgp)were completely eliminated from all sources (NoEmit); anthropogenic emissions of oxidized mercury were reduced for emissions from coal-fired power plants only (Hg0: Hg2+: Hgp from 50:40:10 to 90:5:5; Ex-ox1.5-CFPP); anthropogenic emissions of oxidized mercury were reduced from all anthropogenic emissions (Hg0: Hg2+: Hgp from 50:40:10 to 90:8:2; EX-ox1, Ex-ox2,
Ex-ox2-HiHgpand Ex-oxOH). The ratios for Hg0: Hg2+: Hgpwere changed from 50:40:10, in the base emissions inventory,
to 90:5:5 for coal-fired power plants in experiment Ex-ox1.5-CFPP following the observations of these species in emission plume from a coal-fired plant in Ontario, Canada (Deeds et al., 2013). The ratios for Hg0: Hg2+: Hgp were changed from 50:40:10, in the base emissions inventory, to 90:8:2 for all anthropogenic emissions in experiments EX-ox1, Ex-ox2, Ex-ox2-HiHgpand Ex-oxOH. The air con-centrations of Hg2+(gas) and Hgpare likely in equilibrium with each other; therefore, emissions of both Hg2+and Hgp were reduced by the same factor keeping the ratio the same as the original inventory. Sensitivity experiment was also con-ducted where anthropogenic emissions of Hg2+ (gas) only were reduced. This experiment resulted in significant over-prediction of Hgpand wet deposition near emission sources. The sensitivity experiments with reduced oxidized mercury emissions (for CFPP or all anthropogenic emissions) were first conducted using Hg0+O3reaction rate coefficient as in the base case simulation (Hall, 1995). These simulations re-sulted in high bias in Hg0background concentrations and low bias in wet deposition fluxes. Next, experiments were per-formed by incrementally increasing Hg0+O3reaction rates until the background Hg0 concentrations were comparable to the measured Hg0 concentrations . The O3reaction rate coefficient determined by Hall (1995) is an order of magni-tude lower compared to the more recent rates determined for this reaction; therefore increase of ozone reaction rate by a factor of 1.5 or 2 is within the range of uncertainties in the determined rate constant for this reaction. An additional sen-sitivity experiment was performed using OH (no ozone oxi-dation) as the main oxidant of Hg0in the atmosphere to in-vestigate the impact of OH oxidation chemistry (along with modified Hg emission speciation) on the distribution of at-mospheric Hg species in air and precipitation. Final experi-ment was performed by changing the ratio of gas phase oxi-dation products as Hg2+and Hgpfrom 0.5:0.5 (base case) to 0.25:0.75.
(a)
(b)
(c)
(d)
Fig. 3.Spread of yearly means for different model runs and observations. For a detailed model run description, see Table 2.(a)Hg0,(b)Hg2+,
(c)Hgp,(d)wet deposition.
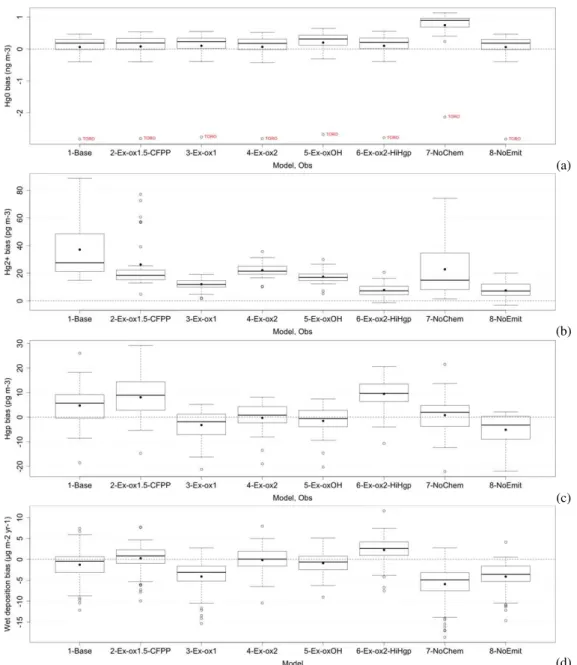
Average modelled median for Hg0is slightly higher (by 7 %) in the Ex-oxOH run compared to the base run (by 0.13 ng m−3 with an estimated Ex-oxOH median value of 1.8 ng m−3), whereas variation in the Ex-oxOH compared to the base run is somewhat larger (10 % vs. 3.5 % of the mean), which is related to the representativeness of the resolution of the model. The Hg0concentrations are seen to be invari-ant between experiments; however absence of Hg0oxidation processes in the atmosphere leads to unrealistically high val-ues of Hg0. Observed averaged mean Hgp concentration is slightly higher compared to the averaged median Hg2+ con-centration; however observed averaged median Hgp concen-tration is lower compared to averaged mean Hg2+
(a)
(b)
(c)
(d)
Fig. 4.Spread of yearly bias for different model runs. For a detailed model run description, see Table 2.(a)Hg0,(b)Hg2+,(c)Hgp,(d)wet deposition.
produced Hg2+and Hgpconcentrations are found to be very uniform across the domain. The wet deposition fluxes are un-derestimated in both cases and lack variation compared to measurements. A point to note here is that while both Hg2+ and Hgp mean concentrations are simulated to be higher in the NoChem experiment compared to the NoEmit experi-ment, the wet deposition is simulated to be markedly lower in the NoChem experiment compared to the NoEmit exper-iment. This is because the emissions increase Hg2+ in the boundary layer, where it can be readily dry-deposited; how-ever chemistry produces Hg2+ aloft that is scavenged into clouds and wet-deposited. These experiments suggest that spatial distribution of ambient Hg2+concentrations is more
likely to be generated by slow oxidative processes, whereas Hgp species is produced both through emission and chem-istry. Based on the no chemistry and no emission experi-ments, it can be inferred that the variability in Hg2+ concen-trations in base simulation is mostly due to the primary emis-sions of Hg2+, which is higher compared to measurements. Next experiment (Ex-ox1), where the emission ratios were modified to 90:8:2 (Hg0: Hg2+: Hg
(a) (b)
Fig. 5.Model plot of base and Ex-OH bias for(a)Hg2+and (b)Hgp at locations with distance from source. Distribution of Hg2+ in the NoChem experiment (plotted on the x-axis) is determined by the dispersion of these species from the emission sources only. Higher concentrations on the x-axis, therefore, represent proximity to the emission sources. On the left are remote stations, on the right stations close to sources.
the variance is reduced in all three variables, most notably in Hg2+concentrations, which is in line with observations. The oxidation rate was doubled in the next experiment (Ex-ox2) to see the impact on wet deposition fluxes. This experiment produced wet deposition fluxes comparable to the observed values; however Hg2+concentrations are increased by 60 %, whereas Hgp concentrations agree well with the observed values. In the next experiment (Ex-oxOH), OH was used as the main oxidant and ozone oxidation was not considered. The mean concentrations Hg0, Hg2+and Hgpwere found to be comparable to ozone oxidation experiment with twice the oxidation rate estimated by Hall (1995); however the spatial distribution of the species and wet deposition fluxes, partic-ularly the north–south gradient in wet deposition, was im-proved when OH oxidation was used. In Ex-ox1.5-CFPP ex-periment, the emission ratios for coal-fired power plants (CF-PPs) alone were modified to 90:5:5 (Hg0: Hg2+: Hgp); al-though the bias is reduced for both Hg2+and Hgp concentra-tions compared to the base run, very high concentraconcentra-tions of Hg2+at several sites and overestimation of Hgp concentra-tions were simulated. Another experiment (Ex-ox2-HiHgp) was conducted where the Hg2+/Hg
ppartitioning was modi-fied from 0.75/0.25 to 0.25/0.75 (Table 2). This experiment resulted in overprediction of Hgpas well as wet deposition. Overall, OH as dominant oxidation scheme for Hg0 with 90:8:2 emission ratios for Hg0: Hg2+: Hgpproduced best results. Changing emission ratios to 90:8:2 not only re-duces the bias in Hg2+, it also reduces the spread in the bias, decreasing the RMSE sharply by 42 % from 42 to 18 pg m−3 (Fig. 4b), whereas there is no significant change in the spread
of the bias in Hgpconcentrations (RMSE decrease from 10 to 6 pg m−3, i.e. by 40 %) (Fig. 4c). This difference between Hg2+and Hgpis likely due to the fact that primary emissions of Hg2+ are much higher in the original emissions inven-tory (40 %) compared to the emissions of Hgp(10 %) used in the base simulation. It is important to note that higher at-mospheric concentrations of Hg2+are needed compared to measured estimates in order to simulate the observed levels of wet deposition fluxes.
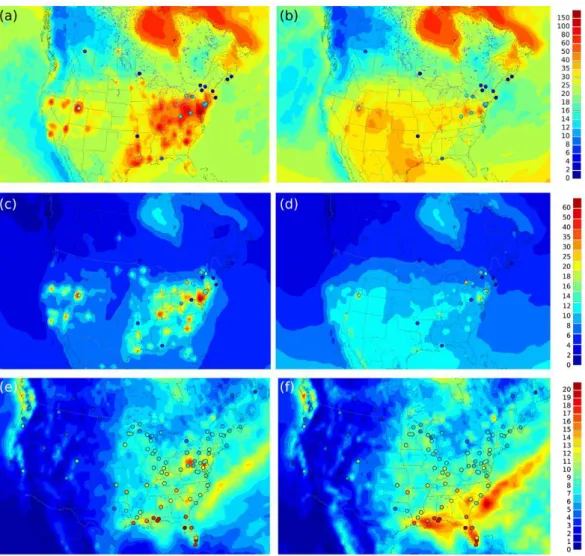
Fig. 6.Model map plots with observations circled.(a)Base run: Hg2+,(b)Ex-oxOH: Hg2+,(c)base run: Hgp,(d)Ex-oxOH: Hgp,(e)base run: wet deposition,(f)Ex-oxOH: wet deposition. Hg2+and Hgp are yearly averaged in pg m−3. Units for wet deposition are µg m−2yr−1.
such as NJ54 and NJ30. The bias is lowered from by 29 % from 68 to 20 pg m−3for Hg2+, and the unbiased root mean square error (URMSE) drops by 58 % from 19 to 11 pg m−3 for Hg2+at the NJ54 site, which has a mean Hg2+ concen-tration of 65 pg m−3. Thus, not only yearly means, but also temporal variations from weekly averaged data are markedly improved.
Figure 6 illustrates the spatial pattern of Hg2+, Hgp and wet deposition for the base run and the Ex-oxOH run with 90 % Hg0emissions and OH oxidation scheme. Hg2+is no-ticeably high in the base run in the vicinity of sources com-pared to the observed values. The Ex-oxOH run is clearly seen to be markedly improved. The most notable improve-ment is seen in the wet deposition, which has a N–S gradi-ent in the observations. The base run produces very high wet deposition fluxes in the vicinity of sources, whereas this dis-crepancy is corrected when most Hg is assumed to be emit-ted as Hg0(90 %). The N–S gradient is reproduced well in
the Ex-oxOH experiment. This is also the case with simula-tion using ozone as the main oxidant. N–S gradient and high wet deposition fluxes in the southeastern United States are a combination of chemically produced Hg2+in the free tro-posphere, gradient in precipitation and scavenging of Hg2+ by high cumulus clouds (Selin and Jacob, 2008). These re-sults suggest that Hg2+is dominantly produced by chemistry, and perhaps aerosol distribution in the atmosphere that would control the partitioning between the Hg2+and Hg
Fig. 7.Yearly averages (2005) of modelled wet deposition concen-tration plotted against MDN wet deposition measurements.
Wet deposition occurs by the scavenging of the oxidized mercury in and below cloud hydrometeors. Measured wet de-position fluxes are currently considered to be accurate within 20 % (Prestbo and Gay, 2009). Figure 7 presents the scat-ter plot of annual wet deposition flux for 2005 between ob-served (MDN) and three model runs (base, ox2 and Ex-oxOH). The intercept (i), slope (m) and correlation coef-ficient (r2) improved from base run (i=4.76, m=0.33, r2=0.26) to Ex-ox2 (i=4.36,m=0.50,r2=0.53) to Ex-oxOH (i=2.63, m=0.61, r2=0.66). Comparison of the monthly wet deposition fluxes for the three model runs (base, Ex-ox2 and Ex-oxOH) with MDN reveals that using the OH oxidation chemistry in conjunction with anthropogenic emis-sions as mostly Hg0 species improves the seasonal cycle throughout the year particularly in the northeast and south-east North America (Fig. 8). Stations used in the validation are mapped in Fig. 1, and a detailed list is given in Appendix Table A1.
4 Conclusions
The presented study provides a detailed analysis of uncer-tainties associated with oxidized mercury measurements and modelling for 21 sampling sites and a total of 41 yearly data sets acquired between 2002 and 2010 throughout North America. Measurement uncertainties underestimating Hg2+ concentrations are 86 % and 36 % for uncertainties yielding higher or lower concentrations. Anthropogenic emission un-certainties are 106 % for Hg2+. Individual contributions to uncertainties evaluated were the underestimation of reactive mercury due to interference of ozone (up to 50 %) and varia-tions of coal burned in power plants (100 %). Also, published
(a)
(b)
(c)
Fig. 8.Comparison of seasonal model estimates with MDN mea-surement data, all monthly means, for continental regions in North America.(a)Northeast (49 sites) and(b)southeast (24 sites) are divided by 36◦N.(c)The western region represents 15 sites from 100◦W. Stations are mapped in Fig. 1, and a detailed list is given in Appendix Table A1.
data from co-located measurements show differences of up to 40 %.
Model-related overestimation of reactive mercury species (Hg2+and Hgp)is found to be significantly related to over-estimation of oxidized Hg in emission inventories and/or in-plume reduction. A marked reduction of the URMSE by 42 % for Hg2+ and 40 % for Hgp was achieved when the ratio of emissions of Hg0: Hg2+: Hgp was changed from 50:40:10 (as specified in the original inventories) to 90:
up to 70 % (68 to 20 pg m−3)(NJ54) and 88 to 25 pg m−3 (NJ30). Furthermore, wet deposition was found to be better simulated using OH as the main oxidant compared to O3in North America. As a consequence identified uncertainties for model calculations, uncertainties in measurement methodol-ogy and emission inventories appear to provide exhaustive leads to close the gap between model estimates and obser-vations. The ratio of Hg0, Hg2+ and Hgp in the emission inventories, measurements of surface air concentrations of oxidized Hg and measurements of wet deposition are found to be inconsistent with each other in the vicinity of emission sources. Current speciation of Hg emissions suggests signifi-cantly high concentrations of Hg2+in air and in precipitation in the vicinity of emission sources; however, measured air concentrations of Hg2+and measured concentrations of Hg in precipitation are not found to be significantly elevated in the vicinity of emission sources compared to the remote re-gions. Major questions regarding plume chemistry and atmo-spheric mercury reduction reactions in the gas and aqueous phases and heterogeneous chemistry remain. More reliable measurements of Hg2+and Hgpconcentrations and product identification of atmospheric Hg species are required to test Hg chemical mechanisms in the models.
Table A1.Station ID and geographic location of validation stations discussed in Fig. 9. Unlabelled blue dots in Fig. 1 correspond to these stations as well.
Site Site Name Latitude Longitude (◦N) (◦W)
AB13 Henry Kroeger 51.4242 −110.8325 AL02 Delta Elementary 30.7905 −87.8497 AL03 Centreville 32.9035 −87.2499 AL24 Bay Road 30.4746 −88.1411 AZ02 Sycamore Canyon 35.1406 −111.9692 CA72 San Jose 37.4276 −122.0624 CA75 Sequoia National Park
– Giant Forest
36.5661 −118.7776
CO97 Buffalo Pass – Summit Lake
40.5383 −106.6766
CO99 Mesa Verde National Park – Chapin Mesa
37.1981 −108.4903
FL04 Andytown 26.1667 −80.5000 FL05 Chassahowitzka
National Wildlife Refuge
28.7486 −82.5551
FL11 Everglades National Park – Research Center
25.3900 −80.6800
FL32 Orlando 28.5926 −81.1904 FL34 Everglades Nutrient
Removal Project
26.6556 −80.3972
GA09 Okefenokee National Wildlife Refuge
30.7403 −82.1286
Table A1.Continued.
Site Site Name Latitude Longitude (◦N) (◦W)
GA40 Yorkville 33.9311 −85.0461 HD01 Huejutla 21.1583 −98.3706 IL11 Bondville 40.0528 −88.3719 IN20 Roush Lake 40.8401 −85.4639 IN21 Clifty Falls State Park 38.7622 −85.4202 IN26 Fort Harrison State
Park
39.8583 −86.0208
IN28 Bloomington 39.1464 −86.6133 IN34 Indiana Dunes
National Lakeshore
41.6318 −87.0881
KY10 Mammoth Cave National Park – Houchin Meadow
37.1317 −86.1480
LA05 Lake Charles 30.1746 −93.1717
LA10 Chase 32.0970 −91.7110
LA23 Alexandria 31.1698 −92.3971 LA28 Hammond 30.5031 −90.3769 MA01 North Atlantic
Coastal Lab
41.9758 −70.0247
MD08 Piney Reservoir 39.7053 −79.0122 MD99 Beltsville 39.0280 −76.8171 ME00 Caribou 46.8675 −68.0134 ME02 Bridgton 44.1075 −70.7289 ME09 Greenville Station 45.4891 −69.6647 ME96 Casco Bay –
Wolfe’s Neck Farm
43.8325 −70.0645
ME98 Acadia National Park – McFarland Hill
44.3772 −68.2608
MI48 Seney National Wildlife Refuge – Headquarters
46.2875 −85.9541
MN16 Marcell Experimental Forest
47.5311 −93.4686
MN18 Fernberg 47.9464 −91.4961 MN22 Mille Lacs Band of
Ojibwe
46.2053 −93.7589
MN23 Camp Ripley 46.2494 −94.4972 MN27 Lamberton 44.2369 −95.3010 MO46 Mingo National
Wildlife Refuge
36.9716 −90.1433
MS22 Oak Grove 30.9850 −88.9319 MT05 Glacier National Park
– Fire Weather Station
48.5103 −113.9958
NC08 Waccamaw State Park 34.2592 −78.4777 NC42 Pettigrew State Park 35.7373 −76.5149 ND01 Lostwood National
Wildlife Refuge
48.6424 −102.4022
NF09 Cormak 49.3214 −57.3931
NM10 Caballo 33.0625 −107.2917 NS01 Kejimkujik National
Park
44.4328 −65.2056