Isabel Bezerra da Cunha
Faculdade de Engenharia da Universidade do Porto isabelcunha.arqurb@gmail.com
CYCLING TO THE UNIVERSITY: EVALUATING THE POTENTIAL MOBILITY
PATTERNS CHANGING TOWARDS BICYCLE USAGE
Cecília do Carmo Ferreira da Silva Faculdade de Engenharia da Universidade do Porto ccsilva@fe.up.pt 1393
8º CONGRESSO LUSO-BRASILEIRO PARA O PLANEAMENTO URBANO, REGIONAL, INTEGRADO E SUSTENTÁVEL (PLURIS 2018)
Cidades e Territórios - Desenvolvimento, atratividade e novos desafios
Coimbra – Portugal, 24, 25 e 26 de outubro de 2018
CYCLING TO THE UNIVERSITY: EVALUATING THE POTENTIAL MOBILITY PATTERNS CHANGING TOWARDS BICYCLE USAGE
I. Cunha, C. Silva
ABSTRACT
Policymakers at many universities are struggling to promote cycling in the local community in a way to recover campuses as a more livable and sustainable area, as well as decrease the current pollution emissions rate from students and staff commuting patterns. In such a context, providing and making bicycles accessible are considered promising initiatives to deliver such issues. However, the effectiveness regarding how such provision can establish a bicycle culture, in a current car-orientated built environment must be explored, highlighting the role of personal factors and the physical conditions to take up cycling. This paper applies the transactional model of behaviour change to investigate the influence of bicycle supplying on behaviour and mobility patterns changing, taking U-Bike Portugal Project and the Faculty of Engineering at the University of Oporto as a case of study.
1 INTRODUCTION
Environmental and sustainable issues, such as land scarcity, high level of motorisation, pollution, greenhouse emissions and the consequent climate change, are highlighted in urban agendas worldwide in the last decades. To deal with such global issues, the current EU’s agenda targets reducing greenhouse gas emissions by 20% by 2020, as well as keeping a global temperature rise this century well below 2 degrees Celsius (May, 2016). There has been much discussion over delivering sustainable mobility within the transport network, by creating both public transport oriented and car-free development, throughout efforts to strengthen the links between land use and transport, by reducing the need to travel and its distances (Banister, 2008).
In such a context, a modal shift to cycling has a clear potential to reduce carbon emission in the transport sector. A study assumed that if the whole EU population would cycle as much as the population of Denmark did in 2000, between 55 and 120 million tons of CO2 could be saved annually by 2020 (Federation, 2017).
Regarding sustainable actions in a local-scale, University campuses are considered one of the sectors with the great potential to reduce its negative environmental impacts in the urban fabric, by encouraging the increase of the active modes of transportation and reshaping the current mobility patterns of our society (Balsas, 2003).
Following the current efforts targeting the increase of bicycle modal share and the decrease of CO2 emissions, Portuguese authorities launched an ambitious national cycling mobility project for the main Portuguese Universities along the country, during fall of 2016. Such plan, namely U-Bike Project, aims to increase bicycle usage within 15 universities, from enabling temporary both conventional and electric bicycles ownerships to students and staff, who are currently relying on motorised modes of transport.
However, it is unclear the extent to which such provision of bicycles can generate a substantial modal shift, in a current car-orientated built environment. Throughout a mixed-method approach, this paper investigates the current university constituents’ behaviour, and attitudes towards cycling explore the bicycle provision potential to induce a take-up and maintenance of cycling in the university context, as well as the community’s needs and barriers.
The next section reviews an in-depth discussion of concepts regarding the implementation of sustainable mobility plans at university campuses, followed by the description and application of the methods and the discussion of the main findings. In the last section of this paper, there are the main conclusions described.
2 LITERATURE REVIEW
2.1 Cycling Incentives, Motivations and Barriers in the University Campus
Several campuses in the USA and Europe have attempted to promote equity, social justice, and prosperous economy through the management of an efficient transportation system, throughout Transport Demand Management measures (Balsas, 2003). Such packaging term targets the efficient use of transport resources and improves access for non-motorized commuters (Bond and Magnusson, 2006; Poinsatte and Toor, 1999; Rybarczyk and Gallagher, 2014).
The number of initiatives to increase cycling, through facilitating ownership or enabling the temporary use of bicycle, is growing quickly over the past decade as part of the search for more sustainable transport solutions. In the university setting, was found two models of such provision: Bike Sharing Scheme (BSS) and Long-term Bike Rental Scheme (LBRS), which gather the following outcomes: increased mobility options, cost savings, reduced traffic congestion, reduced fuel use, increased use of public transport and alternative modes, increased health benefits and greater environmental awareness (DeMaio, 2009).
According to the literature reviewed, staff and students would cycle more under the provision of safer and well-connected bicycle routes as well as better lighting, and visible bicyclists, which represents a latent demand for bicycle (Rybarczyk and Gallagher, 2014). The aspect of the bike, which people are most positive towards include fitness and health as the greatest motivators for using the bicycle (Fernández-Heredia et al., 2014), followed by enjoyment and pleasure (Gatersleben and Appleton, 2007). People would bicycle more due to income limitations, or to save money (Molina-García et al., 2015; Swiers, 2017). Furthermore, people can bicycle since they find such modality convenient and efficient (Fernández-Heredia et al., 2014). Educational programs and events could also facilitate bicycle usage (Poinsatte and Toor, 1999).
Universal bicycling deterrents include weather (Fernández-Heredia et al., 2014), reduced bicycle security, crime, and fear about personal safety (Swiers, 2017; Fernández-Heredia et
al, 2014; Rybarczyk & Gallagher, 2014; Kaplan, 2015) Increasing trip length and time represented an important and significant negative effect on the attractiveness of cycling (Hunt, 2007), as well as the cost of purchasing a bike (Swiers, 2017).
Previous studies have shown that younger students walked more than older students did. Low socioeconomic status students walked more than those in the high group did. However, biking was significantly higher in the high socioeconomic status group than the medium group (Shafizadeh and Niemeier, 1997). Students who lived in university residences had significantly higher energy expenditure in both walking and biking than those living in private homes (Molina-García et al., 2013).
Above all, the literature reviewed revealed travelling can be maximised by thoroughly integrating bicycling and walking needs and desirable circulation patterns in all transportation, housing, and environmental policies, from a synergetic sustainable plan (Balsas, 2003).
2.2 Understanding the University Community – Cyclist Profiles
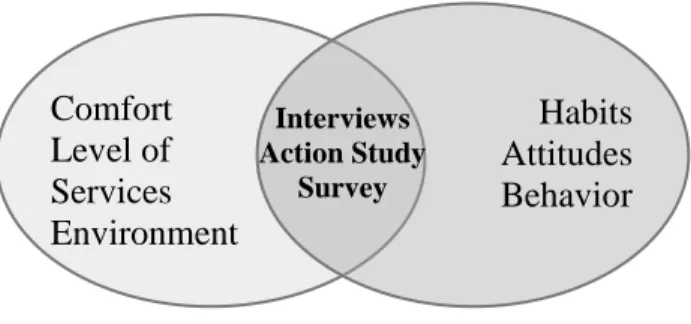
In a way to understand predictors of cycling and develop successful interventions for potential target groups, some researchers state the hypothesis that there are different types of cyclists, with specific habits and behaviours, regarding different types of facilities, treatments and environments. Based on the literature, the cyclist’s categorisation concentrates into two methodological spheres, one based on the external factors, and another on the personal ones. In the former, the built environment, comfort, and services play an important role on the current bicycle modal share level. In the later, personal intentions, habits, attitudes and perceptions. In both cases, the literature stressed the importance of interviews and surveys to gather information.
According to the literature reviewed – see Figure 1 - people were categorized based on the bicycle use frequency (Manaugh and El-Geneidy, 2015), on the use frequency according to the period of the year (Bergstrom and Magnusson, 2003), based on level of experience and comfort (Dill and McNeil, 2013), and regarding the behaviour and intentions towards bicycle (Gatersleben and Appleton, 2007).
Since the main objective of this paper is to assess the potential behaviour change towards cycling, it is imperative to find out more about who cycles and why, as well as examine in more detail how persuasion might be an important tool to make people to cycle, in different stages of change. In fact, according to Gatersleben and Appleton (2007), a person is attempting to change a behaviour typically moves through stages of change, several times.
Fig. 1 Cyclists categorization approaches
Comfort Level of Services Environment Habits Attitudes Behavior Interviews Action Study Survey
Thus, understand where people are in the target population are regarding stages of behaviour model is fundamental do develop more effective strategies to make people continue with such new attitude.
3 THE UNIVERSITY CYCLING POTENTIAL ASSESSMENT METHOD
The present study applies a mixed method approach, both quantitative and qualitative, to investigate the extent to which such bicycle provision scheme can change the community mobility patterns towards cycling, in a current car-orientated built environment. By exploring the U-Bike Portugal Project and the Faculty of Engineering at the University of Oporto as the study case, the proposed analysis methods allow the discussion of the added value of the ex-ante evaluation.
The mentioned approach may confirm the hypothesis that unattended bicycle access scheme is not determinant to create and maintain such new mobility patterns, since each cyclist profile or member of university community may hold different perceptions of such cycling experience, which could affect their cycling frequency maintenance, representing a valuable source of information for further planning and intervention measures.
Thus, the proposed approach investigates: (1) the current mobility behaviour and community’s perceptions towards cycling; (2) examine the bicycle potential to induce a take-up and maintenance of cycling the university context and (3) explore the community’s needs and barriers.
The first (1) analysis is a quantitative approach, structured upon an Attitudinal web-survey, which assesses the current transport modal share, travel behaviour, the cycling attitudes, as well as the socio-economic characteristics and various aspects of the daily commute, amongst the university population. The second (2) categorise the respondents into one of the 5 Behavior Change Stages (BCS) towards bicycle use, based on the Transactional Model of Behavior Change (Gatersleben and Appleton, 2007), in a way to assess the socio-characteristics, attitudes, barriers and motivations towards cycling in different stages of change. The last part of the evaluation (3) explores the population needs, barriers and potentialities, by each BCS representative, in a way to understand in more detail how more people can be persuaded to cycle to the university and asses the favourable target population for the bicycle rental scheme.
3.1 Attitudinal Survey
The present research delivered the Attitudinal Survey to the local community via web service, conducted as self- administrated questionnaire between the days of 10th to 30th April 2018, gathering a response rate of 5% (505 participants) within FEUP community. The first section of the survey assessed the current mobility behaviour and the main perceptions and attitudes stratified by different modes of transportation. Furthermore, through a set of five-level Likert items1, respondents specify their level of agreement or disagreement for a series of 6 subjective perceptions of their current travel and transport mode: (1) Stressful; (2) Fun; (3) Boring, (4) Relaxing; (6) Interesting; (7) Depressive. A set
1 The format of the five-level Likert item used was: 1. Strongly disagree, 2. Disagree, 3. Agree, 4. Strongly agree, 5. No Opinion
of five-level Likert questions2 explored the likelihood to use different modes of transport where respondents specify their propensity or not to change their current mobility choice towards the active modes.
The second section assessed the respondent’s attitudes towards cycling, by exploring the respondents’ bicycle ownership and usage frequency to different activities. Furthermore, researches measured intentions and perceptions towards cycling through 12 five-level Likert statements. The last section explored the socio-economic profile, followed by the assessment of respondents’ intention to participate in the cycling trial study.
3.2 Transactional Model of Behavior Change
To examine in more detail, the potential of bicycle provision to induce and maintain a take up to cycling, it is important understanding where people in the target audience are regarding the stages of behaviour change is fundamental to develop more effective strategies to make people continue with such new attitude.
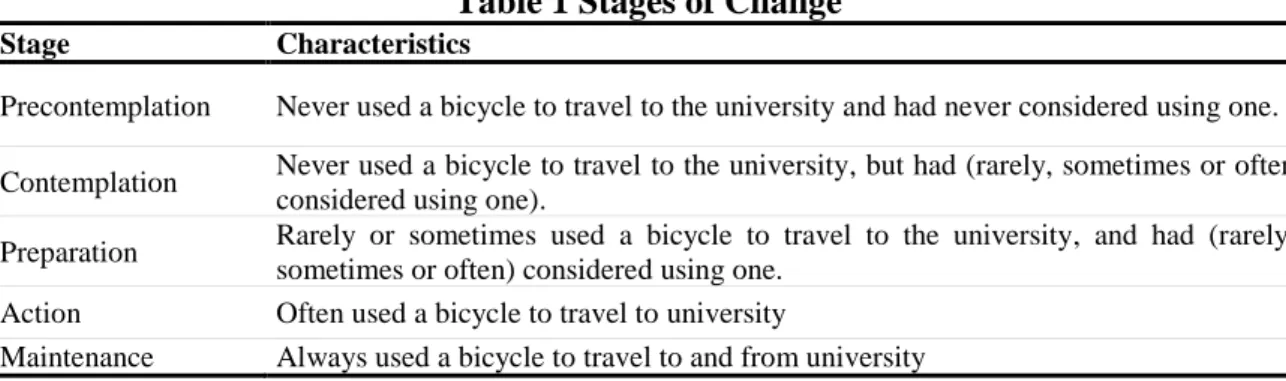
Thus, this research applied the Transactional Model of Behavior Change (Gatersleben and Appleton, 2007; Prochaska, 1994) and categorised the respondents based on two survey variables: (1) how often they used a bicycle to travel to the university and (2) based on the respondent’s intention to use a bicycle for commuting purposes in the future. The five Behavior Change Stages (BCS) are characterised: in Table 1:
Table 1 Stages of Change
Stage Characteristics
Precontemplation Never used a bicycle to travel to the university and had never considered using one. Contemplation Never used a bicycle to travel to the university, but had (rarely, sometimes or often
considered using one).
Preparation Rarely or sometimes used a bicycle to travel to the university, and had (rarely, sometimes or often) considered using one.
Action Often used a bicycle to travel to university
Maintenance Always used a bicycle to travel to and from university
After assessing who cycles and who does not, the next step of this approach was to investigate what motivates these different groups. The survey asked under what circumstances the respondents would be willing to cycle to the university more often (Gatersleben and Appleton, 2007).
3.3 Cycling Experience
The last study approach explored in more detail the university community’s needs and barriers, and to understand how more people could be persuaded to cycle and maintain such mobility behavior throughout a one-week cycling experiment based on the research method by Gatersleben and Appleton (2007), which counted with Interviews sections and a self-completion Travel Diary.
2 The format of the five-level Likert item used was: 1. Very Unlikely; 2. Unlikely; 3. Perhaps; 4. Quite Likely; 5. Very Likely
After sorting the volunteers, based on the BCS representatives, this study selected ten volunteers: three in the Maintenance stage; two in the Action stage; two in the Preparation stage; and three in the Contemplation stage. There were none volunteers from Precontemplation stage. In fact, such a profile is considered the most difficult group to embrace such mode of transportation. Such sample gets at least one representative person from each university community groups. Between the people interested, it was selected: 2 professors; 2 researchers; 5 master’s students; and 1 PhD student.
For one week, the participants had to evaluate their commuting journey into a self-completion Travel Diary delivered to them during the first interview. In such document, they were asked to describe the most pleasant and unpleasant experience during their cycling journey to and from the Faculty in a daily schedule, as well as report the route chosen, and the time spent between the origins and destinations.
This research conducted interviews with the volunteers before and after the one-week period, as a way to assess their perceptions changing, such as expectations and worries regarding cycling to the university. In the first interview, respondents were asked how they usually travelled to the university and why, as well as why they wanted to participate in the study and their expectation about the cycling trial. In the second interview, they were asked about how they had experienced the study and whether and for what reasons they intended to continue cycling or not, as well as what they had enjoyed most and what they had enjoyed least (Gatersleben and Appleton, 2007).
4 DISCUSSION OF THE POTENTIAL MOBILITY PATTERNS CHANGING TOWARDS CYCLING
4.1 Mobility Patterns, Attitudes and Perceptions
By investigating the current attitudes and perceptions towards cycling amongst the university population, this research revealed that the attitudes towards cycling become more positive with the increase of cycling frequency and if the person does not own a car for daily use. As already found in previous studies, this research found a higher bicycle usage amongst men (North, 2012; Molina-García et al., 2015; Gatersleben and Appleton, 2007), and those who live in a reasonable cycling commuting distance, within 30 minutes or 5 km (Molina-García et al., 2013). The bicycle usage is popular not only amongst the youngers (Shafizadeh and Niemeier, 1997) but also adults between 36 and 45 years old. Above such age gap, the use of private vehicles is considerably higher than the bicycle.
Regarding the current mobility patterns and travel behaviour, this research found a high level of motorisation in the university community, with a great share of people who use automobile even within reasonable cycling and walking distances, as other studies have already found (Kaplan, 2015). Furthermore, those who travel bigger distances preferred individual transportation modes than public and alternatives ones. A lack of municipality and such phenomenon are linked, and the university’s planning policies to constrain car usage, which makes such mode of transportation more convenient and accessible, affecting the transport network system directly, as already found in previous research (Silva and Pinho, 2014).
However, while some studies have shown that active commuting remains low for students (Kaplan, 2015), this research reported that walking to the university is the third preferred mode of transportation, while bicycle remained in a low rate. From data collection, automobiles were the most used mode of transportation 36%, followed by public transport (TP) 34%, walking 21%, cycling 6% and 3% of the respondents use more than two different transportation modes in their daily travels (MM).
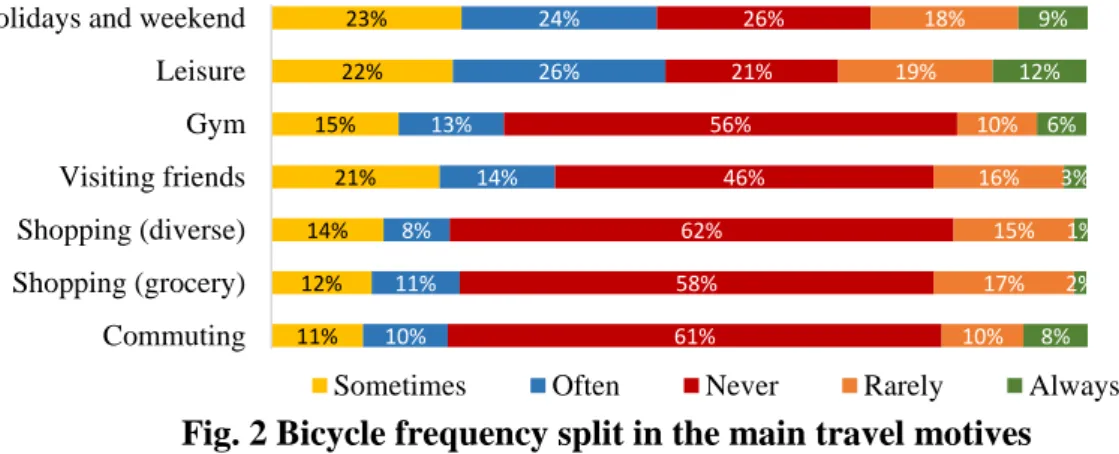
This research suggests the high level of bicycle ownership and environment awareness do not mean better attitudes towards cycling. In fact, a great share of respondents who owns a bicycle and agreed that cycling is a healthy mode of transportation and good for the environment, do not cycle for any purpose, neither use it for physical activities. Furthermore, the frequency of cycling was higher during weekends, holidays and for leisure activities, which implies a great share of the community holds the vision that the bicycle is not suitable for commuting purposes.
Although a significant share of respondents agreed that cycling is a healthy mode of transportation and good for the environment, more than half of the respondents do not cycle for any purpose and do not use it as a way to practice physical exercises. Figure 2 illustrates the bicycle frequency split in the main travel motives found in this sample:
Fig. 2 Bicycle frequency split in the main travel motives
This research assessed the respondent’s psychological perceptions and intentions associated with the journey and the current transport mode chosen. Those who spent more time commuting by motorised modes and live in a quite far distance from the university have highlighted more negatives views of the journey than the positive ones. Certainly, as found in preceding researches, increasing trip length represented as a greater trip time an important and significant negative effect on the attractiveness of cycling (Hunt, 2007; Gatersleben and Appleton, 2007).
Among all groups, MM counts with the highest negative perception of the journey, highlighting all three negatives perceptions. Car and TP users highlight two negative states. Approximately 71% of MM users consider their journey stressful. This number is slightly high for drivers with 44% and TP users 37%. A great share of TP users 82% consider their journey boring, and MM agreed 79% in such perception. This perception is above the average for drivers 39%. Just MM users highlight the perception – depressive - in this sample, counting 43% of the respondents, all the other groups have such perception below the average rate. The respondents, who use active modes of transportation, perceived the journey more positively. Above all, cyclists have the highest positive view, highlighting all
11% 12% 14% 21% 15% 22% 23% 10% 11% 8% 14% 13% 26% 24% 61% 58% 62% 46% 56% 21% 26% 10% 17% 15% 16% 10% 19% 18% 8% 2% 1% 3% 6% 12% 9% Commuting Shopping (grocery) Shopping (diverse) Visiting friends Gym Leisure Holidays and weekend
three positive states: 81% considered the journey relaxing and 72% considered it fun and interesting. For walkers, it was highlighted the relaxing sensation at 64%, while the other two positive perceptions are slightly above the average, fun with 35% and interesting 33%. By analysing the travel time perceived, a share of 79% of MM users perceive their distance travelled long, while the active ones perceived their journey distance short: 75% of cyclists and 74% of walkers. Car and TP users travel medium distances, both with a share of 42% and 38%. However, a great share of car users 45% perceived their commuting travel short, as well. Within such an analysis, this research suggests those who spent more time commuting have highlighted more negatives views of the journey than the positive ones. When people spend less time commuting, as cyclists and walkers, the journey is perceived more positively.
4.2 The bicycle provision potential to change mobility behaviour
Throughout the application of the Transactional Model of Behavior Change (Gatersleben and Appleton 2007; Prochaska, 1994)., this research revealed that a great share of the university community is restrictive towards cycling. The last BCS group concentrates an expressive number of respondents - 40% of the sample is in the Precontemplation stage (PC), representing those who do not cycle to commute to the university and do not want to do so in the future. The second highest population is in the Contemplation stage (C), with a share of 24% in this sample. The third group of people, which is constituted by 20% of the sample, are in the Preparation stage (P), representing those who rarely or sometimes used a bicycle to travel to the university and have considered using one in the future. The fourth group – Action stage (A) - representing a share of 10%, are those who often travel to the university by bicycle. The Maintenance stage (M) 6% - represents the smaller portion of the sample, by those who travel by bicycle to the university every day.
Throughout a spatial analysis, this research assessed that with the increase of the distance to be travelled, there are more representatives of the last BCS group spread in the urban fabric. While, inside the bicycle accessibility zones (BAZ), and closer to the faculty, there are more representatives already in action and maintenance, 70% and 90%. The easiness and flexibility of access the faculty by bicycle in such zones explain such phenomenon.
The last BCS groups – Precontemplation and Contemplation – have a great share of representatives who never ride a bicycle, both 49%, and 36%, for any purpose. Furthermore, such groups have demonstrated a slight bicycle frequency, respectively 22% and 23% ride a bicycle just once per month. The most promising bicycle frequency usage, between those who do not use the bicycle for commuting purpose, was found in the Preparation stage group. They usually make one trip 3or 2 to 3 trips per week, counting 60%, for other activities instead of commuting.
Regarding gender and cycling usage, a great share of women is in the two earliest BCS – Precontemplation 52% and Contemplation 40%. Just 2% of the women use the bicycle for daily commuting in this sample. Such profile needs special attention and encouragements to embrace such mode of transportation in a daily schedule.
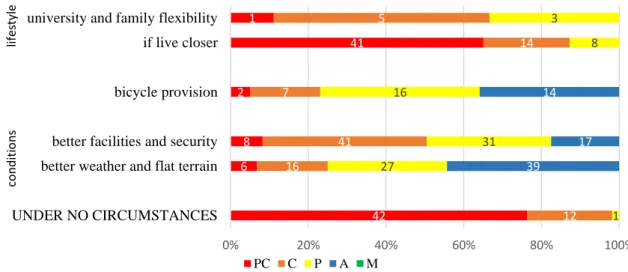
This research assessed under what circumstances the university constituents would be willing to cycle to the university more often – see Figure 3. Based on the variety of aspects within each BCS group, there are three categories of analysis with the responses recorded
into three categories of analysis: (1) Different lifestyle; (2) Incentives; (3) Better conditions and (4) Under no circumstances.
Fig. 3 Respondents mentioning circumstances under which they would be willing to cycle to the university more often (% by each BCS group)
The respondents who had never contemplated cycling to the university claimed they are not willing to cycle to the university under any circumstances, with a share of 42%. The other part of the respondents share asserted that they would cycle to the university if they live closer. Such a group is the most difficult one to change their mobility behaviour. For contemplative respondents, 41% have claimed that they would cycle more often if the city and the university environment provide better facilities and security Respondents who were prepared to start cycling also agree with such statement in 31%. For people in action, better weather and flat terrain are determinants for their bicycle usage level, with an agreement rate of 39%. Such a group does not use bicycle often during the winter season. Also, they choose another transport mode to go to the university on rainy days.
Fewer respondents have claimed that they would cycle to the university under bicycle provision. Between all groups, the preparation stage 16% and action stage 14% have a quite low agreement in such mater but is still above the average 7.8%. In fact, as explored above, more than half of the respondents already own a bicycle for daily usage. Thus, just providing a bicycle is not enough to change and sustain such mobility behaviour.
4.3 The university community’s motivators and barriers
Motivations and barriers towards cycling vary along the stages of change. Those who had never contemplated cycling perceive more personal and physical barriers than the others BCS representatives. In fact, almost half of the PC respondents, 49%, consider themselves without a good physical condition to ride a bicycle to the university. By analysing throughout the BCS groups, it is noticeable that the personal barriers decrease when we move to the next stage, close to the action. In fact, this rate dropped to 16% in the next stage – Contemplation – and to 2% in the Preparation stage.
Concerning structural barriers perceived, the lack of cycling infrastructure conditions and the perceived danger play an important role in the cycling frequency, especially for
non-42 6 8 2 41 1 12 16 41 7 14 5 1 27 31 16 8 3 39 17 14 0% 20% 40% 60% 80% 100% UNDER NO CIRCUMSTANCES better weather and flat terrain better facilities and security bicycle provision if live closer university and family flexibility
PC C P A M in ce n ti ve d iff ere n t lifes tyl e b ett er co n d iti o n s
cyclists and those who cycle longer distances as found in previous studies (Fernández-Heredia et al., 2014; Molina-García et al, 2013; Kaplan, 2015; Poinsatte and Toor, 1999; Gatersleben and Appleton, 2007). Even though the sustainable awareness is expressive amongst the university’s constituents, a great share holds negatives views of their conditions and the current built environment, which decrease the likelihood of cycling in a daily schedule.
This study also revealed cycling in narrow routes, with irregular ground pavement, the lack of connectivity and directness in the urban form, as well as the unsafe parking spots in the city and the university setting (Fernández-Heredia et al., 2014), proved to be great deterrents to cycling in the city.
The environmental factors played some unexpected roles in the uptake of cycling. This investigation found the hilly topography in the city was not considered a great impediment to cycling, as found in other researches (Fernández-Heredia et al., 2014). Topography played a dual role into cycling level, on the one hand providing pleasure and speed through downhill routes. On the other hand, cycling on uphill routes can be uncomfortable and challenging, since it constrained speed and accessibility. The weather was also seen positively and negatively, with people cycling more frequently in sunny and warmer days, than during rainy and hot ones, as already stressed in the literature reviewed (Fernández-Heredia et al. 2014; Swiers, 2017; Rybarcyk and Gakkagher, 2014). Above all the environmental factors, the pollution in the areas with heavy traffic was the biggest impeditive to cycling in this research, especially for those who cycle longer distances.
After the cycling experiment assessment, it was observed an increase of self-awareness and better attitudes towards cycling, with a share of 57% of the participants moving to a better stage in the BCS model. Furthermore, the present research indicates the most favourable target population for such bicycle scheme is in the Preparation stage, which contains those who have the most positive views and attitudes to maintain such new mode of transport afterwards. The Contemplation stage faced personal and physical barriers which declined their cycling frequency during the week. The most unfavourable population is in the Precontemplative stage, in fact, none representative of this group wanted to participate in the cycling experience, as well as they hold the most negative views towards the bicycle.
5 CONCLUSIONS
Researching the influence of bicycles provision in the promotion of sustainable mobility amongst students and staff who are automobiles users is valuable as a way to establish effective planning tools and measures to upgrade the overall quality of life on campus and increase the active commuting patterns.
The implementation of such project has the potential to raise awareness towards cyclists needs, fostering the engagement of policymakers and stakeholders, since the increase of cyclists will reflect not only within the university setting but also in the whole urban network. However, the target population should receive support and complementary incentives to keep such behaviour and move to the ideal stage and travel by bicycle in a daily schedule. This research found that the most favourable condition for new cyclists keep such behaviour is the provision of better bicycle facilities and security. Those who cycle to the university
always or often will keep such mobility choice, and just an accident or bicycle robbery would stop them to cycle to the university. The secondary deterrents to cycling for the potential new cyclists are the bad weather, family or work schedule and, heavy road traffic, especially for those who will travel long distances.
Even though, this research found the current city’s built-environment is car-orientated and unfriendly towards cycling, the provision of the bicycle has the potential to increase self-awareness and better attitudes towards cycling. After experiencing the use of the bicycle for commuting purpose, more than half of the participants moved to a better stage in the BCS model. However, this research revealed the unattended bicycle access scheme is not determinant to create and maintain such new mobility pattern since barriers as the lack of security, heavy traffic and poor road conditions constrain the likelihood of potential new cyclists to keep such modal choice for commuting purposes.
6 REFERENCES
Balsas, C. J., 2003. Sustainable transportation planning on college campuses. Transport Policy, 10(1), pp. 35-49.
Banister, D., 2008. The Sustainable Mobility Paradigm. Transport Policy, 15(2), pp. 73-80.
Bergstrom, A., Magnusson, R. 2003. Potential of transferring car trips to bicycle during winter. Transportation Research Part A, Volume 37, pp. 649-666.
Bond, A., Steiner, R., 2006. Sustainable Campus Transportation Through Transit Partnership and Transportation Demand Management: A Case Study from the University of Florida. Berkeley Planning Journal, 19(1), pp. 125-142.
DeMaio, P., 2009. Bike-sharing: History, Impacts, Models of Provision, and Future. Journal of Public Transportation, 12(4), pp. 41-56.
Dill, J. McNeil, N., 2013. Four types of cyclists? Examining a typology to better understand bicycling behaviour and potential. S .l., 92nd Annual Meeting of the Transportation Research Board.
Federation, E. C., 2017. EU Cycling Strategy: Recommendations for Delivering Green Growth and an Effective Mobility System in 2030, Brussels: European Cyclists' Federation (ECF) Association sans but lucrative (asbl).
Fernández-Heredia, Á., Monzón, A., & Jara-Días, S., 2014. Understanding cyclists perceptions, keys for a successful bicycle promotion. Transportation Research Part A: Policy and Practice, 63, 1-11.
Gatersleben, B. & Appleton, K., 2007. Contemplating cycling to work: Attitudes and Perceptions in different stages of change. Transportation Research Part A: Policy and Practice, 41(4), pp. 302-312.
IMT, 2015. Plano de Monitorização U-Bike Portugal. s.l.:s.n.
IMT, 2016. Regulamento Geral do Projeto U-Bike Portugal - Promoção da mobilidade ciclável nas comunidades académicas. s.l.:s.n.
Kaplan, D. H., 2015. Transportation Sustainability on a University Campus. International Journal of Sustainability in Higher Education, Volume 16, pp. 173-186.
May, A., 2016. CH4LLENGE Measure selection Manual - Selecting the most effective packages of measures for Sustainable Urban Mobility Plans, Brussels: European Commission.
Molina-García, J., Sallis, JF., Castillo, I., 2013. Active Commuting and Sociodemographic Factors Among University Students in Spain. Journal of Physical Activity and Health, 11(2), 359-363.
Manaugh, K., El-Geneidy., A., 2015. Overcoming barriers to active transportation: Understanding reasons for not cycling in a University setting. Transportation Research Board 84th Annual Meeting.
Poinsatte, F., Toor, W., 1999. Finding a New Way: Campus Transportation for the 21st Century. S .l.: University of Colorado Environmental Center.
Ryan Swiers, C. P. I. G., 2017. A cross-sectional survey of attitudes, behaviours, barriers and motivators to cycling in University students. Journal of Transport & Health, Volume 6, pp. 379-385.
Rybarczyk, G., Gallagher, L., 2014. Measuring the Potential for Bicycling and Walking at a Metropolitan Commuter University. Journal of Transport Geography, 39, 1-10. Silva, C. Reis, Pinho, P., 2014. How urban structure constrains sustainable mobility choices:
comparison of Copenhagen and Oporto. Environment and Planning B: Planning and Design, 41, 211-228.
Shafizadeh, K., Niemeier, D., 1997. Bicycle Journey-to-Work: Travel Behavior Characteristics and Spatial Attributes. Transportation Research Record: Journal of the Transportation Research Board, 84-90.