UNIVERSIDADE DE LISBOA
FACULDADE DE CIÊNCIAS
Departamento de Biologia Vegetal
The role of Notch signaling in thymic and
parathyroid glands organogenesis
Joana Clara Silva
Dissertação
MESTRADO EM BIOLOGIA MOLECULAR E GENÉTICA
2013
UNIVERSIDADE DE LISBOA
FACULDADE DE CIÊNCIAS
Departamento de Biologia Vegetal
The role of Notch signaling in thymic and
parathyroid glands organogenesis
Joana Clara Silva
Dissertação orientada por:
Pofessora Doutora Hélia Cristina de Oliveira Neves (FMUL)
Professora Doutora Rita Maria Pulido Garcia Zilhão (FCUL)
MESTRADO EM BIOLOGIA MOLECULAR E GENÉTICA
AGRADECIMENTOS
Em primeiro lugar, agradeço à professora Hélia, pela oportunidade que me deu de fazer parte do seu grupo. Pela sua orientação, dedicação, preocupação e por toda a confiança que depositou em mim e no meu trabalho, desde o primeiro dia. Por nunca ter levado a mal alguma irreverência que sei ser-me muito própria mas, acima de tudo, agradeço a sua enormíssima compreensão, e por ter sempre percebido o que eu precisava quando me faltavam palavras para fazer pedidos.
Em segundo lugar, agradeço à professora Rita, por me ter dado a conhecer este grupo extraordinário. Por todos os seus conselhos e palavras, e pelo entusiasmo diário com que partilha os seus conhecimentos. Por ser um exemplo a seguir.
A toda a Unidade de Biologia da Hematopoiese do Instituto de Histologia e Biologia do Desenvolvimento da FMUL. Em particular, à Sofia, por ter feito isto comigo. Pela sua companhia e boa disposição, e por ter tornado mais fácil a minha integração não-solitária. Ao Vítor, que considero uma peça fundamental, por toda a ajuda na integração inicial e disponibilidade total. Ao Pedro, pela sua companhia diária, e à Margarida e à Carlota, que tornavam o nosso espaço mais preenchido e, consequentemente, mais alegre. À professora Isabel pela sua constante simpatia e preocupação.
De entre todos os que durante este ano demonstraram o seu interesse e preocupação com o meu trabalho tenho, inevitavelmente, alguns agradecimentos especiais a fazer.
À ELITE, pelas recorrentes combinações de sextas à noite e por me terem arrastado com eles para uns dias de férias. Acima de tudo, por valorizarem os anos de amizade e pelo esforço que cada um faz para a manter.
Aos Fofinhos, onde incluo a Filipa, pelas inúmeras tardes de esforço conjunto. Pela boa companhia e sentido de humor, que tornaram todos esses dias intermináveis em momentos de diversão e descontração. Por termos feito um percurso diferente mas sempre lado-a-lado, ao mesmo nível, o que constitui para mim um motivo de enorme orgulho.
À Lili, Teresa, Andreia e Luísa pelos anos de amizade. Por me terem sempre feito sentir como sendo parte do grupo, mesmo sem eu saber como lá fui parar. Pelos mesmos motivos, um obrigada especial à Marta Reis, por me deixar raptá-la quando preciso de apanhar ar. Por me ouvir sem questionar, e por todos os conselhos e ajudas imprescindíveis (podes começar a tratar do teleponto). À Carolina e à Bia, pela amizade e companhia durante todo o último ano, pelas conversas, pelos conselhos e por me ouvirem.
A toda a equipa de Voleibol da FCUL, sem excepção. Pela quantidade e qualidade de momentos passados nos últimos 5 anos, e por contribuírem semanalmente para a
manutenção da minha sanidade mental. Acredito que me ajudaram a crescer enquanto pessoa e que sem isso não teria sido capaz de estar hoje onde estou.
À Leonor e à Renata, por serem a prova de que a distância nem sempre altera a forma como vemos as pessoas. Por estarem sempre presentes quando é preciso e pela amizade, apoio e ajuda fundamentais ao longo dos últimos anos. Pelas mesmas razões, agradeço ao Francisco, que mesmo longe disponibilizou prontamente o seu tempo para me ajudar a resolver questões relacionadas com este trabalho. É sem surpresa mas com orgulho que olho para o seu percurso e o vejo como um exemplo.
À Rita, que por ser tão parecida comigo em tanta coisa, me compreende. Pela companhia durante o primeiro ano de mestrado, que teria sido (ainda mais) desesperante se não tivesse havido a partilha de espírito crítico que ainda hoje mantemos. Pelo seu sentido de humor e pela sua excelência, e por muitas vezes acreditar mais em mim do que eu própria, obrigando-me a ser sempre melhor. Acima de tudo, pela sua preocupação e dedicação em manter-se em contacto apesar da distância, e pela confiança que tem nas minhas capacidades.
Ao Diogo, pela amizade de anos. Pelo apoio incondicional em todas as etapas da minha vida e por fazer parte de todas elas. Pela sua genialidade e criatividade que todos os dias me fascinam e por corresponder sempre às expectativas. É com orgulho que vejo a pessoa em que se tornou, especialmente por todas as dificuldades que encontrou e continua a encontrar no caminho. Por fazer dos meus sonhos os sonhos dele e fazer de tudo para os realizar.
Ao Pedro, por tudo o que me ensinou na vida, muitas vezes apenas pelo seu discurso introspectivo. Pela partilha de todas as suas fantásticas experiências e por ironicamente ter sido a minha companhia nos momentos mais difíceis.
À minha família, pela confiança ilimitada nas minhas capacidades e pelo suporte financeiro e moral de 22 anos de vida. Em especial, ao meu irmão, pela sua preocupação e por todas as suas tentativas de perceber o que eu faço ou estudo.
Por último, mas em destaque, um especial e inevitável agradecimento à Marta, a quem me vão faltar palavras para agradecer tudo o que devo. Por ser garantidamente uma das pessoas mais extraordinárias e completas que conheço. O seu apoio, preocupação e palavras foram de uma importância incalculável durantes os vários momentos menos bons que passei este ano. Pela capacidade infinita que tem de gerar boa disposição à sua volta. Por partilhar todo o seu conhecimento de uma forma tão simples. Por fazer sempre tudo bem. Sem ela este trabalho não teria sido possível.
i
RESUMO
O timo é um órgão essencial do sistema imunitário, cuja função é gerar linfócitos T auto-restritos e auto-tolerantes que entram em circulação, onde actuam como parte da resposta imune adaptativa. Histologicamente, o timo encontra-se dividido em duas regiões - o córtex e a medula - que se caracterizam pela presença de diferentes Células Epiteliais Tímicas (CETs): corticais (cCETs) ou medulares (mCETs), respectivamente. A função do timo na diferenciação e maturação de linfócitos T é indissociável da função especializada destes dois tipos celulares, assim como da própria arquitectura do órgão.
Anatomicamente próximas do timo mas com uma função absolutamente distinta, as glândulas paratiróides são responsáveis pela regulação da homeostase do cálcio extracelular. Quando os seus receptores detectam alterações nos níveis de cálcio no sangue, as células epiteliais sintetizam e secretam a hormona paratiróide que actua em diferentes alvos de forma a permitir o restabelecimento homeostático.
Apesar das diferenças funcionais e estruturais, o desenvolvimento destes dois órgãos está intimamente ligado, uma vez que os seus epitélios partilham a mesma origem embrionária – a endoderme da 3ª e 4ª bolsas faríngicas (3/4 BF, em galinha). Os rudimentos do timo e das glândulas paratiróides encontram-se assim identificados pela expressão regionalizada dos marcadores moleculares Foxn1 (Forkhead box N1) e Gcm2 (Glial cells missing-2) na endoderme da 3/4 BF, respectivamente.
A origem endodérmica das CETs, assim como a importância das interacções epitélio-mesenquimais na sua especificação, foram primariamente evidenciadas por Le Douarin e Jotereau, utilizando o modelo de quimeras galinha-codorniz. A capacidade de distintos mesênquimas ectópicos suportarem (mesênquima permissivo da somatopleura) ou não (mesênquima não permissivo do botão do membro) o desenvolvimento da endoderme da 3/4 BF na formação de um timo funcional, revela a importância destas interacções na especificação das CETs. Para além disso, um estudo recente identificou dois factores de transcrição, Bmp4 e Fgf10, cuja expressão sequencial na endoderme e no mesênquima é fundamental para especificação da endoderme da 3/4 BF nos epitélios do timo e das glândulas paratiróides.
A sinalização Notch é uma via de sinalização celular que regula aspectos como a proliferação, destino, sobrevivência e diferenciação celular no desenvolvimento embrionário e no adulto. A sua importância no normal funcionamento do sistema imunitário, nomeadamente na hematopoiese e linfopoiese, é bem conhecida. De facto, foi demonstrado que a geração das primeiras células estaminais hematopoiéticas assim como a especificação dos progenitores hematopoiéticos nas diferentes linhagens linfoides são
ii acontecimentos dependentes da sinalização Notch. Adicionalmente, a expressão de genes ligados à sinalização Notch em diferentes territórios do timo adulto e a observação do seu envolvimento na diferenciação de linfócitos mas também na diferenciação dos dois tipos de CETs, sugere o envolvimento desta sinalização na organogénese tardia do timo. Existem, no entanto, poucas evidências da sua função nos estadios iniciais da organogénese do timo. Recentemente, o nosso grupo de investigação observou a expressão de genes envolvidos na sinalização Notch, nomeadamente ligandos, receptores e genes-alvo, nos territórios presuntivos do timo e das glândulas paratiróides. Adicionando a conhecida importância desta sinalização no desenvolvimento e função do timo adulto, estas evidências apontam para um papel relevante da sinalização Notch também na fase inicial do desenvolvimento destes dois órgãos.
Neste projecto pretendeu-se estudar o papel da sinalização Notch durante os estadios iniciais de desenvolvimento do timo e das glândulas paratiróides, utilizando para isso os modelos de galinha e codorniz. De forma a manipular a sinalização Notch nos territórios presuntivos do timo e das paratiróides foram desenvolvidos dois sistemas organotípicos in
vitro: explantes da região faríngica de embriões de codorniz com 3 dias de desenvolvimento;
e associações heteroespecíficas da endoderme da 3/4 BF com mesênquima ectópico permissivo da somatopleura (previamente desenvolvido no laboratório, Neves et al, 2012).
No primeiro sistema, a estrutura tridimensional da região faríngica é mantida intacta, preservando o contacto da endoderme da 3/4 BF com os tecidos envolventes (mesênquima e ectoderme). Para testar o efeito da inibição farmacológica da sinalização Notch nos estadios iniciais de desenvolvimento do timo e das glândulas paratiróides, os explantes da região faríngica foram mantidos em contacto com dois tipos de inibidores da -secretase (cuja função é necessária para a normal sinalização): DAPT e LY411575. A capacidade de inibição da sinalização Notch e o seu efeito na formação do timo e das glândulas paratiróides foram avaliados pela expressão de Hes5.1, Foxn1 e Gcm2, respectivamente, por PCR quantitativo em tempo real (qRT-PCR). Os nossos dados indicam que a inibição da sinalização Notch tende a diminuir a expressão de Foxn1 e Gcm2, sugerindo que o desenvolvimento dos dois órgãos se encontra comprometido na ausência de sinais Notch.
O segundo sistema consiste na associação heteroespecífica de endoderme da 3/4 BF de codorniz com mesênquima permissivo da somatopleura de galinha. Esta abordagem permite a manipulação da sinalização Notch especificamente nos territórios presuntivos do timo e das glândulas paratiróides e sua posterior associação a um mesênquima ectópico, necessário para o seu desenvolvimento. Para validar o sistema anterior de inibição da sinalização Notch nos explantes da região faríngica, esta associação de tecidos foi igualmente sujeita a inibição farmacológica da sinalização Notch, como descrito
iii anteriormente. Uma vez mais, os resultados indicam que a ausência de sinais Notch compromete a normal organogénese do timo e das glândulas paratiróides.
Para modificar a sinalização Notch de forma estável e a nível celular na endoderme da 3/4 BF, foi usado um sistema de vectores que combina a “transferência génica mediada por
Tol2” e a “expressão condicional dependente de tetraciclina”. Assim, a endoderme da 3/4 BF
foi geneticamente modificada de forma a promover um ganho ou perda de função da sinalização Notch. Para ganho de função, a endoderme da 3/4 BF foi electroporada com um conjunto de vectores que induzem a expressão da forma intracelular do receptor Notch1 (ICN1), que se sabe activar a sinalização Notch de forma constitutiva e independente da ligação a um ligando. Para perda de função, o mesmo sistema foi utilizado, mas forçando a expressão de uma forma dominante-negativa do co-activador Mastermind-like1 (DNMAML1). Neste contexto, foi construído neste trabalho um novo vector para perda de função com o objectivo de aumentar a estabilidade da proteína DNMAML1 (que tem apenas 205 pares de bases) e de a direcionar para o núcleo por adição de uma sequência com um sinal de localização nuclear, aumentando a sua eficiência. Estas abordagens permitiram testar o efeito da modulação do sinal Notch durante as interacções epitélio-mesenquimais necessárias para a formação dos dois órgãos em estudo, pela avaliação dos níveis de expressão de Foxn1 e Gcm2. Inesperadamente, os resultados de perda e ganho de função mostram uma tendência de fenótipo semelhante, com a descida da expressão de Foxn1 e o aumento da expressão de Gcm2, em ambos os casos. Estes dados demonstram que a perda de função da sinalização Notch especificamente no domínio presuntivo do timo e das glândulas paratiróides tem um efeito diferente do obtido quando toda a região faríngica é sujeita a inibição. Ficam no entanto por aferir as condições deste sistema para ganho de função da sinalização Notch.
Palavras-chave: sinalização Notch; organogénese; timo; glândulas paratiróides; qRT-PCR;
iv
ABSTRACT
The thymus is the organ responsible for the differentiation and maturation of Lymphoid Progenitor Cells into T lymphocytes, while the parathyroid glands have a key role in the regulation of the extracellular calcium homeostasis by the production of the parathyroid hormone. Despite their functional differences, the epithelia of these organs derive from the endoderm of the 3rd and 4th pharyngeal pouches (3/4 PP), in avian.
Notch signaling has been implicated in several aspects of organogenesis, inclusively having a function during the late stages of thymus development. A recent observation from our group showed Notch-related genes expression in the 3/4 PP endoderm and surrounding mesenchyme suggesting a role for Notch signaling in the thymic and parathyroid glands early-organogenesis.
In this study, we investigated Notch signaling effects in avian thymus and parathyroid glands early-organogenesis. For that, we modulated Notch signals in their prospective territories, prior to organ formation. In a first assay, explants of the pharyngeal region of E3 quail embryos were grown in the presence of Notch signaling inhibitors (DAPT or LY411575). After 48h of culture, the expression Hes5.1 (Notch-target gene), Foxn1 (marker for thymus epithelium) and Gcm2 (marker for parathyroid glands epithelium) was evaluated by qRT-PCR. The results showed that the pharmacological inhibition of Notch signaling promoted a decrease of Foxn1 and Gcm2 expression, suggesting that blocking Notch signaling impairs normal early stages of thymus and parathyroid glands development. Moreover, studies were performed to modulate Notch signaling (gain- and loss-of-function) specifically in the prospective territories of the thymus and parathyroid glands (3/4 PP). In this context, I developed a new loss-of-function construct (pT2K-NLS-Cherry-DNMAML1-eGFP). Both in gain- or loss-of-function experiments, the expression of Foxn1 was down-regulated and the expression of Gcm2 was up-regulated. This conflicting data will be subject to further study.
v
TABLE OF CONTENTS
RESUMO ________________________________________________________________ i
ABSTRACT ______________________________________________________________ iv
TABLE OF CONTENTS ______________________________________________________ v
LIST OF FIGURES _________________________________________________________ vii
LIST OF TABLES __________________________________________________________ ix
LIST OF ABBREVIATIONS ___________________________________________________ x
1. INTRODUCTION ________________________________________________________ 1
1.1. The morphology and function of the thymus ___________________________________ 1 1.2. The morphology and function of the parathyroid glands __________________________ 1 1.3. The organogenesis of the thymus and parathyroid glands_________________________ 2 1.4. Notch signaling ___________________________________________________________ 5 1.5. Notch signaling in thymus and parathyroid organogenesis ________________________ 6 1.6. Objectives _______________________________________________________________ 6
2. EXPERIMENTAL DESIGN TO MODIFY NOTCH SIGNALING ________________________ 7
2.1. Pharmacological Notch signaling inhibition ____________________________________ 7 2.2. Genetic modification with gain- and loss-of-function of Notch signaling _____________ 8 2.3. Materials and methods ____________________________________________________ 9 2.3.1 Chemically competent cells preparation ________________________________________ 9 2.3.2 Transformation ____________________________________________________________ 9 2.3.3 Cell growth, plasmid purification and cell banks __________________________________ 9 2.3.4 Generation of pT2K-NLS-Cherry-DNMAML1eGFP ________________________________ 10 2.3.5 Avian Embryos ___________________________________________________________ 13 2.3.6 Organotypic assay of explants of the pharyngeal region ___________________________ 13 2.3.7 Organotypic assay of heterospecific association of tissues _________________________ 14 2.3.8 RNA isolation and Reverse Transcription _______________________________________ 15 2.3.9 Quantitative Real-Time PCR _________________________________________________ 16 2.3.10 Agarose gel electrophoresis _________________________________________________ 16
vi
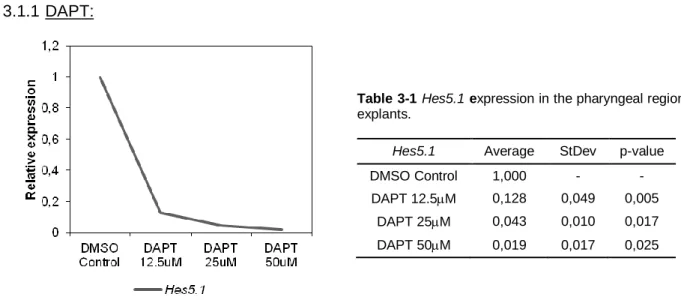
3.1. Pharmacological inhibition of Notch signaling in pharyngeal region explants. ________ 17 3.1.1 DAPT: __________________________________________________________________ 18 3.1.2 LY411575: _______________________________________________________________ 19
3.2. Pharmacological inhibition of Notch signaling in heterospecific association of tissues _ 20 3.3. Modulation of Notch signaling in the prospective domains of the thymus and parathyroid glands (3/4 PP endoderm) _______________________________________________________ 22
3.3.1 Production of pT2K-NLS-Cherry-DNMAML1 _____________________________________ 22 3.3.2 Establishment of electroporation of the 3/4 PP endoderm conditions ________________ 23 3.3.3 Loss-of-function of Notch signaling by genetic modification of the 3/4PP endoderm ____ 24 3.3.4 Gain-of-function of Notch signaling by genetic modification of the 3/4PP endoderm ____ 26
4. DISCUSSION __________________________________________________________ 27
4.1. In vitro development of the thymic and parathyroid rudiments (3/4 PP endoderm) ___ 28 4.2. Pharmacological inhibition of Notch signaling impairs early-development of thymus and parathyroid glands. _____________________________________________________________ 28
4.3. Genetic modification of the prospective domains of the thymus and parathyroid glands (3/4 PP endoderm) with gain-and loss-of-function of Notch ____________________________ 29
5. REFERENCES __________________________________________________________ 30
6. APPENDIX ____________________________________________________________ 36
vii
LIST OF FIGURES
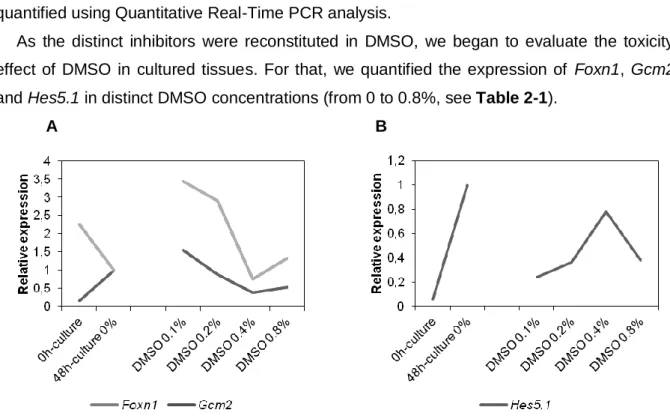
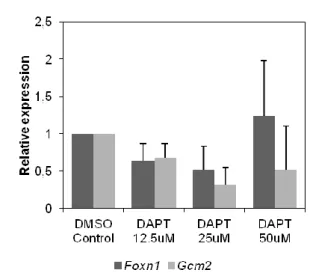
Figure 1-1 The pharyngeal apparatus. A side view of the PA pairs of a HH16 chick embryo (A). A longitudinal section through the PA highlighting the contribution of the three embryonic tissue layers (ectoderm, mesoderm and endoderm) (B). Arrows indicate the PP (1st to the 4th PP); A, Anterior; P, Posterior. Adapted from Lindsay, 2001. ________________________________________________ 3 Figure 1-2 Expression of Gcm2 and Foxn1 during parathyroid glands and thymus development in E4.5 chick embryos. In situ hybridisation and corresponding schemes of Gcm2 (A, B) and Foxn1 (C, D) expression in 3/4 PP endoderm. A, Anterior; D, Dorsal; PP, Pharyngeal Pouch; P, Posterior; V, Ventral. Adapted from Neves et al., 2012. ______________________________________________ 4 Figure 1-3 Schematic representation of Notch signaling pathway in birds. Serrate or Delta ligands bind to the Notch receptor, leading to the proteolytic cleavag -secretase. ICN enters the nucleus, binds to co-activators such as MAML1, and activates the transcription of Notch target genes (Hairy, Hes5.1 and Hes6.1). _______________________________________________ 5 Figure 2-1 Schematic representation of the Tol2-mediated gene transfer technique and Doxycycline-dependent switch-on/off of gene expression. Transient activity of transposase (pCAGGS-T2TP) induces the integration in the host genome of either transactivator (pT2K-CAGGS-tTA) or TREeGFP (pT2K-BI-TREeGFP). In the absence of doxycycline, the product of the gene tTA (transactivator) activates the transcription of the TRE-driven genes: gene of interest (GOI) or EGFP. Adapted from Sato et al., 2007. _______________________________________________________ 8 Figure 2-2 Schematic representation of the in vitro culture of the pharyngeal region explants. Region of the pharynx dissected at E3 quail embryo (A). Ventral view of the dissected pharyngeal region (B). Pharyngeal explants are grown in the presence (experimental condition) or absence (control condition) of the pharmacological inhibitors of Notch signaling. Note the PP endoderm in contact with the culture medium (C). A, Anterior; D, Dorsal; PA, Pharyngeal Arch; PP, Pharyngeal Pouch; P, Posterior; V, Ventral. ______________________________________________________ 14 Figure 3-1 Relative expression of Foxn1 and Gcm2 (A), and Hes5.1 (B) at 0h (E3), and after 48h of culture in the distinct DMSO concentrations (from 0% to 0.8%). 0h-culture, n=3; 48h-culture, n=2; all DMSO samples, n=5. _____________________________________________________________ 17 Figure 3-2 Relative expression of Hes5.1 in the pharyngeal region explants grown at increased concentrations of DAPT. 5 samples for each culture conditions. ____________________________ 18 Figure 3-3 Relative expression of Foxn1 and Gcm2 in the pharyngeal region explants grown with increasing concentrations of DAPT. 5 samples for each culture conditions. ___________________ 19 Figure 3-4 Relative expression of Hes5.1 in the pharyngeal region explants grown at increased concentrations of LY411575 (LY). 5 samples for each culture conditions. _____________________ 19 Figure 3-5 Relative expression of Foxn1 and Gcm2 in the pharyngeal region explants grown with increasing concentrations of LY411575 (LY). 5 samples for each culture conditions. ____________ 20
viii
Figure 3-6 Relative expression of Foxn1, Gcm2 and Hes5.1 in freshly isolated quail 3/4 PP endoderm (E3) and after 48h of culture in control culture medium (RPMI-1640 supplemented with 10% FBS, 1x Pen/Strep). 0h-culture, n=3; 48h-culture, n=2. __________________________________________ 20 Figure 3-7 Relative expression of Hes5.1 in heterospecific association of tissues grown in the
___________________________ 21 Figure 3-8 Relative expression of Foxn1 and Gcm2 in the heterospecific association tissues grown in
________________________ 21 Figure 3-9 1.3% Agarose gel electrophoresis showing the steps involved on the generation of pT2K-NLS-Cherry-DNMAML1eGFP. PCR amplification of DNMAML1 (A). PCR amplification of CherryNLS (B). TOPO-DNMAML1 digested with EcoRV/NheI (C). TOPO-CherryNLS digested with EcoRV (D). pT2K-BI-TREeGFP linearized with EcoRV (E). pT2K-DNMAML1eGFP digested with EcoRV/NheI (F). pT2K-DNMAML1eGFP linearized with EcoRV (G). pT2K-NLS-Cherry-DNMAML1eGFP digested with EcoRV (H). Confirmation of CherryNLS insert orientation on the final plasmid by digestion with PvuII (I). L1, O'GeneRuler™ 1 kb DNA Ladder; L2, FastRuler™ Middle Range DNA Ladder. Arrowhead indicates the DNA band corresponding to the CherryNLS sequence in pT2K-NLS-Cherry-DNMAML1eGFP.__________________________________________________ 22 Figure 3-10 Relative expression of Foxn1, Gcm2 and Hes5.1 in the heterospecific association of tissues after 48h of culture. Two control conditions of electroporation were evaluated: endoderm electroporated with PBS without vectors and with the control vector, the pT2K-BI-TREeGFP. PBS w/o vectors, n=5; pT2K-BI-TREeGFP, n=3. ________________________________________________ 24 Figure 3-11 Expression of DNMAML1 and GFP in the heterospecific association of tissues after 48h of culture. Endoderm was electroporated with the control vector (BI-TREeGFP), pT2K-DNMAML1eGFP (DNMAML1 samples) or pT2K-NLS-Cherry-pT2K-DNMAML1eGFP (NLS-DNMAML1 samples). _______________________________________________________________________ 25 Figure 3-12 Relative expression of Foxn1, Gcm2 (A) and Hes5.1 (B) of the heterospecific association of tissues grown for 48h in culture. Endoderm was electroporated with the control vector (pT2K-BI-TREeGFP), pT2K-DNMAML1eGFP or pT2K-NLS-Cherry-DNMAML1eGFP. __________________ 25 Figure 3-13 Expression of ICN1 and GFP in the heterospecific association of tissues after 48h of culture. Endoderm was electroporated with the control vector (BI-TREeGFP) or pT2K-ICN1eGFP (ICN1 samples). ________________________________________________________ 26 Figure 3-14 Relative expression of Foxn1, Gcm2 (A) and Hes5.1 (B) of the heterospecific association of tissues grown for 48h in culture. Endoderm was electroporated with the control vector (pT2K-BI-TREeGFP) or pT2K-ICN1eGFP. _____________________________________________________ 27
ix
LIST OF TABLES
Table 2-1 DMSO concentrations used to perform the dose-response curve and the respective inhibitors (DAPT and LY411575) concentrations. ________________________________________ 13 Table 3-1 Hes5.1 expression in the pharyngeal region explants. ____________________________ 18 Table 3-2 Foxn1 (A) and Gcm2 (B) expression in the pharyngeal region explants. _____________ 19 Table 3-3 Hes5.1 expression in the pharyngeal region explants ____________________________ 19 Table 3-4 Foxn1 (A) and Gcm2 (B) expression in the pharyngeal region explants. _____________ 20 Table 3-5 Hes5.1 expression in the heterospecific association of tissues. ____________________ 21 Table 3-6 Foxn1 (A) and Gcm2 (B) expression in the heterospecific association of tissues. ______ 21 Table 3-7 Foxn1 (A), Gcm2 (B) and Hes5.1 (C) expression in the heterospecific association of tissues. _________________________________________________________________________ 24 Table 6-1 Sequence of primers used in qRT-PCR assays and the respective product size and annealing temperature. ____________________________________________________________ 36 Table 6-2 qRT-PCR primers for each evaluate gene and the respective sample used for calibration curves performing. ________________________________________________________________ 36 Table 6-3 Foxn1 (A), Gcm2 (B) and Hes5.1 (C) expression in the heterospecific association of tissues electroporated with the control vector (pT2K-BI-TREeGFP), pT2K-DNMAML1eGFP or pT2K-NLS-Cherry-DNMAML1eGFP. ___________________________________________________________ 37 Table 6-4 Foxn1 (A), Gcm2 (B) and Hes5.1 (C) expression in the heterospecific association of tissues electroporated with the control vector (pT2K-BI-TREeGFP) or pT2K-ICN1eGFP. _______________ 37 Table 6-5 Buffers composition for multiple uses: TAE 1X (A) and PBS 1x (B). ______________ 38 Table 6-6 Bacterial growh media: LB medium (A) and LB agar (B) ________________________ 38
x
LIST OF ABBREVIATIONS
aa amino acid
bp base pairs
cDNA complementary Deoxyribonucleic Acid
DAPT N-[N-(3,5-Difluorophenacetyl-L-alanyl)]-S-phenylglycine t-Butyl Ester
DMSO Dimethyl sulfoxide
DN Dominant Negative
DNA Deoxyribonucleic Acid
dNTP Deoxynucleotide triphosphate
Dox Doxycycline
DTT Dithiothreitol
E Embryonic day of development
F Farad
FBS Fetal Bovine Serum
GAPDH Glyceraldehyde-3-Phosphate Dehydrogenase
GFP Green Fluorescence Protein
h, min, sec hour, minute, second
ICN Intracellular domain of Notch
LB Lysogeny Broth
LPC Lymphoid Progenitor Cell
NC Neural Crest
NLS Nuclear Localisation Signal
PA Pharyngeal Arch
PBS Phosphate Buffered Saline
Pen/Strep Penicillin/Streptomycin
PP Pharyngeal Pouch
PTH Parathyroid Hormone
qRT-PCR Quantitative Real-Time Polymerase Chain Reaction
RNA Ribonucleic Acid
rpm Revolutions per minute
RT Room Temperature
StDev Standard-deviation
TEC Thymic Epithelial Cell
UV Ultraviolet
V Volts
1
1. INTRODUCTION
1.1. The morphology and function of the thymus
The thymus is a primary lymphoid organ responsible for the differentiation of Lymphoid Progenitor Cells (LPCs) into T lymphocytes, a key cellular component of the adaptive immune response. T cell development begins when the LPCs enter the thymus and it is characterized by the thymocyte (developing T lymphocyte) progression through several phenotypically distinct stages (Blackburn and Manley, 2004).
Surrounded by a mesenchymal capsule, the thymus is divided into two main histologically distinct regions - the cortex and the medulla, characterized by the presence of different subsets of stromal cells, the cortical (c) and medullary (m) Thymic Epithelial Cells (TECs). Thymocytes are more than 95% of the cells in the thymus, and their differentiation is intimately dependent on their interaction with cTECs and mTECs as well as mesenchymal cells, endothelial cells, dendritic cells and macrophages, in which complex signals drive the commitment and differentiation into the T cell lineage (Gordon and Manley, 2011). After entering the thymus at the cortico-medullary junction, the LPCs travel throughout the thymic cortex, where cTECs drive their commitment, proliferation and rearrangement and expression of T cell receptors (TCRs). Thymocytes with the ability to recognize self-antigens expressed by cTECs undergo positive selection, receiving survival and maturation signals, and traveling into the medulla. Once in the medulla, thymocytes that react to tissue-restricted self-antigens expressed by mTECs are negatively selected, giving rise to only self-restricted and self-tolerant mature T lymphocytes that enter the circulation (Palmer, 2003; Ladi et al., 2006; Ge and Zhao, 2013).
In mammals and birds, the thymus starts to involute early in the development (6 weeks after birth in mice, 1 year in human and 3rd/4th month after birth in chicken), affecting both T cell production and thymic microenvironment maintenance resulting in a decrease in functional thymic volume (Dorshkind et al., 2009; Shanley et al., 2009; Tarek et al., 2012). It is therefore crucial the correct patterning and organization of thymic stromal components for an efficient thymic function. Defects in thymus structure and function normally generate problems such as immunodeficiency and autoimmunity, urging the importance of unrevealing the developmental processes underlying thymic organogenesis (Nowell et al., 2007).
1.2. The morphology and function of the parathyroid glands
The parathyroid glands play a key role in the regulation of extracellular calcium homeostasis, which is important to many physiological processes such as muscle contraction, blood coagulation and synaptic activity. Through calcium-sensing receptor (CasR), these glands are able to detect changes in the levels of calcium in the blood and
2 produce the parathyroid hormone (PTH). For instance, when low calcium levels are detected in blood, the parathyroid glands produce and secrete PTH that directly targets receptors on osteoblasts to regulate bone resorption. In the kidney, PTH targets distal tubule epithelial cells, increasing renal calcium reabsorption, allowing the increase of calcium in blood (Okabe and Graham, 2004; Liu et al., 2007).
Histologically, parathyroid glands have a thin capsule of collagen I and III (reticular fibers) and few elastic fibers that surround a parenchyma, where the epithelial cells (chief cells) are responsible for the PTH synthesis (Gilmour, 1939). Mutations in genes that act during parathyroid development impair PTH production, causing a disease called hypoparathyroidism (Liu et al., 2007). To better understand the development of this and other parathyroid disorders it is important to comprehend parathyroid glands organogenesis.
Despite their structural and functional differences, the development of the thymus and parathyroid glands is intimately linked – the epithelium of both organs derives from the endoderm of the pharyngeal pouches (PP) (Gordon and Manley, 2011). However, the precise PP embryological origin, the number of organs formed and the final anatomical positions of these organs differ according to the species (Rodewald, 2008). For instance, in mammals, the thymus is a bilobed organ centrally located on the thoracic cavity, above the heart and behind the sternum (Gordon and Manley, 2011), whereas pairs of parathyroid glands are located in the dorsal region of the thyroid gland. In birds, the thymus is subdivided in seven lobes that are bilaterally located along the neck, near the jugular vein. The pair of parathyroid glands is located at the bottom of each thymic cord, under the thyroid glands (Neves et al., 2012).
1.3. The organogenesis of the thymus and parathyroid glands
The epithelia of the thymus and parathyroid glands share the same embryological origin – the endoderm of the PP. The pharyngeal apparatus arises from a series of bulges on the lateral surface of the head of the embryo, the pharyngeal arches (PA), covered on the outside by the ectoderm, and on the inside by the endoderm, having a core of neural crest (NC)-derived mesenchymal cells (Figure 1-1). Five pairs of PA emerge between Theiler’s stages 13 (St13) and St16 in the mouse and Hamburger and Hamilton stages 14 (HH14) and HH19 in the chick. The endoderm of the pharyngeal tube evaginates between the adjacent arches, forming an out-pocketing – the PP, while the external overlying ectoderm depresses forming a pharyngeal cleft (Grevellec and Tucker, 2010; Graham and Richardson, 2012).
3
Figure 1-1 The pharyngeal apparatus. A side view of the PA pairs of a HH16 chick embryo (A). A longitudinal
section through the PA highlighting the contribution of the three embryonic tissue layers (ectoderm, mesoderm and endoderm) (B). Arrows indicate the PP (1st to the 4th PP); A, Anterior; P, Posterior. Adapted from Lindsay, 2001.
In 1975, using the chick-quail chimeras system it was shown that TECs derive from the PP endoderm (Douarin and Jotereau, 1975). Later on it was shown that, in mice, the rudiments of parathyroid glands and thymus emerge from the 3rd PP (3PP) endoderm (Gordon et al., 2001), while in human emerge from the 3rd and 4th PP (3/4 PP) and the 3PP, respectively (Farley et al., 2013). In birds, such as chicken and quail, the rudiments of the two organs derive from the endoderm of the 3/4 PP (Douarin and Jotereau, 1975; Neves et al., 2012).
In mice, the 3PP appears at Embryonic day of development 9.5 (E9.5) and is patterned into organ-specific domains by the regionalized expression of molecular markers. More precisely, the parathyroid domain identity is specifically determined by the expression of
Gcm2 (the mouse homolog of the Drosophila transcription factor Glial Cells Missing), which
is first detected at E9.5 in an anterior/dorsal region. Gcm2 deletion results in the absence of parathyroid glands showing that Gcm2 is essential for the survival and differentiation of these glands (Günther et al., 2000). Conversely, the thymus domain identity is specified by the expression of the transcription factor forkhead box N1 (Foxn1) at E11.25 in a posterior/ventral domain (Patel et al., 2006; Gordon et al., 2001; Gordon and Manley, 2011). Mice deficient for Foxn1 (nude mouse) have a hairless phenotype and are athymic. Furthermore, in nude mouse the LPCs fail to enter the thymic primordium (Itoi et al., 2001) and TECs fail to proliferate and differentiate (Blackburn et al., 1996).
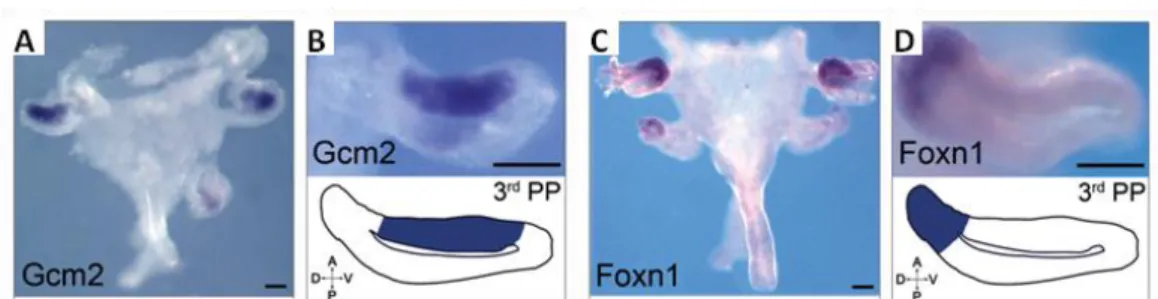
In chicken, the rudiments of the thymus and parathyroid glands are also identified by the distinct domains of Gcm2 and Foxn1 expression in the 3/4 PP, respectively. Gcm2 is detected by RT-PCR from E3 onwards (E2.5 in quail) in a medial/anterior domain of the pouches (Figure 1-2 A and B), while Foxn1 is detected at E4 (E3.5 in quail) and is confined to a dorsal region (Figure 1-2 C and D). These divergent expression domains of the organ-specific markers might explain the different final anatomical positions of the adult thymus in mammals and birds (Neves et al., 2012).
4
Figure 1-2 Expression of Gcm2 and Foxn1 during parathyroid glands and thymus development in E4.5 chick embryos. In situ hybridisation and corresponding schemes of Gcm2 (A, B) and Foxn1 (C, D) expression in
3/4 PP endoderm. A, Anterior; D, Dorsal; PP, Pharyngeal Pouch; P, Posterior; V, Ventral. Adapted from Neves et al., 2012.
The thymus organogenesis occurs in two distinct temporal phases: a thymocyte-independent phase followed by a thymocyte-dependent phase (Rodewald, 2008). In the first one, cellular interactions between the PP endoderm and the surrounding NC-derived mesenchyme drive the specification of TECs. In chick, one report showed that the failure of sufficient quantities of cephalic neural crest cells (cNCCs) to migrate and interact with these developing organs results in ectopic, hypoplastic or absent thymic lobes. Moreover, reduced or absent parathyroids in at least one side of the embryo are also observed (Bockman and Kirby, 1984). Pax3 knockout-mice, with severe NCC deficiency show large thymus and small parathyroid glands rudiments, and these organs fail to detach from the pharynx and from each other (Griffith et al., 2009).
The importance of the epithelial-mesenchymal interactions during thymus organogenesis was first demonstrated in 1967 by Le Douarin using the quail-chick chimera system. Quail endoderm isolated from the 3/4PP was able to develop into functional TECs when associated with a chicken permissive mesenchyme (somatopleura), but not when associated with a non-permissive mesenchyme (limb bud). In fact, permissive ectopic mesenchymal tissues are able to mimic the role played by neighbouring NC-derived mesenchyme in thymus development (N. Le Douarin, 1967). This endoderm-mesenchyme crosstalk was recently explored and it was shown that a specific spatial-temporal expression of BMP and FGF factors is fundamental for endoderm development and specification into TECs (Neves et al., 2012). Additionally, a transcription-factor network involving the expression of Hoxa3 (Manley and Capecchi, 1995), Pax1/9 (Wallin et al., 1996; Peters et al., 1998; Hetzer-Egger et al., 2002), Eya1 and Six1 (Xu et al., 2002) is crucial for normal thymus organogenesis in mouse.
In the later stage of thymus development, the thymocyte-dependent phase, maturation of the thymic epithelium in cTECs and mTECs compartments, is driven by the initial colonization by LPCs, at E6.5 in chicken (Le Douarin and Teillet, 1973; Douarin and Jotereau, 1975) and at E11.5 in mouse (Owen and Ritter, 1969; Fontaine-Perus et al., 1981). This LPCs colonization and further maturation steps of TECs are dependent on the
5 expression of Foxn1 by TECs (Nehls et al., 1996). Several reciprocal signals between thymocytes and immature TECs induce co-differentiation of T lymphocytes and TECs (Alves et al., 2009). In this context, Notch signaling has been subject of study, since both ligands and receptors are co-expressed in the TECs and developing thymocytes (Anderson and Jenkinson, 2001; Parreira et al., 2003).
1.4. Notch signaling
Notch signaling is a fundamental signaling-pathway that mediates cell-cell communication during animal development. It regulates cell proliferation, fate, survival and differentiation in all metazoans (Kopan, 2012; Greenwald and Kovall, 2013), in a dose-, timing- and context-dependent fashion (Maillard et al., 2005). Specifically, it has been implicated in the control of several aspects of organogenesis such as bone development (Watanabe et al., 2003), function and neural development (Hitoshi et al., 2002), angiogenesis (Liu et al., 2003), somitogenesis (Conlon et al., 1995) and haematopoiesis (Jaleco et al., 2001; Parreira et al., 2003; Neves et al., 2006; Alcobia et al., 2011; Laranjeiro et al., 2012).
Notch receptors (Notch1-2 in birds and Notch1-4 in mammals) bind to five different ligands [Delta-like1, 3 and 4, and Serrate1-2 (Jagged1-2 in mammals)] present in the adjacent cells (Bray, 2006), leading to the cleavage and release of the intracellular domain of Notch (ICN) by the -secretase complex (Kopan, 2012). ICN is then translocated into the nucleus where it binds CSL, a transcription factor that mediates most of the well-characterized Notch functions. This binding furthers the recruitment of other transcriptional activators, like the co-activator protein Mastermind-like (MAML), thereby activating the transcription of many downstream target genes, such as the basic helix-loop-helix (bHLH)
Hes genes (Kopan and Ilagan, 2009) (Figure 1-3). Hes genes are the mammalian homologs
of the Drosophila genes Hairy and Enhancer of Split, and function as effectors of Notch signaling. It has been shown their importance as biological clocks, measuring time in development events such as somite segmentation, and in the regulation of binary cell fate decisions in the developing nervous system of mouse embryos (Kageyama et al., 2007).
Figure 1-3 Schematic representation of Notch signaling pathway in birds. Serrate or Delta ligands bind to
the Notch receptor, leading to the proteolytic cleavage of the ICN by -secretase. ICN enters the nucleus, binds to co-activators such as MAML1, and activates the transcription of Notch target genes (Hairy, Hes5.1 and Hes6.1).
6
1.5. Notch signaling in thymus and parathyroid organogenesis
Several evidences point out to important roles of Notch signaling in haematopoiesis and lymphopoiesis. The expression of Notch-related genes in the adult thymus was demonstrated for the first time by Parreira et al. (2003), suggesting the involvement of Notch signaling in thymic function. The generation of the earliest haematopoietic stem cells (Radtke et al., 2010) and the expansion and lineage-differentiation of early-myeloid progenitors (Neves et al., 2006) were shown to be Notch-dependent. In fact, it was shown that Notch ligands Delta1 (Jaleco et al., 2001) and Delta4 (Koch et al., 2008) are responsible for T/B lineage decision and promote the development of the thymocytes into T lymphocytes (Jiang et al., 1998; Jiménez et al., 2001; Fiorini et al., 2009). Recent studies report a role of thymocytes to provide Notch signals to TECs, stressing its importance in the regulation of late thymic organogenesis (Koyanagi et al., 2012). It is known that the lack of Jagged2 has a negative impact in the medullar organization of the thymus (Jiang et al., 1998), and that the presence of Delta1 is necessary for the development of both cTECs and mTECs (Masuda et al., 2009). Additionally, the maintenance of a high proliferative potential of the thymic epithelial stem cells by ΔNp63 (a particular isoform of p63) is dependent on the presence of Jagged2 as a downstream effector (Candi et al., 2007).
Nevertheless, only few recent evidences point to the role of Notch signaling in the early stages of thymus and parathyroid glands organogenesis. In chicken development, the expression of Notch-related genes (receptors, ligands and target genes) in the endoderm of the 3/4 PP and surrounding mesenchyme at E4, provided the first evidence of an active Notch signaling in the prospective thymus and parathyroid domains. Moreover, preliminary data of in vitro inhibition of Notch signaling specifically in the pharyngeal region, showed a blockage or reduction of the Gcm2 expression while Foxn1 expression appears to be randomly affected (Figueiredo, 2011).
In order to understand the very beginning of avian thymus and parathyroid glands organogenesis we aim to study the role of Notch signaling during their early phases of development.
1.6. Objectives
The aim of this project was to unravel the role of Notch signaling during the early stages of the avian thymus and parathyroid glands organogenesis. Two distinct approaches were performed in order to manipulate Notch signaling: pharmacological inhibition and gain- and loss-of-function of Notch signaling by genetic manipulation of tissues. With regard to this, two strategies involving two embryological sources of the prospective domains of the thymus and parathyroid glands (3/4PP endoderm) were used in an organotypic in vitro system:
7 1) Explants of the pharyngeal region of E3 quail embryos. With this strategy, the 3/4 PP endoderm is in close contact and preserve 3D interactions with local tissues (mesenchyme and ectoderm);
2) Heterospecific associations of isolated 3/4 PP endoderm with ectopic permissive mesenchyme (somatopleura) (developed by Neves et al, 2012);
In the first approach (1), the pharyngeal region explants were grown in the presence of two distinct -secretase inhibitors, DAPT and LY411575, to test the effect of Notch signaling inhibition in the tissues involved in epithelial-mesenchymal interactions during early thymic and parathyroid glands organogenesis.
In the second approach (2), heterospecific associations of isolated quail 3/4 PP endoderm with chicken somatopleural mesenchyme were first grown in the presence of DAPT, similar to described above. Secondly, quail 3/4 PP endoderm was genetically modified in a cell-autonomous manner (with gain- and loss-of-function of Notch signaling) and associated in culture with chicken somatopleural mesenchyme. With this approach, we tested the effects of Notch signaling modulation in the prospective domains of the thymus and parathyroid glands during epithelial-mesenchymal interactions at early-stages of organs formation. In this context, a new construct for the loss-of-function experiments (pT2K-NLS-Cherry-DNMAML1eGFP) was generated.
Quantitative Real-Time PCR (qRT-PCR) analysis was performed in both experimental approaches. Notch activity was then evaluated by the expression of the Notch target gene
Hes5.1, and thymus and parathyroid glands formation by Foxn1 and Gcm2 expression,
respectively.
2. EXPERIMENTAL DESIGN TO MODIFY NOTCH SIGNALING 2.1. Pharmacological Notch signaling inhibition
-secretase complex has a key role in the Notch signaling pathway, allowing the cleavage and release of ICN and its import into the nucleus. By inhibiting -secretase activity, we were able to block Notch signaling and evaluate the effects in the early stages of the avian thymus and parathyroid glands organogenesis. Two cell permeable -secretase pharmacological inhibitors were used: DAPT (N-S-phenyl-glycine-t-butyl ester; Dovey et al., 2001) and LY411575 (a DAPT analogue; Fauq et al., 2007). LY411575 is structurally similar to DAPT, but 100-fold more potent.
8
2.2. Genetic modification with gain- and loss-of-function of Notch signaling
It is known that cells forced to express the intracellular domain of Notch1 (ICN1) have a constitutive activation of Notch signaling in a ligand-independent manner (Weinmaster, 1997). Conversely, cells forced to express a dominant-negative (DN) form of the co-activator Mastermind-like1 (DNMAML1), consisting only in the N-terminal binding domain, block Notch signaling probably due to an inability of this truncated protein to recruit other proteins of the Notch transcriptional activation complex (Maillard et al., 2004).
To genetically modify Notch signaling in avian tissues we used a system of vectors combining a Tol2-mediated gene transfer technique and a Tetracycline-dependent conditional gene expression (Sato et al., 2007; Watanabe et al., 2007) (Figure 2-1). The system of vectors comprises three different plasmids: pT2K-CAGGS-tTA, constitutively expressing a tetracycline-controlled transcriptional activator (tTA); pT2K-BI-TREeGFP, a plasmid containing a cassette in which two different genes can be bidirectionally transcribed under the control of a tetracycline-responsive element (TRE), and pCAGGS-T2TP, a transposase that allows the stable integration of the two former plasmids. Upon integration in the host genome, and in the absence of Doxycycline (Dox) (a tetracycline analogue), tTA gene product will bind to the promoter cis-element TRE, activating the TRE-driven genes. By adding Dox to the culture medium, tTA is released from TRE, shutting off the expression of the TRE-driven genes (Tet-off expression system). ICN1 and DNMAML1 sequences were previously cloned in BI-TREeGFP generating ICN1eGFP and pT2K-DNMAML1eGFP (Figueiredo, 2011), respectively. A new construct with DNMAML1 fused to
CherryNLS sequence, pT2K-NLS-Cherry-DNMAML1eGFP, was generated to improve
protein stability and nuclear translocation of DNMAML1:
Figure 2-1 Schematic representation of the Tol2-mediated gene transfer technique and Doxycycline-dependent switch-on/off of gene expression. Transient activity of transposase (pCAGGS-T2TP) induces the
integration in the host genome of either transactivator (pT2K-CAGGS-tTA) or TREeGFP (pT2K-BI-TREeGFP). In the absence of doxycycline, the product of the gene tTA (transactivator) activates the transcription of the TRE-driven genes: gene of interest (GOI) or EGFP. Adapted from Sato et al., 2007.
9
2.3. Materials and methods
2.3.1 Chemically competent cells preparation
Since E. coli cells are not naturally competent, they need to undergo a process that make them able to uptake exogenous DNA. Non-competent cells of the DH5α strain were inoculated in LB plates and grown overnight at 37ºC. One single colony was selected, inoculated in 3mL of LB medium and left overnight in a 37ºC shaker (220rpm). 2mL of this grown culture were added to 200mL of LB medium and incubated for 3h under the same conditions until OD600=0.4-0.6. From then on, all steps were performed on ice, refrigerated
centrifuges and using cold solutions. Cells were initially centrifuged at 4000rpm for 5min at 4ºC and the supernatant was discarded. Half of the initial bacterial culture volume of MgCl2
0.1M was added, cells were again centrifuged and supernatant removed. Half of the initial bacterial culture volume of CaCl2 0.1M was then added and cells were incubated on ice for
30min. After another centrifugation, supernatant was discarded and cells were carefully resuspended in CaCl2 0.1M/15% Glycerol to 1/15 of the initial volume. The final cell
suspension was aliquoted in 500µL sterile cryovials and stored at -80ºC. 2.3.2 Transformation
All the E. coli DH5α transformations were performed by adding 100-500ng of plasmid DNA to 200µL of competent cells. After gently mixing, the mixture stayed on ince for 30min. A heat shock was performed for 1min at 42ºC, followed by 2min of incubation on ice. 600µL of LB medium was added to the cells and incubation in a 37ºC shaker (220rpm) for 1h enabled the expression of the ampicillin resistance gene (bla). After that, cells were centrifuged at 5000g for 3min. 650µL of the supernatant were discarded and cells were resuspended on the remaining 150µL. Finally, the 150µL of cells were plated on LB Agar supplemented with ampicillin (100µg/mL) (Sigma) and incubated overnight at 37ºC.
2.3.3 Cell growth, plasmid purification and cell banks
Single colonies of DH5α transformed with each plasmid were collected and added to 5mL of LB medium supplemented with 5µL of ampicillin (100µg/mL) in a 50mL. For small scale plasmid extraction, cells were grown overnight in a 37ºC shaker (220rpm). The purification of plasmid DNA was carried out using QIAprep®Spin Miniprep Kit (QIAGEN) according to the recommended protocol. For midi-preparation of plasmid DNA, cells were incubated for 7-8h (37ºC, 220rpm). Then, 1mL of this pre-culture was added to 50 or 100mL (high- or low-copy plasmids, respectively) of LB medium supplemented with ampicillin (100µg/mL) in a 250 or 500mL erlenmeyer. Cultures were left to grow overnight at 37ºC at 220rpm. The plasmid DNA purification was performed using QIAfilter Plasmid Midi Kit (QIAGEN) according to the manufacturer’s instructions. DNA concentration and purity were determined using
10 NanoDrop® ND1000 Spectrophotometer (Thermo Scientific) and samples were stored at -20ºC.
For each new plasmid, a working cell bank was always performed by adding 150µL of the pre-culture to 850µL of glycerol 100% in a sterile 2mL eppendorf and storing at -80ºC.
2.3.4 Generation of pT2K-NLS-Cherry-DNMAML1eGFP
To improve protein stability of DNMAML1 and its nuclear translocation we cloned the
DNMAML1 sequence in fusion with the CherryNLS sequence in pT2K-BI-TREeGFP plasmid.
2.3.4.1 PCR amplification
DNMAML1 is the dominant negative form of MAML1 and corresponds only to its 12-74aa (36-224 nucleotides) in Gallus gallus. The nucleotide sequence of DNMAML1 Gallus gallus is shown below (primers location in bold):
MAML1 Gallus gallus ID: XM_414607.2
1 atggtgctgc ccccctgccc catggcccat ttagtggtgc cgcggcacag cgcggtgatg 61 gagcggccct ttcagcgcat cgagctctgc cggcggcacc acagcgcctg cgagtcccgc 121 taccaggccg tgtccccgga gcgcctggag ctggagcgcc agcaaacctt cgccctgcac 181 cagcgctgcc tgcaggccaa ggccaagcgg gccggcaagc accgccagcc gcccccggcc ...
To amplify DNMAML1 and allow its cloning and further expression, a forward primer from a previous work (Figueiredo, 2011), that was modified to introduce a NheI restriction site
(bold) and a KOZAK sequence (underlined), was used:
5´GCTAGCCATGgtggtgccgcggcacagc 3’. The reverse primer was also modified introducing an EcoRV restriction site (bold): 5’GATATCgtgcttgccggcccgcttggc 3’. Inserted sequence is in capital letters.
Cherry is a fluorophore with high photostability and rare fluorescence-intensity fluctuations (Seefeldt et al., 2008) and was used as a tag for DNMAML1 in this work. Cherry carrying a nuclear localization signal (NLS) was cloned in a pCAG plasmid (pCAG-CherryNLS; Vilas-Boas et al., 2011) and its partial nucleotide sequence is shown below (primers location in bold):
1 atggtgagca agggcgagga ggataacatg gccatcatca aggagttcat gcgcttcaag 61 gtgcacatgg agggctccgt gaacggccac gagttcgaga tcgagggcga gggcgagggc 121 cgcccctacg agggcaccca gaccgccaag ctgaaggtga ccaagggtgg ccccctgccc 181 ttcgcctggg acatcctgtc ccctcagttc atgtacggct ccaaggccta cgtgaagcac ...
661 cgcgccgagg gccgccactc caccggcggc atggacgagc tgtaccctcc aaaaaagaag 721 agaaaggtag aagacccctg attgtaca
11 To amplify CherryNLS and allow direct cloning in fusion with DNMAML1 sequence in pT2K-DNMAML1eGFP plasmid, both forward and reverse primers were modified to introduce an EcoRV restriction site (capital and bold letters). The final primers used were:
forward 5’GATATCatggtgagcaagggcgaggag 3’ and reverse
5’GATATCtgtacaatcaggggtcttctacc 3’.
DNMAML1 sequence was amplified from 10ng of TOPO-DNMAML1 vector from a
previous work (Figueiredo, 2011) and CherryNLS from 10ng of pCAG-CherryNLS plasmid, both in a 25µL PCR reaction using PhusionTM Master Mix with HF Buffer (Finnzymes) and 0.5µM final concentration of the primers described above, according to manufacturer’s instructions. The cycling conditions were: 1 cycle of initial denaturation at 98ºC for 30sec; 30 cycles of denaturation at 98ºC for 10sec, annealing at 65ºC for 30sec, and extension at 72ºC for 15sec/Kb (205bp product for DNMAML1 and 761bp product for CherrryNLS); a final extension cycle at 72ºC for 10min. All PCR reactions were performed in a MyCyclerTM Thermal Cycler (Bio-Rad), and PCR products were resolved on a 1.5% agarose gel (see section 2.3.10) and stored at -20ºC.
2.3.4.2 TOPO II PCR Cloning
DNMAML1 and CherryNLS PCR products were cloned in pCR®II-TOPO® vector using TOPO TA Cloning® Kit (Invitrogen) according to the manufacturer’s instructions. In order to add single 3’ adenine overhangs to the PCR products, they were previously incubated at 72ºC for 10min with 0.25µL of Go-Taq Polymerase. TOPO® Cloning reactions were transformed into One Shot® MAX Efficiency® DH5α-T1R Chemically competent E. coli cells (Invitrogen) according to the instructions. Four white colonies of each plasmid were chosen and plasmid DNA was extracted using QIAprep®Spin Miniprep Kit (QIAGEN) as described (see section 2.3.3). The presence of the insert was then confirmed by restriction analysis (see section 2.3.4.3).
2.3.4.3 Restriction analysis
To confirm the presence of DNMAML1 and CherryNLS in each vector, digestions with restriction enzymes were performed. For DNMAML1 we did a double digestion with NheI (New England Biolabs - NEB) and EcoRV (Promega) using Buffer 2 from NEB (10mM Tris-HCl pH7.9, 10mM MgCl2, 50mM NaCl and 1mM DTT). For CherryNLS a single digestion with EcoRV (Promega) using Buffer D from Promega (6mM Tris-HCl pH7.9, 6mM MgCl2, 150mM NaCl and 1mM DTT) was done. These digestions were performed in 4000ng of total plasmid DNA and 20µL final volume and were incubated for 2h30min at 37ºC. Digestion results were analysed by agarose gel electrophoresis (see section 2.3.10).
12 2.3.4.4 Cloning DNMAML1 in pT2K-BI-TREeGFP
2.3.4.4.1 Double digestion with restriction enzymes and purification
After confirming the TOPO-DNMAML1 and TOPO-CherryNLS clones, the first step was to clone DNMAML1 in pT2K-BI-TREeGFP. 2µg of pT2K-BI-TREeGFP and 8µg of TOPO-DNMAML1 were double digested with NheI and EcoRV, as previously described, in a final reaction volume of 30µL and 80µL, respectively. Digestion product of pT2K-BI-TREeGFP was purified using the QIAquick PCR Purification Kit (QIAGEN) according to the instructions. Digestion products of TOPO-DNMAML1 and TOPO-CherryNLS were loaded on a 1.5% agarose gel (see section 2.3.10) and the fragments of interest were collected and purified using QIAquick Gel Extraction Kit (QIAGEN) according to the manufacturer’s instructions. In both cases, DNA was eluted in 30µL of EB Buffer.
2.3.4.4.2 Ligation reaction and transformant analysis
Ligation reaction between pT2K-BI-TREeGFP and DNMAML1 was performed according to the correlation ng of insert = ((ng of vector x Kb size of insert)/Kb size of vector) x 10. Thus, 150ng of pT2K-BI-TREeGFP (8,7Kb) were added to 35ng of DNMAML1 (0,2Kb), using 1µL of T4 DNA Ligase (NEB 400U/µL) and the correspondent 1X Buffer (50mM Tris-HCl pH7.5, 10mM MgCl2, 1mM ATP and 10mM DTT) in a final volume of 20µL, at room temperature (RT), overnight. Half of the ligation result was used to transform DH5α cells as described (see section 2.3.2). Transformants were tested for the presence of the recombinant plasmids of interest by repeating the procedures 2.3.3 and 2.3.4.3.
2.3.4.5 Cloning CherryNLS in pT2K-DNMAML1eGFP
After confirming the presence of DNMAML1 in pT2K-DNMAML1eGFP, the CherryNLS sequence was fused to DNMAML1. 2µg of pT2K-DNMAML1eGFP and 4µg of TOPO-CherryNLS were digested with EcoRV and purified as described in section 2.3.4.4.1. Before the ligation reaction, the linearized pT2K-DNMAML1eGFP was dephosphorilated in order to prevent auto-ligation by adding 1X CIP enzyme and 1X Buffer 3 from NEB (50mM Tris-HCl pH7.9, 10mM MgCl2, 100mM NaCl and 1mM DTT), and incubated at 37ºC for 3h. After a new purification step (see 4.4.1), the ligation reaction between CherryNLS and pT2K-DNMAML1eGFP was performed by adding 150ng of vector (8,9Kb) to 13ng of insert (0,76Kb) in the same conditions described in 2.3.4.4.2. After purification and quantification steps, the correct orientation of the insert in pT2K-DNMAML1eGFP was confirmed by agarose gel electrophoresis (see section 2.2.10) after restriction analysis with PvuII using Buffer B from Promega (6mM Tris-HCl pH7.5, 6mM MgCl2, 50mM NaCl and 1mM DTT).
13 2.3.5 Avian Embryos
Fertilised chicken eggs (Gallus gallus) were obtained from Sociedade Agrícola Quinta da Freiria, S.A., Portugal, and Japanese quail eggs (Coturnix coturnix japonica) from Interaves, Sociedade Agro-Pecuária, S.A., Portugal. Eggs were stored at 16ºC and incubated at 38ºC to initiate development. Dissection was performed at specific stages according to Hamburger and Hamilton stages (HH, Hamburger and Hamilton, 1951) or after distinct incubation times. 2.3.6 Organotypic assay of explants of the pharyngeal region
The pharyngeal region between the first and fourth PA was dissected from quail E3 embryos, cut dorsally along the anterior/posterior axis (along the notochord), and kept in PBS and on ice until culture setting. Explants were cultured with the opened dorsal side down, placing endodermal tissues in contact with the 74μm Mesh Size Polyester Membrane (24mm NetwellTM , Corning) and in culture medium (Figure 2-2) for 48h in a humidified incubator at 37ºC with 5% CO2. Culture medium was RPMI-1640 (Sigma) supplemented with
10% Fetal Bovine Serum (FBS) (Invitrogen) and 1x Pen/Strep.
For Notch signaling inhibition, two distinct pharmacological inhibitors were used: DAPT – InSolutionTM -Secretase Inhibitor IX (Calbiochem), and StemoleculeTM LY411575 (Stemgent). Culture medium was supplemented with different concentrations of the two inhibitors: 12.5, 25, and 50μM for DAPT; or 100 and 200nM for LY411575.
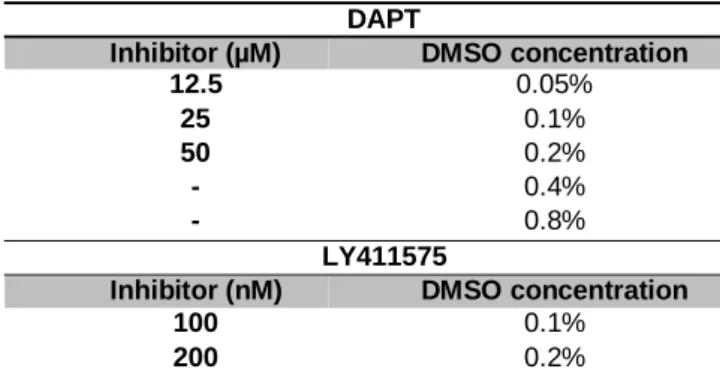
The control culture medium was supplemented with DMSO (Sigma) at the concentration used in the corresponding experimental condition (with -Secretase inhibitor), and a dose-response curve was performed to check for toxic concentrations (see Table 2-1).
Table 2-1 DMSO concentrations used to perform the dose-response curve and the respective inhibitors (DAPT
and LY411575) concentrations.
After 48h of culture, explants were washed in PBS, RNA extracted (see section 2.3.8.2) and qRT-PCR analysed (see section 2.3.9). For each culture condition, a pool of two to five samples replicates (n=2-5) was obtained for qRT-PCR analysis. Each sample consisted of a pool of five pharyngeal explants. Freshly dissected pharyngeal regions (E3) were used to evaluate gene expression analysis at 0h of culture. In vitro assays were performed in collaboration with Marta Figueiredo, the PhD student from our research team.
DAPT
Inhibitor (µM) DMSO concentration 12.5 0.05% 25 0.1% 50 0.2% - 0.4% - 0.8% LY411575
Inhibitor (nM) DMSO concentration
100 0.1%
14
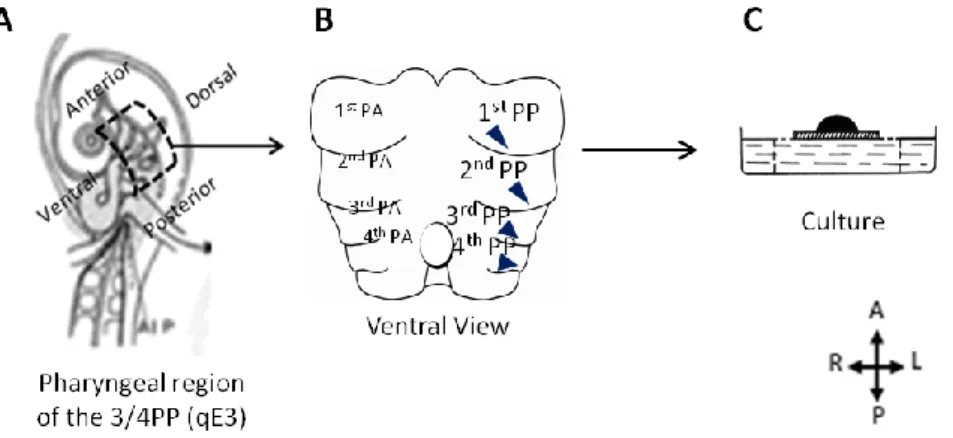
Figure 2-2 Schematic representation of the in vitro culture of the pharyngeal region explants. Region of the
pharynx dissected at E3 quail embryo (A). Ventral view of the dissected pharyngeal region (B). Pharyngeal explants are grown in the presence (experimental condition) or absence (control condition) of the pharmacological inhibitors of Notch signaling. Note the PP endoderm in contact with the culture medium (C). A, Anterior; D, Dorsal; PA, Pharyngeal Arch; PP, Pharyngeal Pouch; P, Posterior; V, Ventral.
2.3.7 Organotypic assay of heterospecific association of tissues
The region of the 3rd and 4th PA was dissected from quail embryos at E3 (HH-stage 21) and treated with a solution of pancreatin (25g/L, Sigma) for 60-90min on ice to allow the separation of the endoderm from the pharyngeal mesenchyme and ectoderm. Somatopleural mesenchymal tissues of E2.5 chick embryos (HH-stage 18) were isolated at the level of somites 19 to 24. The mesenchyme was further treated with a solution of pancreatin (25g/L, Sigma) for 10-20min on ice to allow its dissociation from endodermal and ectodermal tissues. Isolated 4-5 endodermal explants were associated with 4-5 mesenchymal explants on Nucleopore membrane filters (Millipore) supported by fine meshed metal grids (Goodfellows), placed in culture dishes and in contact with culture medium [RPMI-1640 (Sigma) supplemented with 10% Fetal Bovine Serum (FBS) (Invitrogen), 1x Pen/Strep], for 48h in a humidified incubator at 37ºC with 5% CO2. After 48h, cultured tissues were washed in PBS,
RNA extracted (see section 2.3.8.2) and qRT-PCR analysed (see section 2.3.9). Freshly dissected endodermal and mesenchymal explants (E3) were used to evaluate gene expression at 0h of culture. In vitro assays were performed in collaboration with Marta Figueiredo, the PhD student from our research team.
2.3.7.1 Notch signaling inhibition by DAPT
For Notch signaling inhibition, a pharmacological inhibitor was used: DAPT – InSolutionTM
-Secretase Inhibitor IX (Calbiochem). The culture medium [RPMI-1640 (Sigma) supplemented with 10% FBS (Invitrogen), 1x Pen/Strep] was supplemented with 50μM of DAPT – InSolutionTM-Secretase Inhibitor IX (Calbiochem). The control culture medium was