How interest rates are affected by
relationship lending technology: a study on
Portuguese SMEs.
João Manuel Fidalgo Rita Caçoilo
Católica Porto Business School 2019
How interest rates are affected by
relationship lending technology: a study on
Portuguese SMEs.
Trabalho Final de Mestrado na modalidade de Dissertação apresentado à Universidade Católica Portuguesa
para obtenção do grau de mestre em Finanças
por
João Manuel Fidalgo Rita Caçoilo
sob orientação de
Prof. Doutor Manuel Ricardo Fontes da Cunha
Católica Porto Business School, Universidade Católica Portuguesa Maio, 2019
Resumo
Este trabalho final de Mestrado investiga o papel do relacionamento das empresas com o banco e seu impacto nas taxas de juros entre outros fatores.
Entre outros fatores, as variáveis estudadas são o número de bancos, a localização geográfica e o tipo de gestão/propriedade da empresa. Com uma amostra de 4478 empresas entre o ano de 2010 e 2017 realizou-se uma regressão simples OLS e o resultado obtido mostra que o tipo de relacionamento com o credor tem um impacto sobre as taxas de juro. As principais evidências deste estudo mostram que informações “soft” são importantes, em especial a localização geográfica e o tipo de tipologia da empresa.
Abstract
This dissertation paper investigates the role of relationship lending and its impact on interest rate among other factors.
Among other variables, the determinants studied are the number of banks, distance from metropolitan areas and type of company ownership/ management. Using a sample of 4478 companies between the year of 2010 and 2017, it was made an OLS regression and the result shows that relationship lending has an impact on interest rates paid to the lender. Evidence shows that soft information is important, especially the geographical location and the type of ownership/management of the company.
Índice
Resumo ... iii
Abstract ... iv
Índice ... v
Índice de Figuras... vi
Índice de Tabelas ... vii
1. Introduction ... 1
2. Relationship Lending Literature Review ... 3
2.1 What is Relationship Lending ... 3
2.1.1 Advantages of Relationship Lending ... 3
2.1.2 Disadvantages of Relationship Lending ... 4
2.2 Effect of Relationship Lending on loan spreads and firm performance ... 5
2.3 Impact of banking competition, debt held and years of relationship with the main lender ... 7
2.4 Impact of Size and distance that separates the lender and the borrower .. 12
2.5 Type of ownership and relationship lending... 14
3. Research Question ... 16
4. Methodology ... 17
4.1 Dependent Variable - Interest Rate ... 17
4.2 Independet Variables ... 18
5.Data and Sample ... 22
5.1 Data Description ... 22
5.2 Descriptive Statistics ... 30
5.3 Preliminary Analysis ... 32
5.4.1 Financial Characteristics ... 32
5.4.2 Relationship Lending characteristics ... 34
6. Results ... 38
6.1 Relationship variables results ... 38
6.1.1 Number of Banks impact on interest rates ... 40
6.1.2 Geographical location impact on interest rates ... 40
6.1.3 Ownership type impact on interest rates ... 41
6.2 Results of Financial control variables... 42
7. Conclusion ... 44
7.1 Limitations and Future research ... 45
Índice de Figuras
Figure 1 – Relationship between Number of Banks and interest rates ... 35 Figure 2 – Relationship between Geographical location and interest rates ... 36 Figure 3 – Relationship between Ownership type and interest rates ... 37
Índice de Tabelas
Table 1 – Average interest rate by grographic location ... 23
Table 2 – Average interest rate by year ... 24
Table 3 – Average interest rate by ownership type ... 25
Table 4 – Average interest rate by number of banks ... 25
Table 5 – Average interest rate and descriptive statistics of Relationship variables by sector ... 27
Table 6 – Descriptive statistics ... 31
1. Introduction
Relationship Lending is a lending technology, that the banks and borrowers adopt (Berger and Udell, 2006; Vlado Kysucky and Norden, 2016).There is not a definition that is universal among scholars, but the prevalent definition is that under this technology banks acquire private information over time through contact with his owner, community and the firm by its nature. This information is used throughout the relationship to make decisions about the availability and the terms of credit (Boot, 2000; Berger and Udell, 2002).
This study has the objective to observe how in Portuguese SMEs soft information can impact the terms of the credit and its costs. To answer, it was gathered a data base of 4478 Portuguese SMEs from all sectors, excluding financial industry and state-owned companies, with data between 2010-2017, the focus is to add/provide information on relationship lending in the Portuguese reality. Several past works were analysed to build this study on how interest rates are impacted by relationship lending (Berger and Udell, 1995; Bharath, Dahiya et al. 2011; López-Espinosa et al. 2017).
Results indicate that interest rates that companies are paying to the lender are being affected by banking relationship variables. Specifically, we analyse whether interest rates are affected by ownership type (family owned, and non-family owned companies) which can be explained by soft information of relationship. Also, the distance from the main Portuguese centres is analysed as a factor affecting the interest rate that is being paid. Companies located outside the metropolitan areas of Lisbon and Porto are paying different rates than companies located on those areas. This can also be explained by soft information (Bonini et al. 2016; Fungácová et al. 2017). Finally, we also find that the number of banks that a company is currently borrowing from is also
impacting the interest rate that a company is currently paying (Diamond, 1984; Peterson and Rajan, 1994; Bharath et al. 2011; Cenni et al. 2015; Matias Gama and Van Auken, 2015).
Concerning this thesis organization, in the second section is presented the relevant literature to develop the study. The following section presents the main research question of how interest rates are affected by relationship lending in Portuguese SMEs, with three different hypothesis that will be tested. In section 4 is presented the methodology used to answer the hypothesis and the description of each variable used in the model. Section 5 is made a statistical description of the data and a preliminary analysis. In section 6 the main results are discussed. The last section presents the main conclusions of this study, the main limitations of the study and suggestions for further research.
2. Relationship Lending Literature Review
In this section the main literature review on relationship lending is discussed.
2.1. What is Relationship Lending
This type of lending is mostly related to SMEs (Berger and Udell, 2006; Badulescu and Badulescu, 2012; Berger, 2015;), because the providing of credit to SMEs is comprehensively different. Typically, SMEs is a constant growing sector, are opaque firms in terms of information availability, do not trade debt or equity and are highly profitable compared to bigger firms. To overcome these opacity difficulties, and to provide credit to SMEs, loan officers and lenders use relationship lending technology, where banks collect information overtime and use this “soft” information to provide credits that SMEs demand to face their financing needs (Uchida et al., 2012). Due to asymmetric information these loans would not been granted by other institutions which do not possess this type of information.
2.1.1. Advantages of Relationship Lending
When banks are not confident about the type of firm they are dealing with, it is common to charge higher premiums on interest rates. However, this adjustment would make the borrower to take riskier entrepreneurial projects, so it could have higher return and still be able to pay interests without struggling margins. With this, banks are not encouraged to grant loans at a higher rate than a threshold value, since the higher risks taken by the firm underlay a lower expected profit (Diamond, 1984).
To mitigate this information asymmetry in the credit market, banks implement a monitoring activity. However, in cases where there is multiple lending, the incentive to acquire and assess the creditworthiness of a borrower is diminished, as the costs would be carried by only one lender and the benefits would spread to all. To solve this issue, banks can develop closer relationships with firms, especially with less transparent firms (Ramakrishnan and Thakor, 1984; Fama, 1985; Rajan, 1992). This relationship over time will impact the type of investments that the firm decides to implement, it will lead to a better use of funds, with higher quality projects and so, resulting in higher expected profits (Berger and Udell, 2002; Bolton et al., 2016).
With the improvement of this relationship, firms acquire some privileges throughout the lending partnership. According to Karmakar et al., (2018), with the reduction of asymmetric information, banks ask for less collateral on a credit loan, an essential feature in debt contracts. For SMEs that do not have considerable collateral, this suggests that having a strong relation with the lender increases access to credit. These findings are in line with Berger & Udell, (2006). Further, SMEs have preferred loan terms and improved credit availability when in a long-term relationship lending (Peterson and Rajan, 2002; Bharath et al., 2011).
2.1.2. Disadvantages of Relationship Lending
The use of such Relationship lending is beneficial to both banks and firms, but it can also lead to some disadvantages (Diamond, 1984).
The main disadvantage that this relationship can bear to the firms, is that this lending will give an information monopoly to one bank, and so impose their monopolistic power and ask for higher rates (Ioannidou and Ongena, 2010; Stein et al., 2018). This downside of relationship lending can be reduced if firms are willing to diversify away from their main bank (Ongena and Smith, 2000).
According to Detragiache et al., (2000), multiple lending, will have a positive impact on profitable projects, instead of abolishing perpetually profits if firms are struggling with higher interest rates.
2.2. Effect of Relationship Lending on loan spreads and
firm performance.
As seen on the previous chapter, relationship lending can have an immense impact on firm performance. The spread that firms must pay for their credits can be a catalyst for their performance. The economic and political environment impact massively the interest rates that are being exercised, and this external variable can impact positively or negatively the firm’s performance and investments. According to Gong et al. (2018), a cross-country study in 19 major economies over 2000–2015 on syndicated loan contracts, uncertainty-averse lenders ask for higher premium when being exposed to uncertainty. On average when the uncertainty rises by a one standard deviation the firms seeking finance pay an extra 12 Bps on the loan.
To face uncertainty, firms should establish a lending relationship, otherwise they will have to pay higher rates and so decrease their financial performance. For SMEs, which are more opaque firms and have less collateral to pledge, not only, but specially during a cyclical downturn, having a relationship lending is extremely beneficial, suffering less credit constraints (Beck et al., 2014). According to Banerjee et al., (2017), after the Lehman Default Shock, companies who experienced a longer relationship with the main bank, had their loans cheaper, paying lower interest rates, as well as a stronger credit growth. The same result was found during the Period of the European sovereign debt crisis. Important to notice is that this effect was only visible if the firms maintained a
close relationship with well capitalized banks. These results are in line with Bolton et al. (2016).
As said previously, this technology is not only beneficial in cyclical downturns but throughout all business cycles, as shown by Berger and Udell (1995), SMEs with longer banking relationships will borrow at a lower rate than other small firms, and pledge less collateral. The results are consistent with Financial Intermediation literature, which illustrates the idea that banks gather critical information and see the type of firm they are dealing with, and so, use this information to adjust the contract terms (Diamond, 1984; Ramakrishnan and Thakor, 1984; Boyd and Prescott, 1986).
When banks obtain “soft” information, gathered throughout the lending relationship, they reduce the level of information asymmetry and the problems of moral hazard are overcome, and with this, firms experience a reduction on the spread charged by the bank. This effect can only be noticed two years after the first loan was contracted and after that, the bank will, according to the hold-up theory, charge above cost interest rates as the relationship continues (López-Espinosa et al., 2017). The result is consistent with Bharath et al., (2011), concluding that repeating borrowing from the same lender convert on lower interest rates paid. But Cenni et al., (2015), goes further and concludes that up until the seventh year of repeated borrowing to the same lender there is no benefit to the firm and only after the seventh year there is an indication that it is easier to obtain credit and larger credits. Still, this benefit is significantly reduced for SMEs due to information opacity.
Seen that firms can benefit from Relationship lending to pay lower spreads on their credit loans, it was concluded by Gmabini and Zazzaro (2013), that this relationship does hold only for term loans but can have a significant impact on firm’s stability and growth rate.
But for this technology to accomplish benefits for both, borrower and lender, the match of the firm with the main bank must be optimal. According to Ferri and Murro (2015), a firm might end up with a type of bank that differs from the expected and needed, translating to future problems as switching costs may keep the firm with the same lender, forming an “odd” couple that does not deliver any benefit for both parties involved. If those costs would be lower and if measures were adopted to increase transparency of a bank’s lending technology, the probability of forming “odd” couples would be reduced.
2.3. Impact of banking competition, debt held and years
of relationship with the main lender
The longevity of the lending relationship and its effects is a subject that is being studied on later in the XX century until now. We can say that the clear majority of academic theories agree that long-term lending relationships are beneficial, on many levels, to firms in general, but especially for SMEs and especially during downturns of business cycles (López-Espinosa et al., 2017). Although the influence of this technology seems to have different impact according to the firm financial health, to Agostino and Trivieri (2018), SMEs are always benefited with longer relationships, although having less significant impact on SMEs with weaker financial health. Controversially to the literature, Elsas (2005) found that years of lending relationship have absolutely no correlation with any benefit that companies might have, but what it is important explaining lending relationship is the percentage of credit share of the main bank and the number of banks the firm works with.
The benefits of having a lasting lending relationship can vary, but the main and the more direct consequences are on collateral pledged on each credit loan, lower interests paid and less credit constraints with easier access to credit loans
(Cenni et al., 2015; Banerjee et al., 2017; Anderson et al., 2018). Comparing SMEs with more transparent firms, the credit rationing is always more significant to opaquer firms, even when having lasting relationships than to transparent firms, even in the beginning of the relationship. Yet, this rationing gap between more opaque and transparent firms decreases over time as the bank gather critical information about the opaquer firm (Kirschenmann, 2016). Even when firms have easier access to credit loans, Badulescu and Badulescu (2012), found that there is a large gap between the credit supply and the amount of credits and the firm expectation. Firms expect their lending relationship to support not only for loans but also for trust, support and partnership. To the authors the fact that the gap exists is explained by the reluctance of banks to SME firms.
Relationship lending can be so powerful that if SMEs and Banks seek a long-term relationship and connect it with the theory that if banks held a bigger equity capital buffer in anticipation of a crisis, the real effects of crisis on corporate investment and economic activity would be significantly reduced (Bolton et al., 2016). In contrast to the theory mentioned, to Stein (2015), SMEs are being damaged when exposed to longer banking lending relationships. This finding relies on the fact that SMEs trust exclusively on banks and therefore they have a lower negotiation power, so banks can impose their terms and so they can increase interest rates on loans if necessary.
For SMEs, this long relationship should be associated with a more concentrated debt around the main bank (Cenni et al., 2015). SMEs approach more stable banks with less liquidity problems since those banks have higher deposits ratios and so these banks can provide loans with better conditions constantly. Commonly, firms do have more than one lender, but at the same time they maintain a long-lasting relationship with the main bank, which holds a higher debt percentage of the firm. This result is confirmed by Stein et al., (2018), concluding that opaquer firms, such as SMEs, focus their borrowing on
one bank only, translating to a more stable relation with that lender. The firms that tend to more frequently switch or have multiple lending are generally small, young firms that have high growth opportunities with high leverage ratios (Ongena and Smith, 2001). For Degryse and Ongena (2001), these types of firms tend to start with a single banking relationship and when they start to grow and continue to implement good projects with great results, the tendency is to keep the relationship with the same lender. Even though, to Guida and Sabato (2017), SMEs that have an exclusive banking lending relationship, tend to negatively affect their leverage ratios. SMEs with lower equity ratios and less profitable firms, are less likely to switch banks to obtain loans as the rates that other banks would ask to a riskier firm with high debt ratio and low profitability would be significantly higher than continuing with the same lender. The switching is explained by the fact that companies are sceptical of their relationship lender and so they want to avoid a rising costs from information exclusivity. If the firm is bonded to only one bank, and later if they apply for a loan on a different bank, the firm might face an adverse selection problem and the bank may ask for a “lemons” premium or even worst, refuse to provide the loan (Stein et al., 2018).
On the other hand, when the projects do not produce such as good results, firms are more likely to change or to add banks, so they can try to meet their financial needs, even if paying higher rates. But, the fact that firms look for a new relationship to Gopalan et al., (2011), is explained by the need of firms to expand their access to credit and overcome borrowing constraints and not to the success of firm projects . On average, when forming a new relationship, the borrower obtains larger loans amounts.
As we can conclude, literature is not very conclusive regarding the multiple vs single relationship lending approach. On one hand, literature concludes that the costs of credit and credit rationing will be lower when having a lower
number of lenders (Peterson and Rajan, 1994; Bharath et al., 2011; Cenni et al., 2015). Other literature found that multiple lending will impact negatively the performance of a firm (Castelli et al., 2012).
Not having multiple lenders does not mean having only one lender. This is due to the enormous disadvantages the borrower will suffer, that has to do with the fact that the lender could exercise a monopolistic relationship by extracting higher rents to the firm (Matias Gama and Van Auken, 2015). But an exclusive relationship can also reduce the likelihood of a firm falling to a financial crisis and its subsequent liquidation (Carmignani and Omiccioli, 2007).
According to Duqi et al., (2018), the existence of alternative source of financing reduces the bank ability to threaten a long-lasting relationship situation. But firms that rely on multiple bank lending situation, tend to turn off the fresher relationships and build a long-term relation with one bank only, usually the most relevant to the firm.
Boot and Thakor (2000), concluded that it is important to distinguish two different types of competitions: interbank competition and capital market competition. Increasing interbank competition will raise the number of banking relationships loans, lowering the added value for the borrowers. Increasing capital market competition will reduce the number of banking relationship loans, but each relationship loan does have a greater value for borrowers. Empirical evidence concludes that the probability of SMEs being credit rationed increases when the competition in the banking market is reduced (Canales and Nanda, 2012). When on a highly competitive environment, SMEs tend to have more banking relationships and so experience fewer credit constraints (Neuberger et al., 2008).
Bonini et al., (2016) pointed that jointly, relationship lending and market competition could influence the cost of borrowing to the firm. The result obtained can explain the controversial results of previous literature on the
impact of relationship lending on the cost of credit. If relationship lending is only measured as the number of years of relationship with the main bank is interacted with banking competition variable, the results suggests that duration can affect negatively the costs of credit only when the market is competitive. These results were later confirmed by Fungácová et al., (2017) , by studying 20 European countries over the period of 10 years, from 2001 to 2011, the authors concluded that cost of debt increases on more competitive environments, and added that the positive side of banking competition is stronger for smaller firms. That is related to the fact that a lack of competition incentivizes banks to invest in soft information. The positive effect of banking competition however is influenced by the institutional and economic framework, as well as by the crisis. Contrarian is the findings of Elsas (2005), concluding that relationship lending is more likely when the level of competition increases in the market.
Other studies such as, Agostino and Trivieri (2010), focused on the association between bank competition and firm performance. Finding that borrowers that receive funding on a less competitive market have lower profitability than those firms that are financed in a more competitive environment. Controversially, Rogers (2011), argues that there is lower growth on more competitive markets and lower firm performance. The reason for the result is that when more competitive markets are in place, it is harder to stablish stable and log-term credit relationships.
A study on Chinese SMEs concluded that a more intense banking competition is signal that firms have a lower probability to have credit constraints, this gap is filled by city commercial banks and not state-owned banks (Chong et al., 2013). Same findings as Ryan et al., (2014), but they added that the constraints are stronger on financial systems that are more bank dependent.
2.4. Impact of Size and distance that separates the
lender and the borrower
Another determinant factor that impacts the choice of borrower or the lender to engage in relationship lending technology is the geographical distance between the firm and the borrower. The increase in “hard” information technologies allows loans to be handed out by more distant banks. However, for SMEs that are more opaque firms with less financial control over their statements, the use of “hard” technologies become less relevant and “soft” information takes charge. Several studies point to the fact that smaller borrowers tend to be geographically close to the credit providers to access “soft” information easier (Agostino and Trivieri, 2018). Therefore, this lending technology is beneficial since close by lenders have an advantage because they can obtain a greater amount of soft information at lower costs (Patti and Gobbi, 2001; Peterson and Rajan, 2002). This also means that firms that are more distant to urban areas will have higher costs of debt because of information disadvantages, and the monitoring by the lender is not that meticulous, subsequently, lenders charge higher rates to the borrower (Arena and Dewally, 2012). Also, to Agarwald and Hauswald (2010), bank-firm proximity can boost the market power of the bank and subsequently take advantage of this factor and charge higher interest rates. Also, when a firm is facing some degree of financial distress, the bank can provide more efficient liquidity to the distressed firms if they are regionally active and have a close and lasting relationship with the firm (Hower, 2016).
This information of local borrowing is in the hands of the managers of local bank branches and sometimes it can be a problem to transport the information gathered to the bank’s higher hierarchical levels. The literature existing on this
topic seems to agree that lenders whose managers are near to their borrowers, have the potential to make better and faster credit decisions, and so these banks have an advantage over their peers, due to the fact there is less agency problems and there is a better use of soft information (Berger and Udell, 2002). In this sense, bigger banks will avoid using this lending technology due to the unfunctional distance, because of this they usually decide to grant credit to bigger and more transparent firms located in urban centres. These bigger banks will not extend any credit to SMEs that are not located in urban centres, since the bank branches are distant from the central operational headquarter, or because SMEs are less transparent firms and the information they can gather is opaquer (Arena and Dewally, 2012). However, larger banks with more hierarchy have a competitive advantage in using loan technologies based on hard information give the economies of scale, they are better at evaluating, processing and collecting it, but have a disadvantage using relationship lending because with this case they must gather soft information on the firm (Presbitero and Zazzaro, 2011).
According to Uchida et al., (2012), it is true that soft information is more relevant for smaller banks, but they also put more effort than their larger peers. Finding no evidence that loan officers are incapable of producing this type of information and potentially underwrite relationship credits. If larger banks altered their activities, they would be able to produce more and better soft information of their borrowers than smaller banks. If bigger banks would permit their local branch managers to interact frequently with customers and delegate financing decisions to a lower level granting branches more autonomy, that alone would make it possible for bigger banks to seek this lending technology with their borrower (Canales and Nanda, 2012; Uchida et al., 2012; Bartoli et al., 2013). Berger et al., (2014), with data gathered from a survey Small Business Finance of 2003 sample, it was concluded that bigger banks are now,
more than ever, using this lending technologies and lending to small and more opaque firms, due to the fact of more banking deregulation existing in the US market.
According to Cenni et al., (2015), the proximity variable was not significant explaining any benefits to SMEs because of technological improvements, such as credit scoring, that allows bigger banks to transform soft information into hard and easy to transfer data, which subsequently reduce the advantages of localism lending. Also, to De la Torre et al. (2010), all type of banks, small, large and foreign banks are catering to SME, but banks with multi-services have a competitive advantage because they can offer a wide range of products and services on a larger scale by using new technologies, business models and risk management systems. All banks see SMEs as a core and strategic business and are always looking forward to expanding their links with SMEs. The findings of Hasan et al. (2017) are in contrast because they find that when the banking local market is dominated by foreign banks do not alleviate access to credit to SMEs, in fact, it increases costs, reduces investment and subsequently does not favour growth, contrary to areas that are dominated by more local cooperative small banks.
2.5. Type of ownership and relationship lending
As seen in the previous sections, some authors defend that there is a preference by small banks towards using relationship lending. Additionally, the status of the bank, if they are commercial, more profit orientated versus more cooperative and less profit orientated, might influence the bank attitude to adopt relationship rather than transaction lending (Delgado et al., 2007).
The cooperative type of bank is more deeply imbedded in local communities, where the firm’s capital is deeply related with the entrepreneur’s personal
wealth. Therefore, cooperative banks must reach more often for discussions of private matter with firm owners (Uzzi, 1999). According to Berger and Udell (2002), relationship banking depends on soft information about the firm, the owner and the local community and so, the loan officer typically have a strong connection with the firm, the owner of the firm and the community. So, the transactions with cooperative banks became deeply connected with social roots and networks (Neuberger et al., 2008)
The evidence stacks up in favour of cooperative banks for taking relationship loans because of the points discussed before. Angelini et al., (1998) concluded that cooperative banks provide better credit terms to borrowers. Ogura (2012) find that cooperative banking provides more credit although at a higher cost in Japanese communities.
On the other hand, few studies have been realized to understand the impact of the type of ownership on the company profits and costs. However, a study on Taiwan SMEs between 2002 and 2006 by Wenyi Chu (2009) find a positive relationship between family owned business and SME performance, meaning that family owned companies have a higher performance when comparing to non-family business, suggesting that it is an effective organizational structure for the Taiwanese reality. But when studying ownership type on financial costs that a company bears to a bank for their loans, Berger and Udell (1995) did not find any relationship that sustains the theory of family companies are paying different premiums over the prime rate for their loans.
3. Research Question
In this section are presented the main questions and objectives of the study. After the literature review of the previous chapter, it was important to study “soft” information and how it can impact the Portuguese SME’s interest rates.
Firstly, it is intended to study if the number of banks that is providing credit to Portuguese SME’s has an impact on the interest rates paid.
(1) H1: Number of Banks impacts the interest paid to the lender.
Also, it is intended to understand if distance from large metropolitan centres impacts the interests paid to lenders. This is, if firms that are located on metropolitan centres have an advantage or disadvantage comparing to enterprises that are distant from those centres.
(2) H2: Being located on a metropolitan centre has an impact on interest paid to the lender.
Lastly, it is proposed to understand if relationship lending and soft information can impact the interest rates paid to the lender, depending if the company is a family business or a non-family business.
(3) H3: Ownership of the firm can have an impact on the interest paid to the lender.
Furthermore, other determinants of interest rate will be studied that are not included on the main analysis of the study.
4. Methodology
The data base is a panel data, composed by 4478 Portuguese SMEs, during the period between 2010-2017. This data was selected to determine the impact of some relationship lending variables on the interest rate paid to the lender.
We used an OLS regression with the model presented below to answer the hypothesis raised on the previous chapter.
(4) 𝐼𝑛𝑡𝑅𝑎𝑡𝑒𝑖,𝑡= α + β1Levi,t + β2ProfitMargi,t +β3Currati,t +β4Quickrati,t
+β5ArTurni,t+β6ApTurni,t +β7InvTurni,t +β8TAi,t +β9Roai,t +β10CoverRati,t
+δ11dNBanksi+δ12dMetrAreai,t +δ13dOwnershipi +εi,t
This model and methodology is similar to the study of Berger and Udell, (1995), due to the fact that the subject studied is similar and it served as a base for several other studies. The variables were taken from those studies but for the Portuguese Market. This model helps to determine what “soft” and “hard” is significant explaining the interest rates that the borrower must pay.
4.1 . Dependent Variable – Interest Rate
IntRate denotes the amount of interest that the SME has paid to the lender, on the total amount of financing debt on a yearly basis. The variable is used in Berger and Udell, (1995); Bharath et al., (2006); Gong et al., (2018) as the spread paid to the lender, this is, the premium over the prime rate practiced in the market.
The dependent variable, due to lack and trustworthiness of information on the data base set, interest rates per year were computed as a mean of interest paid on year D and the D-1. This was to control other costs that are imputed on
the variable interest paid, for instance factoring costs, other fees that are inflating the real interest paid to the lender.
4.2. Independent Variables
Independent variables are split in to two different categories, the financial characteristics of the firm - control variables - and the relationship lending characteristics that relate to “soft” information, the main variables being studied.
Financial characteristics represent the so called “hard” information that is more related to ratios and easy to quantify variables. In this study, the control variables used are leverage, profit Margin, current ratio, quick ratio, accounts receivables turnover, accounts payables turnover, inventory turnover, return on assets, coverage ratio and total assets of the firm. These variables are set to control for the financial risk that is observable on SMEs in the regression that determine the interest rate paid to the lender.
Lev denotes the leverage of the SMEs. The ratio was computed as total debt to total assets for each firm by year. According to Gong et al., (2018), leverage firms are more likely to default on the payment of interest and because of that, it is expected to be charged a higher interest and Ferri and Murro, (2015) added that higher leverage ratios increase the likelihood of credit rationing. The study of Cenni et al., (2015), leverage and interest coverage are the variables that translate to a firm creditworthiness. To Guida and Sabato, (2017) and Bharath et al., (2011) the use of soft information is able to increase the leverage of the firm with SMEs being able to being more in debt compared to their total assets because of their access to loans.
ProfMarg denotes for the profit margin of the enterprise. This is a ratio that demonstrates the pre-tax profit to the percentage of sales by year. According to
Berger and Udell, (1995) findings, companies with higher assets have lower profit margins and pay a lower premium over the prime rate.
Currat denotes the current ratio and it the ratio of current assets to current liabilities. This measures the ability of a company to pay short-term obligations within a year. The study of Bharath et al., (2011) finds that lower values of current ratios is linked to SMEs that borrow from relationship lenders suggesting that this SMEs that have lower ratios have better access to loans.
Quickrat denotes the quick ratio of the firm. This ratio provides the company’s short-term liquidity position and measures the ability of the company to meet the obligation on short term with the liquid assets. A ratio of 1, means that the company is fully equipped with exactly the amount of liquid assets to meet their short-term obligations. A ratio of less than 1 means that the company is not prepared to face short term obligations with liquid assets. This variable was used as control variable by Berger and Udell, (1995) and it is the current assets of the firm less inventory and divided by the current liabilities of the firm on that year.
ARTurn denotes the number of days that a company is receiving from their clients. According to Peterson and Rajan, (1994) this ratio is used by the lender to monitor the cash flowing of the firm. The ratio was computed as (Accounts receivables)/(Sales/days) as in (Berger and Udell, 1995).
APTurn denotes the number of days that a company is paying to their suppliers. The ratio is used in Berger and Udell, (1995) as a financial characteristic variable and it was computed as (accounts payable)/(cost of goods sold/days).
InvTurn measures how fast a company sells their inventory. This means that low turnovers ratios imply weak sales and excess inventory and vice-versa. The ratio was computed the same as in Berger and Udell, (1995) paper, Inventory /(cost of goods sold/days).
ROA denotes the net income by total assets, measuring the profitability of a company compared to their total assets, and so how efficient is the management of the assets to generate income. According to Ferri and Murro, (2015) on a study credit rationing concluded that a one percent increase in ROA ratio reduces the probability of credit rationing by 4,6%, similar results found by (Cenni et al., 2015). Regarding loan spreads, control variable ROA is negatively related with dependent variable according to (Gong et al., 2018).
Cover denotes the ability to repay borrowing costs with ordinary operation regardless of the debt level of the firm. It is computed by taking earnings before interest and taxes and divide it by the interests paid. This ratio is used to evaluate the creditworthiness of a company according to (Cenni et al., 2015). Although on a study made by Bharath et al., (2011), they have used earnings before interests, taxes, depreciations and amortization, which is less logical to use to compute the capability of a firm to face interest payments per year. Said that, it was opted to use EBIT instead of EBITD and so not inflating the coverage ratio. The variable was computed as the LOG of coverage ratio, as the paper of (Bharath et al., 2011) to control for heteroskedastic .
TA denotes the size of the firm by their total assets. It is used in several papers as a financial control variable that values the size of each company. On the study it was computed the log of total assets to control for heteroskedastic as (Berger and Udell, 1995; Ferri and Murro, 2015).
Relationship lending characteristics or “soft” variables are the variables in study. In this study it was intended to study three different characteristics and their impact on interest rate spreads. The variables chosen to represent relationship lending were the number of banks that a firm is currently borrowing, the distance from a metropolitan area and the type of ownership of the firm this is, if the firm is family owned or not.
NºBanks denotes the number of banks that the firm is currently borrowing from. This variable captures the possible incidence of moral hazard (Ferri and Murro, 2015; Peterson and Rajan, 1994; Rajan, 1992).
MetroArea is a dummy variable that takes equals one (D=1) if the company is located on a metropolitan area, such as Oporto and Lisbon, and takes the value zero (D=0) otherwise. This variable tries to capture the additional information that banks might obtain from easier interaction with their lenders (Peterson & Rajan, 1994; Patti and Gobbi, 2001; Peterson and Rajan, 2002). To Arena and Dewally, (2012); Agarwald and Hauswald (2010), the proximity to their lender has a negative impact on the interest rates charged, for the reasons mentioned on 2.4.
Ownership is a dummy variable that takes the value equals one (D=1) if the firm is owned by a family and zero otherwise. This variable tries to capture the relationship proximity between the company with the borrower depending on the type of business and years of family management, as it was not possible to access the years of management and years of negotiation with the same banker and the company representative. The variable is used by Berger and Udell (1995) to measure if there is a difference on premium over the prime rate being applied to different typologies of companies, family or non-family owned business.
5. Data and Sample
On this chapter is intended to specify and explain the database that was assembled. Each variable will be defined and their expected outcome. Also, in this chapter it will be approached a descriptive statistics and preliminary analysis on the sample gathered.
5.1. Data Description
The data used was extracted from data base SABI covering the 2010-2017 period. SABI database contributes with historical information of Portuguese and Spanish companies.
To construct the financial variables, balance sheet and income statement variables were extracted for all 380,000 Portuguese active companies in SABI. Afterwards, it was necessary to compute the following financial data: Interest rate by year, Leverage by year, Profit Margin by year, Quick Ratio by year, Current Ratio by year, Accounts Payables and Receivables by year, Total Assets in Thousands by year, Return on Assets by year and Interest rate coverage ratio. Adding to the previous variables, it was also extracted soft variables such as; the number of banks on the last year available, type of ownership on the last year available and the geographical location. Due to the lack of information of database of SABI, the number of companies in the database dropped significantly.
To study the impact of relationship lending on interest rates in Portuguese SMEs, larger companies were excluded from the database. This means that companies that had one of the following two characteristics were excluded: companies that have more than 250 employees or having more than EUR 50 Million in Sales. Also, companies operating on the financial sector such as
Banks, insurance, as well as public traded companies and companies ran by State were deleted from the sample.
It was necessary to exclude 5% of companies with extreme values located on the tail. This necessity arrives from the fact that the values computed from interest rates are inflated with other costs, such as factoring costs, other fees, etc. The variables on the model to study the impact of relationship lending are the non-financial “soft” variables: number of banks, ownership and geographical location as discussed in the literature review. Variable of ownership and location were introduced manually to the data base. Ownership variable had to be seen company by company to see the type of ownership that reins on each company. For the geographical location, it was seen all the locations that exist on the metropolitan areas of Lisbon and Porto, afterwards it was checked on the database the companies located on those areas.
With all the data treatment, the final sample size has 4478 Portuguese SMEs that comprehend the period between 2010-2017.
Table 1: Geographic Location Observations Interest Rate
Metropolitan Area 1523 3.70%
Non - Metropolitan Area 2955 3.27%
Table 1 indicates the average interest rate paid to the lender by geographical location of the borrower in Portugal. The biggest difference on this study is how geographical location variable was threated. Companies located on metropolitan areas of Lisbon and Porto, where more population is concentrated as well as financial institutions, versus companies that are not located on the two most populated areas.
On this sample we can observe that two thirds of the total sample are located outside the most populated area, where bank competition is somehow less than comparing to metropolitan areas. These companies located outside
metropolitan areas are paying on average less 0.47% bps when comparing to companies located in metropolitan areas.
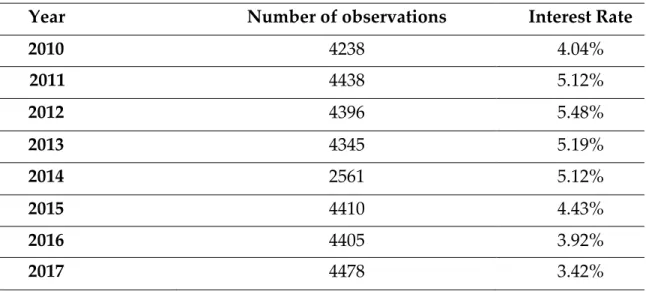
Table 2 indicates the average interest rate paid to the lender by year from 2010 to 2017.
It is observable on the sample gathered the effect of financial crisis that Portugal was hit at the end of 2010 until 2014, year that Portugal bailout programme was finish, on interest rates paid by companies to banks regarding their loans. During those years due to economic uncertainty, the interest rates were higher (Gong et al., 2018). The bottom was hit on 2013 with companies paying on average 5.48% of interest rates for their loans. We can observe that after 2013 there is a trend of reduced interest rate year-over-year due to the fact of there is less uncertainty and so less risk. In the last obtainable year, on average companies were paying 3.42% for their loans, which represents a decrease of 206 bps since the peak on 2013.
Table 2: Interest rate by year Panel B: Interest Rate by Year
Year Number of observations Interest Rate
2010 4238 4.04% 2011 4438 5.12% 2012 4396 5.48% 2013 4345 5.19% 2014 2561 5.12% 2015 4410 4.43% 2016 4405 3.92% 2017 4478 3.42%
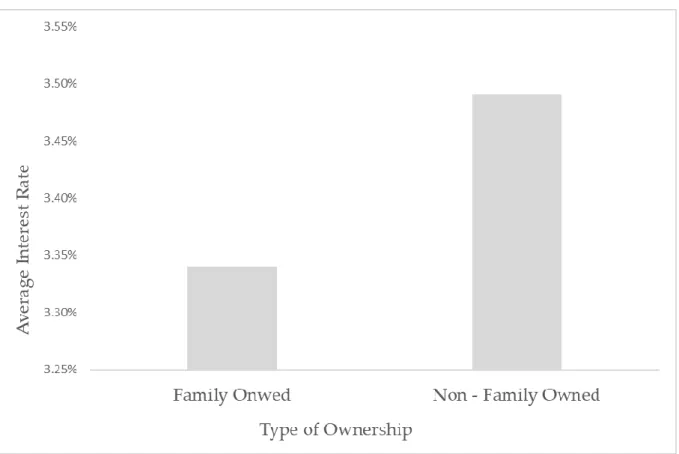
Table 3: Type of Ownership Observations Interest Rate
Family Owned 2834 3.34%
Non – Family Owned 1644 3.49%
Table 3 shows the average interest rate paid to the lender by the type of ownership, this is, if a company is family held or if it a non-family company.
This result show that there is more family business than non-family companies, more than 6 companies for each 10 existing companies in Portugal are family businesses. We can observe that the difference on the interest rates paid to the lender of family business is relatively smaller by 14 bps than non-family companies.
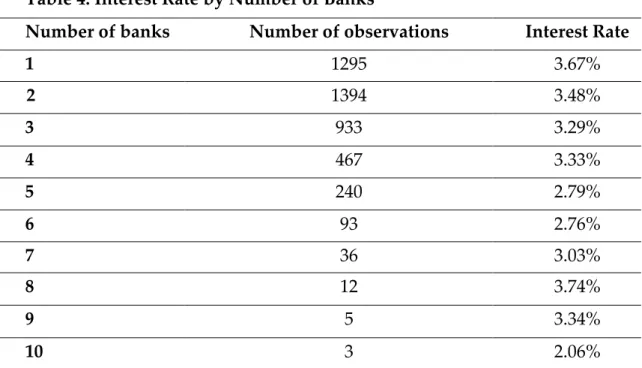
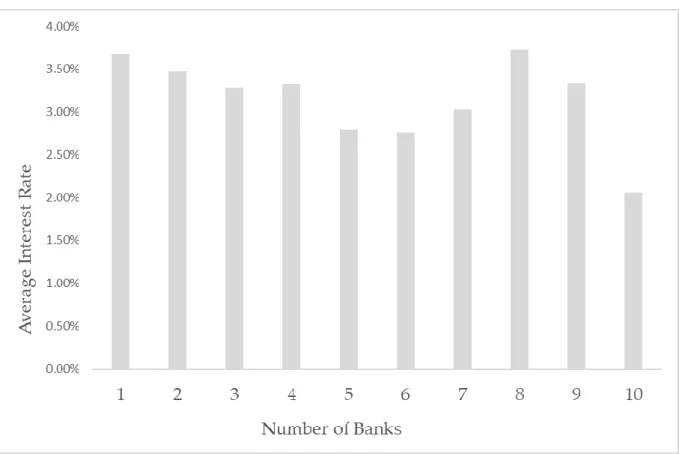
Table 4 provides information on the average interest rates by the number of banks that a company is currently borrowing from.
On this panel it is observable that most companies are currently negotiating with less than three banks. With only 3% of the sample working with six Banks or more. The results suggest that companies borrowing exclusively from one
Table 4: Interest Rate by Number of Banks
Number of banks Number of observations Interest Rate
1 1295 3.67% 2 1394 3.48% 3 933 3.29% 4 467 3.33% 5 240 2.79% 6 93 2.76% 7 36 3.03% 8 12 3.74% 9 5 3.34% 10 3 2.06%
Table 4 – Average interest rate by number of banks Table 3 – Average interest rate by ownership type
bank are paying more for their loans than companies working with more than one bank. The difference is around 19 bps when comparing to companies borrowing from two different banks and 38 bps when comparing with three banks. This effect seems to reverse with too many lenders, with six lending relationships being the most beneficial to companies and afterwards interest rates start to increase significantly, although the number of observations after seven banks, start to reduce sharply which might mean that the average interest rate paid to lenders with seven or more banks might not be reliable due to low observations. The results suggest that working with multiple lenders is more beneficial than working with an exclusive lender (Peterson and Rajan, 1994; Bharath et al., 2011; Cenni et al., 2015; Matias Gama and Van Auken, 2015). This does not automatically eliminate the possibility that companies negotiating with exclusivity are more prepared to adverse events such as financial crisis (Carmignani and Omiccioli, 2007).
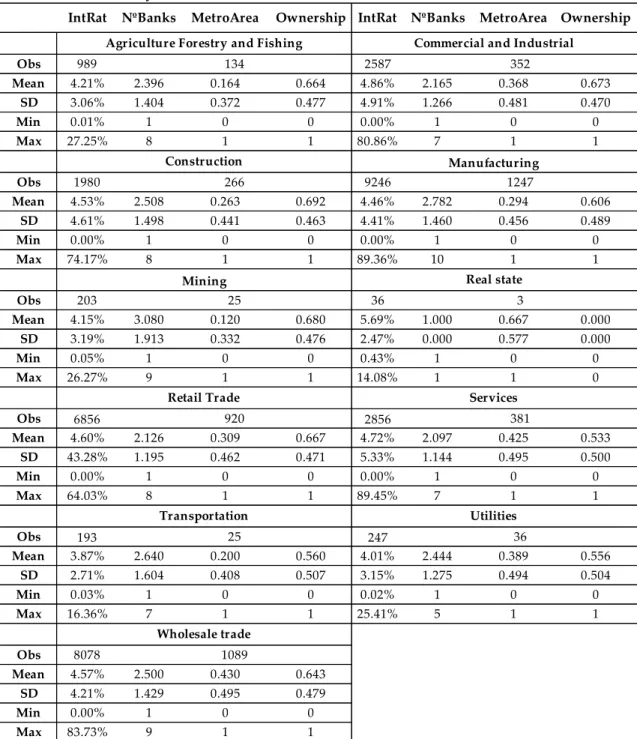
Table 5 demonstrates the average interest rate, number of banks, percentage of companies in metropolitan area and percentage of family business by sector of business.
We can conclude that the three largest sectors in Portugal account for 72.6% of the total number of firms in the sample gathered, and these sectors are Manufacturing (27.7%), Wholesale trade (24.3%) and Retail trade (20.6%). On
IntRat NºBanks MetroArea Ownership IntRat NºBanks MetroArea Ownership
Obs 989 2587 Mean 4.21% 2.396 0.164 0.664 4.86% 2.165 0.368 0.673 SD 3.06% 1.404 0.372 0.477 4.91% 1.266 0.481 0.470 Min 0.01% 1 0 0 0.00% 1 0 0 Max 27.25% 8 1 1 80.86% 7 1 1 Obs 1980 9246 Mean 4.53% 2.508 0.263 0.692 4.46% 2.782 0.294 0.606 SD 4.61% 1.498 0.441 0.463 4.41% 1.460 0.456 0.489 Min 0.00% 1 0 0 0.00% 1 0 0 Max 74.17% 8 1 1 89.36% 10 1 1 Obs 203 36 Mean 4.15% 3.080 0.120 0.680 5.69% 1.000 0.667 0.000 SD 3.19% 1.913 0.332 0.476 2.47% 0.000 0.577 0.000 Min 0.05% 1 0 0 0.43% 1 0 0 Max 26.27% 9 1 1 14.08% 1 1 0 Obs 6856 2856 Mean 4.60% 2.126 0.309 0.667 4.72% 2.097 0.425 0.533 SD 43.28% 1.195 0.462 0.471 5.33% 1.144 0.495 0.500 Min 0.00% 1 0 0 0.00% 1 0 0 Max 64.03% 8 1 1 89.45% 7 1 1 Obs 193 247 Mean 3.87% 2.640 0.200 0.560 4.01% 2.444 0.389 0.556 SD 2.71% 1.604 0.408 0.507 3.15% 1.275 0.494 0.504 Min 0.03% 1 0 0 0.02% 1 0 0 Max 16.36% 7 1 1 25.41% 5 1 1 Obs 8078 Mean 4.57% 2.500 0.430 0.643 SD 4.21% 1.429 0.495 0.479 Min 0.00% 1 0 0 Max 83.73% 9 1 1 920 25
Agriculture Forestry and Fishing
Wholesale trade Transportation Retail Trade
Mining Construction
Table 5: Interest Rate by Sector
1089
Commercial and Industrial
Manufacturing Real state Services Utilities 352 381 134 266 1247 25 3 36
the other end Real state accounts for (0.1%) and for that reason it will not be included while analysing table 2 content.
The sector that is most penalized on the interest rates is the commercial and Industrial sector that on average paid 4.86% on the period studied contrasting with the Transportation sector paying 3.87%, a difference of 99 bps. Comparing the three largest sectors, Manufacturing (4.46%), Wholesale trade (4.57%) and Retail trade (4.6%). We can observe that these sectors are balanced in terms of rates paid, with a difference of 14 bps when comparing the most and least paid.
When comparing the mean of number of banks’ lending by sector we can see that the Mining sector is the industry that is currently borrowing from most banks, with the mean being 3 banks. By contrast the Services sector is negotiating with only 2 banks on average. When observing the three largest sectors on the sample, we have Manufacturing (2.78), Wholesale trade (2.5) and Retail trade (2.12). The number of banks by sector differs from sector to sector the most with the difference from Manufacturing and Retail trade being reasonable high. We can also observe a trend on these sectors that the lower the number of banks a company is currently working with, the higher is the interest rate paid for the loan.
It is observable that all sectors have mostly their companies located outside the areas of Metropolitan area of Porto and Metropolitan area of Lisbon with the Services and Wholesale trade sectors being the most divided within all sectors, with 4.3/10 companies being in metropolitan areas. Contrasting with sectors of Agriculture, Forestry, Fishing and Mining sectors, that 83.6% and 88% respectively, of companies are located outside the areas most populated of Portugal. When observing the three largest industries in Portugal we see that Manufacturing (29.4%), Wholesale trade (43%) and Retail trade (30.9%) seems that there is no trend between location and rates paid to the lender.
Also on the sample obtained, most of the sectors are considered a family business with the sector being owned mostly by families counting as much as almost 70% of the companies in Construction being family business, on the other hand, Services is the sector that is less linked to families, although, still most of the companies are family related business as we can see with 53.3% being family owned. When comparing the three largest sectors, it seems that the ratio is balanced, with Manufacturing (60.6%), Wholesale trade (64.3%) and Retail trade (66.7%). It is perceptible that there is a possible trend on these sectors, with the sector being less relatable to family business being the one that pays less interest rates. This is without looking at the bigger picture and examining without all variables, including the control variables that are not shown on the table.
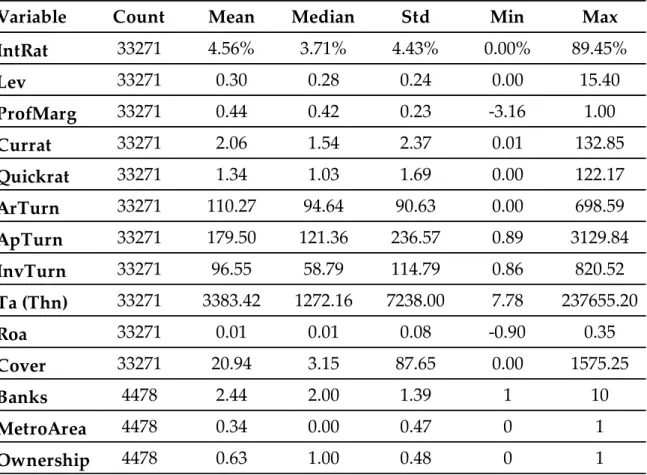
5.2. Descriptive Statistics
In this section we can analyse the statistics of the full sample and explain the mean company on our universe.
The sample is composed by 33271 observations or 4478 companies. As observable from table 6, 34% of the sample is in metropolitan areas, showing a dominance of firms being outside the metropolitan areas of Porto and Lisbon. The sample is showing that most of companies in Portugal are family owned businesses with 63% of the full sample being owned by a family. SMEs in the sample have a mean of 2.44 relationship lending banks and a median of 2.
Looking at financial characteristics we can observe that the mean(median) company pays 4.56% (3.71%) of interest to the bank, has around 30% (28%) Debt and 70% (72%) Equity, with total assets being around 3 383 420 (1 272 160). Profit margin is at 44% (42%) with a low return on assets 1% (1%). A low return on assets means that the company is producing low income from the use of its assets, this effect is more usual on some industries than others. This ratio is the financial characteristic that is most prejudicial to the companies, showing that there is room to improve the use of their assets to produce income.
It is perceptible that the average company is comfortable paying their interest, with a high coverage ratio of 20.94 (3.15), the higher the ratio, easier it should be to make interest payments on loans. The sample gathered shows that Portuguese companies can meet their short-term obligations with their most liquid assets, a current ratio of 2.06 (1.54) indicates that companies have 2.06€ (1.54€) of liquid assets available to cover each Euro of current liabilities. When not considering the inventory of a firm, since inventory takes time to turn itself into cash to pay off debt, quick ratio, still shows that Portuguese companies are prepared to meet their short-term obligations with a ratio of 1.34 (1.03) indicating that the company gave 1.34€ (1.03€) of liquid assets available for each Euro of current liabilities. Although a high ratio, can also indicate that
companies current assets are not being efficiently used or is not managing its working capital well, as suggested by Nobanee (2009) finding that current ratios and quick ratio is negatively associated with firm’s performance.
We can observe that companies are selling their inventory faster than receiving the amount in debt by their clients, 96.55 (58.79) days to 110.27 (94.64) days. The perfect scenario would be if companies were receiving from their clients faster than selling their inventory, which would mean that their clients are pre-paying and risk would be less to the company. Although, companies are having their expenses postponed, meaning there are paying receiving from clients faster than paying to their suppliers which is a wealthy signal to the company cash flow statement. The mean difference is 69.23 (26.72) days in favour of the company.
Variable Count Mean Median Std Min Max
IntRat 33271 4.56% 3.71% 4.43% 0.00% 89.45% Lev 33271 0.30 0.28 0.24 0.00 15.40 ProfMarg 33271 0.44 0.42 0.23 -3.16 1.00 Currat 33271 2.06 1.54 2.37 0.01 132.85 Quickrat 33271 1.34 1.03 1.69 0.00 122.17 ArTurn 33271 110.27 94.64 90.63 0.00 698.59 ApTurn 33271 179.50 121.36 236.57 0.89 3129.84 InvTurn 33271 96.55 58.79 114.79 0.86 820.52 Ta (Thn) 33271 3383.42 1272.16 7238.00 7.78 237655.20 Roa 33271 0.01 0.01 0.08 -0.90 0.35 Cover 33271 20.94 3.15 87.65 0.00 1575.25 Banks 4478 2.44 2.00 1.39 1 10 MetroArea 4478 0.34 0.00 0.47 0 1 Ownership 4478 0.63 1.00 0.48 0 1
5.3. Preliminary Analysis
In this section we try to predict the coefficient signal of each variable by considering all the data reunited until the moment as well as the literature review and the results obtained by the main papers used in this master thesis.
5.3.1. Financial characteristics
Considering the literature review and the statistics of the data base gathered, the impact of each variable on interest rates, should be as follows:
Leverage might be a ratio that can be related to the default probability of a company and so this financial characteristic is expected to have a positive relationship with interest rate dependent variable. Ferri and Murro (2015) explain it by the higher the leverage ratio of a firm, higher the probability of default and by that, there is an additional risk associated to the loan. Due to that increased risk, a higher leverage ratio means that the company probability of being credit rationed increases and so banks ask for a higher premium on rates. The rationale is confirmed by Bharath et al., (2011). A company with higher leverage will pay a higher rate due to default risk, concluding that it has a positive relationship and being statistically significant. On the other, Berger and Udell (1995) show that leverage ratio was not statistically significant to explain the premium over the prime rate. On this study, we are expecting a positive relationship between leverage and the dependent variable – interest rate.
Profit Margin variable is expected not to impact the interest rates according to Berger and Udell (1995). However Diamond, (1984), show that higher interest rates charged to a company where the type is unknown to the lender, will reduce the profit margin and so the firms will realize riskier projects where the return can be higher but also with more risk embedeed. And so a positive coefficient is expected.
Current ratio and Quick ratio variables are similar variables as seen previously and so current ratio is expected , according to Bharath et al. (2011) to have a negative relationship with the interest rates, this meaning that the lower the capability of a firm to pay short term obligations within a year, the higher the interest rate is being charged for that risk.The result on this study is statistically significant at 1% level. The variable quick ratio was only used on Berger & Udell (1995) paper, with a negative impact to interest rates. On this study its expectable the same findings as Bharath et al. (2011).
The financial turnover variables: accounts receivables, accounts payables and inventory turnover - are used on the study by Berger & Udell (1995) and the coefficients are negative on inventory turnover and accounts payable, while positive on accounts receivables and so these coefficients are expected on this study as well. On this study we are expecting to have the same findings as Berger & Udell (1995), which is that these variables will not be significant to explain interest rate dependent variable.
Return on assets variable is studied on papers trying to explain credit rationing. The study of Ferri and Murro, (2015) concluded that the variable ROA is determinant on explaining credit rationing. According to the study, there is a negative relationship, which means that the higher the ROA, lower is the probability of the company being rationed. The logic is that companies that are statistically more probable of being rationed are companies which have weaker financial wealth and are less prepared to face short-term expenses. According to this rationale, is expectable to have a negative relationship between interest rate dependend variable and ROA financial independent variable. This is, a good management of the assets to generate income to the company, reduces the rate paid to the lender.
The total assets control variable is expected to have a negative relationship, meaning that the more assets a company has, lower the rate on interest.
According to Berger and Udell, (1995); Bharath et al, (2011), total assets have a negative relationship with the premium paid over the prime rate, having an great significante when explaining the interest rates paid.
Interest coverage variable is expected, according to a study realized by Bharath et al., (2011) to have a negative relationship with interest rates. The study concluded that a better ratio of earnings compared to financial expenses impacts the rates by reducing the interest rate yearly that a company has to pay to the bank. So, on this study is is expecable to find the same result, coverage ratio being statistically significant and having a negative relationship with rates.
5.3.2. Relationship lending characteristics
When analysing the number of banks on figure 1 and literature, we can see that there might be a slight negative relatioship between the interest rate and the number of banks, suggesting that it is possible that in Portugal, the more banks a SME is currently negotiating with, the lower the interest rate. Studies on this subject are not all in agreement. Ssome studies, such as Peterson and Rajan, (1994; Bharath et al., (2011); Cenni et al., (2015), find that the interest rates are lower when having fewer lending relationships. The result obtained on these articles seems to be contrarian to the results in figure 1, which suggests that an increase in banking relationships is beneficial to the borrowers. However, according to Diamond, (1984) and Matias Gama and Van Auken, (2015), having only one lending relationship will not be beneficial, but by the contrary, the bank knowing that there is an exclusive relationship will demand more interest, and so, starting a monopolistic relationship. Nevertheless, having a monopolistic can bring other benefits to the firm, such as reducing the possibility of defaulting or failing during a financial crisis (Carmignani and Omiccioli, 2007).
Geographical area variable is the variable that studies the impact of distance to the lender and also, be related to banking competition, that is different between metropolitan areas and non metropolitan areas. Studies on this subject suggests that costs of borrowing increase when there is a more competitive environment, due to the fact that when there is less competition in the market, banks are incentivized to invest more in soft information (Bonini et al. 2016) Fungácová et al. 2017). Transposing the information to this study, it is expectable that firms on metropolitan areas, where there is more competition, pay higher interest rates to the lender. However these findings are not consistent with the study of Elsas (2005) that concluded that relationship lending is more likely when the banking competition increases.
A study by Agostino and Trivieri (2018) concluded that SMEs tend to be geographically close to the credit provider. It is more beneficial because it can be gathered more soft information about the firm (Patti and Gobbi, 2001; Peterson and Rajan, 2002), meaning that SMEs that are more distant to urban
areas, will have higher costs because of this information disadvantage and so banks will charge higher rates (Arena and Dewally, 2012).
Figure 2 indicates that the results found on Portuguese SMEs located on metropolitan areas are paying higher rents to the lender when comparing to companies that are more distant to urban areas, contradicting the results of (Patti and Gobbi, 2001; Peterson and Rajan, 2002) but are in line with (Bonini et al., 2016); Fungácová et al., 2017).
Ownership variable was approached on the study of Berger and Udell, (1995), although the result was that the it had a positive coefficient, meaning that family owned firms on that study would pay more interest comparing to non family business.
On this study, as we can observe on figure 3, it seems to suggests that family owned SMEs have a lower interest rate comparing to non-family owned business and so we expect the opposite result from the study mentioned earlier.
6. Results
In this section, the results of the OLS regression will be displayed for all the variables of the model and those results will be compared with previous literature that have studied the impact of relationship lending on interest rates.
6.1. Results of relationship variables
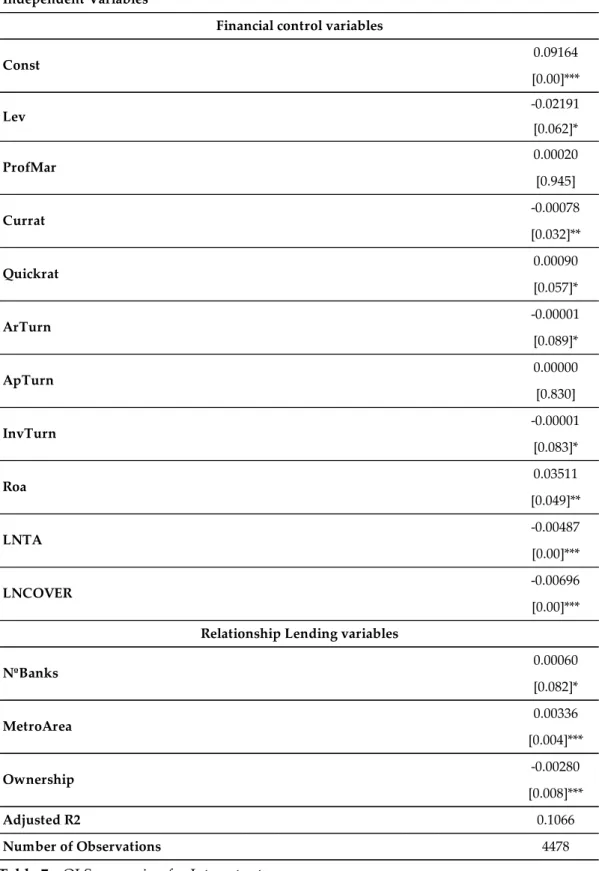
In order to find the answers to the hypothesis presented in chapter 3, it was used equation on chapter 4, for the reasons presented at each chapter. The results are presented on table 7.
Note: It was controlled for year fixed/effects * Statistically Significant at the 10% level; ** Statistically Significant at the % level;
*** Statistically Significant at the 1% level.
All Firms IntRat [1] 0.09164 [0.00]*** -0.02191 [0.062]* 0.00020 [0.945] -0.00078 [0.032]** 0.00090 [0.057]* -0.00001 [0.089]* 0.00000 [0.830] -0.00001 [0.083]* 0.03511 [0.049]** -0.00487 [0.00]*** -0.00696 [0.00]*** 0.00060 [0.082]* 0.00336 [0.004]*** -0.00280 [0.008]*** Adjusted R2 0.1066 Number of Observations 4478 Lev InvTurn Roa LNTA LNCOVER NºBanks Dependent variable Independent Variables ProfMar Currat Quickrat ArTurn MetroArea Ownership Const
Financial control variables
Relationship Lending variables ApTurn