Procedural Fairness, the Economy, and Support for Political
Authorities
Pedro C. Magalhães Luís Aguiar-Conraria
Institute of Social Sciences Economics Department and NIPE University of
Lisbon University of Minho
Av. Prof. Aníbal de Bettencourt, 9 Campus de Gualtar
1600-189 Lisbon 4710-057 Braga
Portugal Portugal
pedro.magalhaes@ics.ul.pt lfaguiar@eeg.uminho.pt
Forthcoming at Political Psychology (submitted pre-print version)
Abstract:A vast literature in social and organizational psychology suggests that support for authorities is driven both by the outcomes they deliver to people and by the extent to which they employ fair decision-making processes. Furthermore, some of that literature describes a process-outcome interaction, through which the effect of outcome favorability is reduced as process fairness increases. However, very few studies have been conducted to determine whether such interaction is also present in the explanation of support for political authorities. Here, we start by analyzing whether individual perceptions of the political system’s procedural fairness moderate the well-known individual-level relationship between perceived economic performance and government approval. Then, we explore the implications of such process-outcome interaction to the
phenomenon of “economic voting,” testing whether impartiality in governance moderates the effect of objective economic performance on aggregate incumbent parties’ support. In both cases, we show that the interaction between processes and outcomes seems to extend beyond the organizational contexts where it has been previously observed, with important implications for the study of political support.
Keyword: procedural fairness; process-outcome interaction; political support; executive approval; economic voting
1. Introduction
How do people evaluate those in positions of authority? A vast research in the fields of social and organizational psychology has reached a central finding: those evaluations seem to be affected both by the extent to which authorities generate favorable outcomes and by the extent to which they employ decision-making procedures perceived as being fair (Lind and Tyler 1988). But can the fairness of the procedures also affect how much people end up caring about the outcomes? A large literature looking what happens at courts, police stations, classrooms, or workplaces suggests that this is so. Procedural fairness seems to matter in more than one way. First, it increases support for authorities and satisfaction with/acceptance of those authorities and their decisions. But second, in what is “perhaps the most robust finding in the justice literature” (Colquitt et al. 2001: 438), a process-outcome interaction also seems to occur, through which outcome favorability and procedural fairness interact in the explanation of support for authorities and their decisions (Brockner and Wiesenfield 1996 and 2005; Brockner 2011). To put it simply, good processes can mitigate the negative effects of detrimental outcomes.
The generic question addressed in this study is whether, empirically, this process-outcome interaction extends beyond the “micro” and “meso” levels of interactions between individuals and with organizations to the level of their relationship with macro-level political authorities and the outcomes they generate. As we shall see in greater detail later, attempts at answering this question are, to our knowledge, very scarce. The nature of “outcomes” under consideration in the few existing studies has varied considerably, including the perceived quality of public services, objective economic performance, perceived economic performance, public investment decisions, or even “political” outcomes such as being on the winning or losing side of
an election. Methods and data have also varied, ranging from experimental studies to
observational country case and cross-national studies. And yet, these few works, when looking at people’s support for political authorities, have mostly focused on objects that, rather than being constituted by political authorities proper — “those who are responsible for the day-to-day actions taken in the name of a political system” (Easton 1975: 437) — are instead more abstract and diffuse, such as “the functioning of democracy” or “trust in politicians”.1
In this paper, we aim at developing this line of research by presenting two different studies focusing on support for political authorities proper, more specifically, for incumbent governments. The first employs individual-level data. It uses survey data from 29 European countries to test the hypothesis that the relationship between citizens’ perceptions of economic performance and their approval of the government is moderated by the perception of the extent to which procedural fairness prevails in the functioning of the political system. The second study, in turn, illustrates how the insights derived from the first one may be consequential and applied to the kind of analyses many political scientists and political economists have performed when looking at the relationship between economic outcomes and political support. In particular, it employs aggregate election results and macro-level measures of economic growth and
procedural fairness in the OECD countries, testing the hypothesis that the relationship between objective economic outcomes and electoral support for the incumbent parties is moderated by procedural fairness, captured here by aggregate perceptions of the extent to which one of the core dimensions of fairness — impartiality — prevails in the functioning of the government. In this way, we combine the use of data both on objective economic outcomes and how they are subjectively perceived, as well as both on aggregate and individual-level measures of both
1 The partial exception is Bøggild (2015), who has also looked at intention to vote for decision-makers in three of the experimental studies presented.
procedural fairness and specific support for the government.
In both studies, we find a relevant process-outcome interaction in mass politics. We believe this is particularly relevant for the broad research agenda that looks at the determinants of specific support for the government and the government parties. First, this finding increases the plausibility that the process-outcome interaction detected in the psychological literature may in fact be a rather broad phenomenon, extending to attitudes and behaviors more frequently examined by political scientists. Second, it has important direct implications for the very large literature that has focused on support for the government as a function of the economy, the instability of that function, and the factors that may account for it.
The paper is divided into five sections. Following this introduction, we briefly review the literature on the relationship between outcome favorability, procedural fairness, and political support, discuss the process-outcome interaction in the psychological literature, and how such interaction has been explored so far in the study of political support. Section three presents the results of a first study on government approval in European societies, while the following section presents the results of a second study on electoral support for incumbent parties in the OECD democracies. Finally, section five concludes, discussing the findings and their implications.
2. Outcomes, fairness, and political support
Two pieces of the puzzle that engages us here — the process-outcome interaction in the explanation of political support — seem to be, on the basis of extant literature, already firmly in place. The first of those pieces is the abundant evidence that, as it occurs in many other sorts of social exchanges (Blau 1964; Homans 1961), support for political authorities seems to increase when people are at the receiving end of beneficial or favorable outcomes, particularly economic
ones. To be sure, several aspects of what has been called “the vote and popularity (V-P) function” or the “economic voting” research agenda remain the object of lively discussion.2 However, at the most general level, it is hardly disputed that there is a positive relationship between, on the one hand, the ability of governments to generate real or perceived positive economic outcomes (Nannestad and Paldam 1994; Lewis-Beck and Stegmeier 2000 and 2013) or to distribute benefits to voters before elections (Drazen and Eslava 2010; Manacorda et al. 2011; Pop-Elches and Pop-Elches 2012) and, on the other hand, support for the government.
A second piece of the puzzle is also in place: attitudes towards political authorities and institutions are positively affected by procedural fairness in decision-making. Procedural fairness has long been understood in different, albeit theoretically and empirically
complementary ways. It includes processes that award people the ability to exercise voice, giving them an opportunity to introduce inputs in decision-making (Thibaut and Walker 1975; Folger 1977); impartiality or neutrality in decision-making, i.e., the extent to which decisions are made in an evenhanded and unbiased way (Tyler and Huo 2002); respect or standing, involving a dignified treatment of people by authorities and giving them reasoned explanations for decisions (Lind and Tyler 1988); or trustworthiness, resulting from authorities conducting themselves in a way that generates the belief that fair treatment will continue in the future (Tyler and Lind 1992).3 The general concept is central for other disciplines as well, including not only political theory (from Locke to Rawls, see Klosko 2000) but also economics, where the term “procedural utility” has been employed to capture the notion that people have also “preferences about how outcomes are generated” (Frey and Stutzer 2005: 92; see also Frey, Benz, and Stutzer 2004).
A variety of observational and experimental studies operationalizing one of more of these
2 See, for example, Wlezien, Franklin and Twiggs (1997), Stevenson and Duch (2013), Lewis-Beck et al. (2008), and Gomez and Wilson (2006).
elements of procedural fairness have shown that it fosters political support, including for local or national governments (Tyler and Caine 1981); political leaders (Tyler, Rasinski, and McGraw 1985); courts and other legal authorities (Tyler, Casper, and Fisher 1989; Benesh 2006; Ramirez 2008); legislatures, legislators, and the law-making process (Hibbing and Theiss-Morse 1995 and 2002; Farnsworth 2003; Gangl 2003); executive officeholders (Rasinski and Tyler 1988;
Kershaw and Alexander 2003); acceptance of concrete government decisions (Grimes 2006)4 and judicial rulings (Zink et al. 2009); and even the endorsement of functioning of the political system as a whole (Carman 2010; Linde 2012; Erlingsson, Linde, and Öhrvall 2014; Dahlberg & Holmberg 2014).
The third piece of the puzzle concerns, precisely, the process-outcome interaction. Meta-analyses (Brockner and Wiesenfield 1996) and reviews of the social and organizational
psychology literatures (Brockner and Wiesenfield 2005; Brockner 2011), looking at studies examining outcomes as diverse as job promotions or judicial and police decisions, and using dependent variables capturing individuals’ satisfaction with, commitment to, and support for authorities, show that “across a wide variety of studies, high procedural fairness has indeed been found to reduce the effect of outcome favorability on people’s support for decisions, decision-makers, and organizations, relative to when procedural fairness is low” (Brockner and
Wiesenfield 2005: 548).
Why should this be the case? A first argument stresses the role of procedures in affecting the time horizons of citizens in the pursuit of self-interested gains: when individuals perceive that procedures are impartial, predictable, and enduring, and particularly that those procedures allow individuals some amount of influence in way decisions are made (Thibaut & Walker 1975), it becomes reasonable for them “to expect long-term gains, even in the absence of short-term
gains” (Lind and Tyler 1988: 224). A second argument is that unfair procedures trigger
“referential thinking,” a comparison between the outcomes actually obtained and those that could have been obtained if circumstances had been different (Kahneman and Tversky 1982). As a result, the gap thus created between actual and referent outcomes increases resentment vis-à-vis authorities when outcomes are negative (Folger 1986). A third and related argument is that procedures shape attributions of responsibility for outcomes. Particularly when outcomes are negative, low process fairness is likely to generate the feeling that they could have been avoided if different procedures had been adopted. As a result, individuals tend to blame authorities more forcefully for negative outcomes under low fairness conditions (Folger and Cropanzano 1998). Finally, “relational” theories point to the transformational effect that procedural fairness, particularly when also understood in its dimensions of respect/standing and trustworthiness, operates in the social relationship between people and authorities: under fairness, immediate outcomes becomes less important in comparison with the intangible benefits that are obtained from fair treatment. Conversely, in its absence, such relationship becomes purely transactional, heightening the importance of outcomes and self-interested considerations on satisfaction (Tyler and Lind 1992).
The evidence for the existence of such process-outcome interaction in the realm of mass politics remains, however, scarce and fragmentary. Kumlin (2004: 180-281) looks at whether the satisfaction with democracy in Sweden results from an interaction between public satisfaction with the provision of social services and the extent to which people felt they had opportunities to affect how those services were run (voice). However, he finds no such interaction. Similarly, in a set of experimental studies, Bøggild (2015) finds no significant interaction effects between decision-maker impartiality and the favorability of outcomes in the explanation of support for the
decision-maker.
In contrast, studies based on cross-national survey data have supported the existence of a process-outcome interaction. Focusing on the favorability of political outcomes, in this case “winning” or “losing” an election, Dahlberg and Linde (2016) show that the “satisfaction with democracy” gap between election “winners” and “losers” becomes smaller the more the electoral process in the country is considered to be fair and the more the legal and judicial systems in the country are seen to work fairly. Conversely, in studies focusing on the favorability of economic outcomes, Magalhães (2016 and 2017) shows that the relationship between either evaluations of the current state of the economy or objective economic indicators and satisfaction with national democracies among European publics is weaker under greater fairness perceptions or conditions.
One encouraging aspect about these latter studies supporting a process-outcome interaction in mass politics is their level of generality, resulting from employing high quality mass survey data from a large variety of countries. One disadvantage, however, concerns the dependent variable. “Satisfaction with democracy,” in spite of recent positive validation studies (Quaranta 2017), remains a contested concept (Canache, Mondak, and Seligson 2001; Linde and Eckman 2003). It fits somewhat awkwardly in most conceptualizations of political support, defined either in terms of different “objects” (the political community, the regime, and political authorities) or different “types (“diffuse” vs “specific” support). In this paper, we attempt to preserve generalizability and external validity while employing mostly uncontested measures of support for political authorities proper: the extent to which respondents in nationally
representative surveys approve of the government’s job (study 1), and the extent to which citizens vote for incumbent parties (in study 2).
3. Study one: economic evaluations, government job approval, and procedural fairness.
For this study, we employ data from the European Social Survey, round 6, applied to national representative samples of the 15 year-old and above populations of 29 countries (ESS Round 6 2012). What makes ESS round 6 particularly interesting for our purposes is the fact that it included a module on “Europeans' understandings and evaluations of democracy,” where respondents were asked about the extent to different attributes of governance applied to their own political system. Although the questionnaire was not designed for that specific purpose, a few of the questions employed capture theoretically important dimensions of procedural fairness in governance. Lind and Tyler, for example, propose that the perception of fairness in decision-making is composed of three main elements (1992: 141-148). The first, neutrality (or
impartiality), consists on “evenhanded treatment of all involved”. In the survey, we are able to approach this dimension by gauging the extent to which respondents perceive that “The courts in [country] treat everyone the same”. 5 The second aspect, standing, results from authorities
treating people in a way that is respectful of their rights and opinions. The survey lacks a direct measure of this, but contains a question capturing people’s perceptions of a likely antecedent of standing: the extent to which people perceive that, in their country, “the government explains its decisions to voters”. Finally, trust involves the belief that the authority makes genuine attempts at being fair and ethical and, most importantly, that it intends to do so in the future (Tyler and Lind 1992: 142). Here, we employ trust in the central representative institution of each country’s political system, “the [country’s] parliament”. On the basis of these items, we constructed a
procedural fairness variable, whose values are the regression based scores following factor
analysis with varimax rotation.6
Crucially for our purposes, ESS round 6 also contains questions gauging both support for the incumbent and citizens’ economic evaluations. On the one hand, we look at government job
approval as our dependent variable, which is captured by individual responses to the question
“Now thinking about the [country] government, how satisfied are you with the way it is doing its job?”. On the other hand, ESS includes a measure of citizens’ economic evaluations, particularly a sociotropic one (about the national economy): “On the whole how satisfied are you with the present state of the economy in [country]?” We expect that the relationship between those economic evaluations and government job approval should be positive, but also moderated by perceived procedural fairness: the higher the level of procedural fairness, the weaker the relationship between those economic evaluations and government approval should be.
We employ several controls. First, for partisanship: Close to incumbent party is a dummy variable constructed on the basis of responses to the question “Is there a particular political party you feel closer to than all the other parties?” Using the ParlGov database (Döring and
Manow 2017), we determined, first, the parties in government at the time the ESS survey was conducted in each country, and then recoded responses as 1 if the party the respondent felt closest to was included in the cabinet coalition or (for the cases of France and Russia) supported the president. Second, we also control for ideological self-placement. It is based on the response to the question “Where would you place yourself on this scale, where 0 means the left and 10 means the right?,” but is recoded depending on whether the head of the executive belonged to a
6 Exploratory factor analysis for the pooled sample shows that perceptions that courts treat everyone the same, that government explains its decisions to voters, and trust in parliament form a single factor with an eigenvalue greater than 1.0. One-factor confirmatory analysis yields loadings of .80 (courts), .73 (explains decisions), and .58 (trust in parliament), all significant at p<.001, with CFI=1.000, RMSEA=.000, and pclose=1.000. The Cronbach's alpha coefficient is .74. Confirmatory factor analysis by country shows significant coefficients and good fit in all countries. Results of this analysis are available with the authors.
party on the right or the left. In the former cases, we left the variable untransformed, while in the latter we just reversed the scale. We expect both variables to have a positive relationship with government approval. Finally, we include a dummy variable capturing whether the respondent is at the moment unemployed, which we expect to have a negative relationship with supporting the government. Female, age, and subjective social status are the remaining controls.
Analysis of nested data — individuals within countries — such as the one employed here, can be appropriately performed in several different ways (Arceneaux and Nickerson 2009; Huang 2016). However, given that the research question in this study is situated at the individual level — the effects on support of “level 1 variables” such as economic evaluations and
procedural fairness perceptions and their interaction on government job approval — a fixed effects approach seems preferable. In other words, we will regress government approval not only on the variables described above but also on 28 dummy variables, each representing the country (i.e., the grouping variable). Given that variability associated with the cluster level is of no substantive interest to this analysis, a fixed effects approach has the advantage of accounting for all observed and unobserved second-level variables, a particularly important advantage in cases where — such as this one — second-level groups (countries) were not randomly selected (Huang 2016: 192). Table 1, in the first column, shows the main results. Coefficients are standardized by dividing all non-binary inputs by two standard deviations (Gelman 2008).
Table 1 about here
As we can see, both individuals’ evaluations of the current state of the national economy and procedural fairness are very strongly related with government job approval. The result of the
former seems, at first sight, particularly striking: the coefficient basically implies that moving from the low to the high end of economic evaluations is associated with an increase of about 2.5 points in the 0 to 10 scale of government job approval, i.e., about one standard deviation in the dependent variable. This effect takes place when controlling for both partisanship and ideology, and is larger than that the effects of either one of them.
However, upon closer inspection, that should not really be seen as the most striking aspect of the results. The contiguity in the questionnaire between the government job approval and the national economic evaluation items, their similarity in wording, and the fact that the question about the economy came immediately before — basically priming respondents to think about the economy when evaluating the government’s job — can be largely responsible for this very strong estimate of the effect of economic evaluations on government approval. What is striking, instead, is that in spite of the more than likely survey context effect we are observing, we can also see that, first, the main effect of procedural fairness is almost as large as that of economic evaluations and, second, that procedural fairness still manages to emerge as a relevant moderator of the relationship between economic evaluations and government job approval. This can be seen in the significant coefficient of the interaction term, which is negative: the higher the procedural fairness, the smaller the effect of economic evaluations, as expected.
We need to take into account here the possibility that perceptions of procedural fairness may not be the only relevant moderator of the relationship between economic evaluations and government approval. In this respect, “foremost on the list of influential individual
characteristics is political information level” (Kayser 2014:124). There is disagreement, however, in what direction that takes place. While there are studies pointing to the possibility that the more sophisticated voters are more likely to rely on national economic conditions when
evaluating the government (Krause 1997; Godbout and Bélanger 2007), others point to the exact opposite conclusion (Gomez and Wilson 2001 and 2006). In any case, we need to determine whether the estimated process-outcome interaction survives when this additional moderation mechanism is taken into account. Based on Turper and Aarts’s (2017) work on the ESS, we constructed a high sophistication dummy variable, coded 1 if the respondent has a university degree and declares to be “interested” or “very interested” in politics, which we then interact with economic evaluations. The results are in column 2 of Table 1. We also explore the data further by splitting the sample. The third and fourth columns show the results when we simply split the sample between individuals with high and low sophistication, contemplating the
possibility that government approval may be determined differently for individuals with different levels of political sophistication.
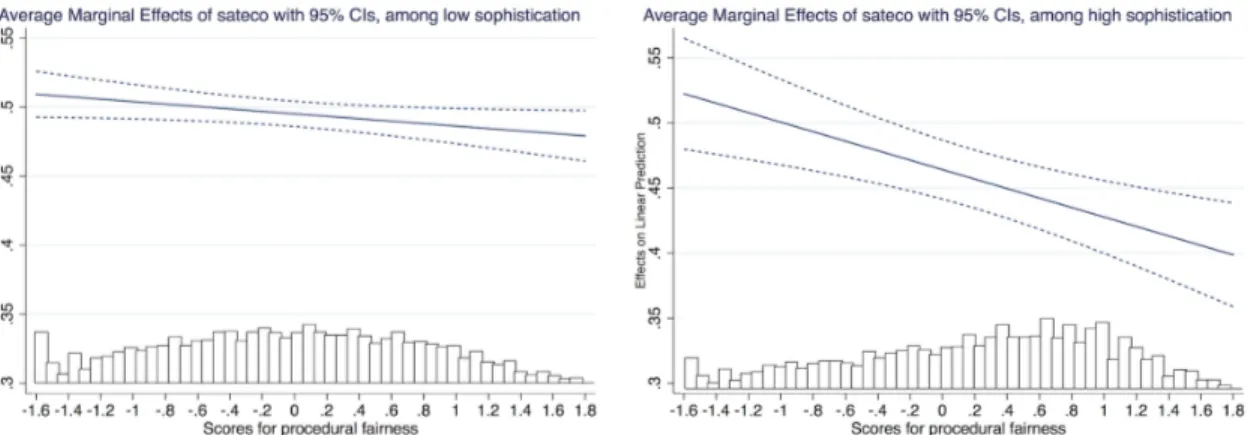
The results suggest that individuals with high levels of sophistication do seem to be somewhat less likely to rely on national evaluations of the economy to evaluate the government’s job. Most importantly, inclusion of sophistication and its interaction with economic evaluations does not change the main process-outcome interaction result. Splitting the sample shows that most variables (with the exception of gender and subjective social class) that seem consequential for highly sophisticated individuals also seem consequential for the other respondents. However, there is an interesting difference of relevance to us, which can be better appreciated visually in Figure 1, which plots, both for low and high sophistication respondents, the estimated average marginal effect of a one-point improvement in national economic evaluations on government job approval, conditional on perceived procedural fairness. On the one hand, regardless of whether we focus on the highly sophisticated individuals or the others, the process-outcome interaction is present, with the effect of economic evaluations becoming weaker as perceived procedural
fairness increases. On the other hand, that interaction effect seems to be much stronger among the most sophisticated respondents.
Figure 1 about here
To be sure, the purpose of this study was to establish the existence of a process-outcome interaction in the explanation of support for political authorities, rather than explaining
variability in the magnitude of that interaction. Furthermore, existing studies about aspects that may work themselves as moderators of the process-outcome interaction have pointed out to features such as individuals’ personality traits (Skarlicki, Folger, and Tesluk 1999), their social status (Chen, Brockner, and Greenberg 2003; Haferd 2013), their uncertainty about their standing as members of organizations (De Cremer et al. 2010), or the extent to which they see themselves as connected to others (Brockner at al. 2000), none of them obviously illuminating to account for our result. However, it is important to recall that, in the several theoretical
mechanisms advanced in the literature to explain the process-outcome interaction, a common thread is that such interaction largely results from people’s motivation and ability to obtain procedural information. Faced with a particular outcome, individuals need to try and make sense of what happened and why. “One way to make sense of outcomes is to pay attention to the process through which they came about or to the process that accompanied them, which would have the effect of heightening the impact of process fairness information” (Brockner 2010: 8). This suggests that the process-fairness interaction is to a great extent a result of that “sense-making” activity, through which people make inferences about responsibility, “how things could have been,” the nature of their relationship with authorities, and about future outcomes. In this
light, it is understandable that stronger seekers of political information are more likely, in their reaction to outcomes, to draw on and be conditioned by process fairness information.
4. Study two: economic growth, incumbent support, and procedural fairness.
The greater the perceived procedural fairness in governance, the weaker seems to be the relationship between perceived economic performance and government support among European publics. A possible question that follows is whether this process-outcome interaction can also be observed when we aggregate up, i.e., from individual perceptions and evaluations to macro-level indicators of economic performance, incumbent support, and procedural fairness. How would one proceed to explore this insight in light of the “V-P function” and “economic voting”
literatures? Is the established effect of, say, economic growth on the incumbent parties’ share of the vote that political scientists and political economists have observed in a myriad of studies (Lewis-Beck and Stegmaier 2013) moderated by procedural fairness?
The first necessary step in this direction is to find a measure of procedural fairness at the macro-level. Here, we employ Undue Influence, from the Global Competitiveness Report (GCR) of the World Economic Forum. GCR has been computing and publishing scores of a variety of indices derived from their Executive Opinion Survey (the Survey) of business leaders around the world. These indices are available since 2006 in comparable form. Undue Influence is a variable constructed on the basis of responses to two items of the survey, about the extent to which “the judicial system in each country is independent from influences of the government, individuals, or companies” and “government officials show favoritism to well-connected firms and individuals when deciding upon policies and contracts”. In other words, for each country/year covered in the survey, Undue Influence provides a measure of the extent to which governmental institutions are
perceived to behave impartially vis-à-vis different interests, organizations, and individuals. Values range from 1 to 7, with higher values denoting greater impartiality.7 Tellingly, the aggregate level correlation between the sample means, for each of the 29 countries (in the respective survey fieldwork year), of the regression based scores following factor analysis employed in the previous study (our ESS-based measure of procedural fairness) and the Undue
Influence scores from GCR for those European countries reaches .91, suggesting we are on the
right track in what concerns capturing procedural fairness at the aggregate level.
In order to determine whether the relationship between economic performance and incumbent support is moderated by our measure of impartiality, we use economic data from OECD countries, to assure data comparability and quality. Our measure of economic
performance is the growth rate of real GDP compared to the same quarter of the previous year, seasonally adjusted (GYSA), measured in the quarter preceding the one when each election in each country took place.8 As a measure of incumbent support in each election, we use the % share of the vote of the parties that were in government at the time of that election (Incumbent
vote share). We are interested in “first-order” elections, i.e., the elections in this period that
directly (presidential in Chile, France, Mexico, South Korea, United States) or indirectly
(legislative elections in the remaining parliamentary systems) contributed to the formation of the executive. In presidential elections, the vote share of the candidate that was supported by the party of the incumbent president is considered. To determine election date, Incumbent vote
7 In our sample, Undue Influence ranges from 2.34 (Slovakia 2016) to 6.26 (Sweden 2010), with a mean of 3.96 and a standard deviation of 1.04. For further details on this and all other variables employed in the study, check the Online Appendix.
8 In our sample, GYSA ranges from -8.4% (Greece for 2012) to 25.5% (Ireland for 2016), with a mean of 3.6% and a standard deviation of 4.2%. It is important to note that, for Ireland, as the highly deviant figure for 2015-2016 suggests, a very large share of GDP is accounted for by the profits of foreign firms, making it a misleading measure of domestic economic performance (Honohan and Walsh 2002: 43-44). Thus, we also estimated all models in the paper excluding the Irish case. All main substantive results stand, and are available with the authors. See also footnote 11.
share, the % share of the vote of those same parties in the preceding election (Previous vote share), and all variables about cabinet composition, we use the ParlGov database (Döring and
Manow 2017). After excluding a few cases that should or could not be included, we will employ data from 92 elections in 32 democracies from 2006 to 2016.9
We are using here time-series, cross-section data, but from unbalanced panels and where we obviously do not have observations for all countries in all years. Dassonneville and Lewis-Beck (2014: 382), dealing with similar data, endorse the use of a linear cross-sectional time-series model, including the Previous vote share (PVS) to address autocorrelation problems — note that using the Previous vote share is akin to the typical lagged dependent variable —, fixed effects through unit (country) dummies accounting for non-observed heterogeneity and omitted variable bias, and panel corrected standard errors.10
Table 2 shows the results of models looking at the effects of GDP growth (GYSA), procedural fairness, and their interaction on the vote share of incumbent parties. We expect both economic growth and our measure of procedural fairness to have a positive effect on incumbent vote share, but also that the effect of economic growth should decrease as impartiality increases. In other words, given that Undue Influence is coded from low to high level of impartiality, we expect the coefficient for interaction term to be negative. And as we can see in the first column, indeed both economic growth and procedural fairness have a positive effect on incumbent vote share, and their interaction is negative and statistically significant.
9 Check the Online Appendix for details.
10 Given extant debates about how to analyze data such as those employed in this study (Wilson and Butler 2007), we employed alternative estimation strategies for all analyses performed in study 2: the Beck and Katz (1995, 1996) approach to the analysis to TSCS data — OLS, PVS, and PCSE but without fixed effects, given the risk of rejecting effects of “slow moving” variables; a random-effects model using the GLS estimator, estimating country cluster-robust standard errors, which allow for both heterocedasticity and autocorrelation (RE); and a fixed effects model using the within regression estimator, also estimating country cluster-robust standard errors (FE). All substantive results discussed here are unaffected. Results are available with the authors.
Table 2 about here
For illustration purposes, Figure 2 shows the estimated average marginal effect of GDP growth on the vote for the incumbent across the real range of values of Undue Influence in the sample, based on the results of model 1, as well as a stacked histogram showing the distribution of the moderator variable. As procedural fairness increases, the marginal effect of growth on the electoral performance of incumbent parties decreases.11
Figure 2 about here
There are reasons, however, to fear that this finding might be driven by a rather different mechanism from that which is proposed here. On the one hand, several studies have suggested that, while voters hold accountable in approval polls and in elections those incumbents who are seen to abuse their power for private gain, they tend to so most clearly when national economic conditions are worse (Choi and Woo 2010; Zechmeister and Zizumbo-Colunga 2013; Rosas and Manzetti 2015). Theoretically, this proposes that corruption among government politicians has negative electoral effects and that such effects are moderated by the economy, a rather different explanation of incumbent support from the one proposed here. However, to the extent that lack of impartiality in governance may be correlated with politicians’ abuse of power for private gain, it is conceivable that our results may be driven by this interaction that several studies have
11 The negative relationship between GDP growth and incumbent electoral performance found at very high levels of
Undue Influence seems to be driven by an outlier: the case of Ireland (see footnote 8). Once Ireland is excluded, the
marginal effect of GDP growth still declines with increased Undue Influence, as expected, and becomes not significantly different from zero for Undue Influence values above 4.6.
already found. On the other hand, it has also been shown that the connection between the economy and the vote for the incumbent tends to be stronger in younger and less institutionalized democracies (Hellwig 2010: 192-194). Conceivably, to the extent that older and more established democratic regimes could be characterized by more impartial governance, our result might also be driven by this moderation process.
However, results for models 2 and 3 in Table 2 show that neither seems to be the case. The Corruption Perceptions Index (CPI) is available for all our observations between 2006 and 2016, and is based on data from a variety of institutional sources that monitor perceptions among business people and experts about the extent to which “any kind of abuse of entrusted power for private gain” takes place within the government or government bodies. Countries’ governments receive a score every year from 0 to 10, from high to low perceptions of corruption. Age of
democracy is the log of the number of consecutive years that a country has had a Polity score of
6 or higher up to the year of the election, on the basis of the Polity IV dataset. Once these variables and their interaction are alternatively included in models 2 and 3 in Table 2, our main result is unaffected, while those other hypothesized interactions fail to materialize. In sum, as we hypothesized, the higher the level of impartiality vis-à-vis different interests, organizations, and individuals among state institutions, the weaker the relationship between economic performance and the vote shares for the incumbent parties.
5. Conclusion
An important literature in organizational and social psychology, looking at people’s relationship with authorities in workplaces, courts, and similar contexts, suggests not only that people care about what they get and how they get it, but also that “people’s tendencies to respond better when their outcomes are more favorable is reduced when process fairness is high rather
than low” (Brockner 2010: xvii). In this paper, we posed the question of whether these findings also apply when the decision-making authorities under examination are political ones, in particular, national governments. We presented two empirical studies. First, using survey data from 29 European countries, we show that the relationship between sociotropic evaluations of the economy and government approval, which has been largely supported by the political science literature, seems in fact to be moderated by individuals’ perception of procedural fairness in their political system, especially (but not only) among the most politically sophisticated voters.
Second, using a dataset of elections in the OECD countries from 2006 to 2016, and employing available measures of economic performance, impartiality in governance, and election returns for government parties, we show that the effect of GDP growth on the electoral support of
incumbents diminishes as impartiality in governance increases.
What may be the implications of this? The obvious first is that there are good reasons to believe that a mechanism that has been long been shown by psychologists to apply to events and decisions in other contexts also travels to the study of political support for national governments. Second, these results also speak to a long-standing concern in the study of the relationship between economic outcomes and political support: such relationship seems at the same time to be “powerful” (Lewis-Beck and Stegmaier 2000: 211) and yet also “sadly lacking in stability” (Paldam 1991: 9). A recent study looking at a very large sample of elections in 86 countries similarly concludes “although there is a long literature on the effect of economic growth in elections, we found little to suggest a global rule (…), suggesting that the effects of economic factors are moderated by country-specific factors.” (Kennedy, Wojcik, and Lazer 2017: 518). Our results suggest that one of those “country-specific factors”, which ultimately is also grounded in individual-level perceptions and processes, is the extent to which governance,
decision-making, and policy-making are characterized by the fundamental elements of procedural fairness.
Important limitations of these findings must also be acknowledged. First, it remains the case that the only study of which we are aware that experimentally manipulates decision-maker impartiality and outcome favorability and tests for their interaction in the explanation of trust in and support for the decision-making has failed to find support for that interaction (Bøggild 2015). Further experimental research, not only using different profiles of subjects and in different societal and cultural contexts but also exploring alternative operationalizations of “procedural fairness” in political decision-making and of the kind of economic and policy outcomes explored here, would be particularly important at this point. Second, even within the realm of observational studies, the evidence amassed here corresponds, for data availability and quality reasons, and with few exceptions, to a non-random subset of high-income Western economies, societies, and democracies, with a level of “institutional quality” that, by all
indicators, should be well above the world’s average. How well do these findings travel to other contexts? Third, the survey items and — especially — the aggregate data available to capturing perceptions of procedural fairness in governance leave aside important dimensions, such as transparency (de Fine Licht et al. 2014) or voice (Thibaut and Walker 1975; Folger 1977), for example. Which of these dimensions might be more relevant for the process-outcome interaction effect in the explanation of political support? Finally, and relatedly, we have not explored the specific theoretical mechanism that may be behind the process-outcome interaction that was found, and particularly on whether it results from the longer time horizons, referential thinking, changes in responsibility attributions, or the increased salience of intangible benefits instilled by procedural fairness.
Overcoming these limitations should be at the forefront of further efforts in this line of research. We aimed, nonetheless, at showing such line is a promising one, not only to better understand the fundamentals of political support — including the apparent instability in the relationship between economic outcomes and executive support — but also, by looking at what leads to incumbents being punished and rewarded for outcomes in different institutional
contexts, to understand how such contexts may shape the leeway elected governments enjoy in their relationship with citizens and their incentives to promote different outcomes in a
References
Arceneaux, K., & Nickerson, D. W. (2009). Modeling certainty with clustered data: A comparison of methods. Political Analysis, 17(2), 177-190.
Beck, N., & Katz, J. N. (1995). What to do (and not to do) with time-series cross-section data.
American political science review, 89(03), 634-647.
Beck, N., & Katz, J. N. (1996). Nuisance vs. substance: Specifying and estimating time-series-cross-section models. Political analysis, 6(1), 1-36.
Benesh, S. C. (2006). Understanding public confidence in American courts. Journal of
Politics, 68(3), 697-707.
Blau, P. M. (1964). Exchange and power in social life. Transaction Publishers.
Bøggild, T. (2016). How Politicians’ Reelection Efforts Can Reduce Public Trust, Electoral Support, and Policy Approval. Political Psychology, 37(6), 901-919.
Brockner, J. (2011). A contemporary look at organizational justice: Multiplying insult times
injury. New York, NY: Routledge.
Brockner, J., & Carter, A. (2015). Toward the fifth wave: justice as a dependent variable. In S. W. Gilliand, D. D. Steiner & D. P. Starlicki (Eds.) The social dynamics of organizational
justice. Charlotte, NC: Information Age Publishing, pp. 251-284.
Brockner, J., & Wiesenfeld, B. M. (1996). An integrative framework for explaining reactions to decisions: interactive effects of outcomes and procedures. Psychological bulletin, 120(2), 189.
Brockner, J., & Wiesenfeld, B. M. (2005). How, When, and Why Does Outcome Favorability Interact with Procedural Fairness? In J. Greenberg & J. A. Colquitt (Eds.), Handbook of
Organizational Justice. Mahwah, NJ: Lawrence Erlbaum Associates, pp. 525-553.
Brockner, J., Chen, Y. R., Mannix, E. A., Leung, K., & Skarlicki, D. P. (2000). Culture and procedural fairness: When the effects of what you do depend on how you do
it. Administrative Science Quarterly, 45(1), 138-159.
Canache, D., Mondak, J. J., & Seligson, M. A. (2001). Meaning and measurement in cross-national research on satisfaction with democracy. Public Opinion Quarterly, 65(4), 506-528.
Carman, C. (2010). The process is the reality: Perceptions of procedural fairness and participatory democracy. Political Studies, 58(4), 731-751.
you?” The effects of relative status, outcome favorability, and procedural fairness. Organizational Behavior and Human Decision Processes, 92(1), 1-21.
Choi, E., & Woo, J. (2010). Political corruption, economic performance, and electoral outcomes: A cross-national analysis. Contemporary Politics, 16(3), 249-262.
Colquitt, J. A., Conlon, D. E., Wesson, M. J., Porter, C. O., & Ng, K. Y. (2001). Justice at the millennium: A meta-analytic review of 25 years of organizatioanl justice research. Journal
of Applied Psychology, 86(3), 424-424.
Dahlberg, S., & Holmberg, S. (2014). Democracy and Bureaucracy: How their Quality Matters for Popular Satisfaction. West European Politics 37(3), 515-537.
Dahlberg, S., & Linde, J. (2016). Losing Happily? The Mitigating Effect of Democracy and Quality of Government on the Winner–Loser Gap in Political Support. International
Journal of Public Administration, 39(9), 652-664.
Dassonneville, R., & Lewis-Beck, M. S. (2014). Macroeconomics, economic crisis and electoral outcomes: A national European pool. Acta Politica, 49(4), 372-394.
De Cremer, D., Brockner, J., Fishman, A., Van Dijke, M., Van Olffen, W., & Mayer, D. M. (2010). When do procedural fairness and outcome fairness interact to influence employees’ work attitudes and behaviors? The moderating effect of uncertainty. Journal of Applied
Psychology, 95(2), 291.
Drazen, A., & Eslava, M. (2010). Electoral manipulation via voter-friendly spending: Theory and evidence. Journal of development economics, 92(1), 39-52.
Döring, H., and Manow, P. (2017). Parliaments and Governments Database (ParlGov): Information on Parties, Elections and Cabinets in Modern Democracies. Available from www.parlgov.org, accessed July 2017.
Easton, D. (1975). A re-assessment of the concept of political support. British journal of political
science, 5(4), 435-457.
Erlingsson, G. Ó., Linde, J., & Öhrvall, R. (2014). Not so Fair after All? Perceptions of Procedural Fairness and Satisfaction with Democracy in the Nordic Welfare States.
International Journal of Public Administration, 37(2), 106-119.
Esaiasson, P., Persson, M., Gilljam, M., & Lindholm, T. (2016). Reconsidering the Role of Procedures for Decision Acceptance. British Journal of Political Science, 1-24. ESS Round 6: European Social Survey Round 6 Data (2012). Data file edition 2.3. NSD -
Norwegian Centre for Research Data, Norway – Data Archive and distributor of ESS data for ESS ERIC.
Farnsworth, S. J. (2003). Congress and citizen discontent: Public evaluations of the membership and one’s own representative. American Politics Research, 31(1), 66-80.
Frey, B. S., & Stutzer, A. (2005). Beyond outcomes: measuring procedural utility. Oxford
Economic Papers, 57(1), 90-111.
Frey, B. S., Benz, M., & Stutzer, A. (2004). Introducing procedural utility: Not only what, but also how matters. Journal of Institutional and Theoretical Economics JITE, 160(3), 377-401.
Folger, R. (1977). Distributive and procedural justice: Combined impact of voice and
improvement on experienced inequity. Journal of personality and social psychology, 35(2), 108.
Folger, R. (1986). Rethinking equity theory. In HW Bierhoff, RL Cohen, & J. Greenberg (Eds.),
Justice in social relations. New York, NY: Plenum. pp. 145-162.
Folger, R. G., & Cropanzano, R. (1998). Organizational justice and human resource
management (Vol. 7). Thousand Oaks: Sage.
Gangl, A. (2003). Procedural justice theory and evaluations of the lawmaking process. Political
Behavior, 25(2), 119-149.
Gelman, A. (2008). Scaling regression inputs by dividing by two standard deviations. Statistics
in medicine, 27(15), 2865-2873.
Godbout, J. F., & Bélanger, É. (2007). Economic voting and political sophistication in the United States: A reassessment. Political Research Quarterly, 60(3), 541-554.
Gomez, B. T., & Wilson, J. M. (2001). Political sophistication and economic voting in the American electorate: A theory of heterogeneous attribution. American Journal of Political
Science, 899-914.
Gomez, B. T., & Wilson, J. M. (2006). Cognitive heterogeneity and economic voting: A comparative analysis of four democratic electorates. American Journal of Political
Science, 50(1), 127-145.
Grimes, M. (2006). Organizing consent: The role of procedural fairness in political trust and compliance. European Journal of Political Research, 45(2), 285-315.
Hellwig, T. (2010). Elections and the Economy. In LeDuc, L., Richard, G., & Norris, P. (eds)
Comparing democracies 3: Elections and Voting in the 21st Century. Thousand Oaks:
Sage.
Hibbing, J. R., & Theiss-Morse, E. (1995). Congress as public enemy: Public attitudes toward
Hibbing, J. R., & Theiss-Morse, E. (2002). Stealth democracy: Americans' beliefs about how
government should work. New York: Cambridge University Press.
Homans, G. C. (1961). Social behavior in elementary forms. A primer of social psychological
theories. Monterey, CA: Brooks/Cole Publishing Company.
Honohan, P., & Walsh, B. (2002). Catching up with the leaders: the Irish hare. Brookings papers
on economic activity, 2002(1), 1-57.
Huang, F. L. (2016). Alternatives to multilevel modeling for the analysis of clustered data. The
Journal of Experimental Education, 84(1), 175-196.
Kahneman, D., & Tversky, A. (1982). Availability and the simulation heuristic. In D. Kahneman, P. Slovic, & A. Tversky (Ed.), Judgment under uncertainty: Heuristics and biases New York: Oxford University Press, pp. 201–208.
Kayser, M. A. (2014). The Elusive Economic Vote. In LeDuc, L., Richard, G., & Norris, P. (eds). Comparing Democracies 4: Elections and Voting in a Changing World. Thousand Oaks: Sage.
Kennedy, R., Wojcik, S., & Lazer, D. (2017). Improving election prediction internationally.
Science, 355(6324), 515-520.
Kershaw, T. S., & Alexander, S. (2003). Procedural fairness, blame attributions, and presidential leadership. Social Justice Research, 16(1), 79-93.
Klosko, G. (2004). Democratic procedures and liberal consensus. Oxford: Oxford University Press.
Krause, G. A. (1997). Voters, information heterogeneity, and the dynamics of aggregate economic expectations. American Journal of Political Science, 1170-1200.
Krause, S., & Méndez, F. (2009). Corruption and elections: an empirical study for a cross-section of countries. Economics & Politics, 21(2), 179-200.
Kumlin, S. (2004). The Personal and the Political: How Personal Welfare State Experiences
Affect Political Trust and Ideology. New York, NY: Palgrave Macmillan US.
Lewis-Beck, M. S., & Stegmaier, M. (2000). Economic determinants of electoral outcomes.
Annual Review of Political Science, 3(1), 183-219.
Lewis-Beck, M. S., & Stegmaier, M. (2013). The VP-function revisited: a survey of the literature on vote and popularity functions after over 40 years. Public Choice, 157(3-4), 367-385. Lewis‐Beck, M. S., Nadeau, R., & Elias, A. (2008). Economics, party, and the vote: Causality
Lind, E. A., & Tyler, T. R. (1988). The social psychology of procedural justice. New York: Plenum Press.
Linde, J. (2012). Why feed the hand that bites you? Perceptions of procedural fairness and system support in post‐communist democracies. European journal of political research,
51(3), 410-434.
Linde, J., & Ekman, J. (2003). Satisfaction with democracy: A note on a frequently used indicator in comparative politics. European journal of political research, 42(3), 391-408. Linde, J., & Erlingsson, G. Ó. (2013). The eroding effect of corruption on system support in
Sweden. Governance, 26(4), 585-603.
MacCoun, R. J. (2005). Voice, control, and belonging: The double-edged sword of procedural fairness. Annu. Rev. Law Soc. Sci., 1, 171-201.
Manacorda, M., Miguel, E., & Vigorito, A. (2011). Government transfers and political support. American Economic Journal: Applied Economics, 3(3), 1-28.
Magalhães, P. C. (2016). Economic Evaluations, Procedural Fairness, and Satisfaction with Democracy. Political Research Quarterly, 69(3), 522-534.
Magalhães, P. C. (2017). Economic Outcomes, Quality of Governance, and Satisfaction with Democracy. In van Ham, C. et al. (eds). Myth and Reality of the Legitimacy Crisis:
Explaining Trends and Cross-National Differences in Established Democracies. Oxford:
Oxford University Press.
Murphy, K. (2017). Procedural justice and its role in promoting voluntary compliance. In P. Drahos (Ed.) Regulatory Theory: Foundations and applications. Acton: Australia National University Press.
Nannestad, P., & Paldam, M. (1994). The VP-function: A survey of the literature on vote and popularity functions after 25 years. Public Choice, 79(3), 213-245.
Paldam, M. (1991). How Robust is the Vote Function? In Economics and Politics: The Calculus
of Support, edited by H. Norpoth, M. Lewis-Beck and J. D. Lafay: University of Michigan
Press.
Pop-Eleches, C., & Pop-Eleches, G. (2012). Targeted government spending and political preferences. Quarterly Journal of Political Science, 7(3), 285-320.
Quaranta, M. (2017). How citizens evaluate democracy: an assessment using the European Social Survey. European Political Science Review, 1-27.
Ramirez, M. D. (2008). Procedural perceptions and support for the US Supreme Court. Political
Rasinski, K. A., & Tyler, T. R. (1988). Fairness and vote choice in the 1984 presidential election. American Politics Quarterly, 16(1), 5-24.
Rosas, G., & Manzetti, L. (2015). Reassessing the trade-off hypothesis: How misery drives the corruption effect on presidential approval. Electoral Studies, 39, 26-38.
Skarlicki, D. P., Folger, R., & Tesluk, P. (1999). Personality as a moderator in the relationship between fairness and retaliation. Academy of Management Journal, 42(1), 100-108. Stevenson, R. T., & Duch, R. (2013). The meaning and use of subjective perceptions in studies
of economic voting. Electoral Studies, 32(2), 305-320.
Thibaut, J. W., & Walker, L. (1975). Procedural justice: A psychological analysis. L. Erlbaum Associates.
Turper, S., & Aarts, K. (2017). Political Trust and Sophistication: Taking Measurement Seriously. Social Indicators Research, 130(1), 415-434.
Tyler, T. R., & Caine, A. (1981). The influence of outcomes and procedures on satisfaction with formal leaders. Journal of Personality and Social Psychology, 41(4), 642.
Tyler, T. R., & Huo, Y. (2002). Trust in the law: Encouraging public cooperation with the police
and courts through. Russell Sage Foundation.
Tyler, T. R., & Lind, E. A. (1992). A relational model of authority in groups. Advances in
experimental social psychology, 25, 115-191.
Tyler, T. R., Rasinski, K. A., & McGraw, K. M. (1985). The Influence of Perceived Injustice on the Endorsement of Political Leaders1. Journal of Applied Social Psychology, 15(8), 700-725.
Tyler, T. R., Casper, J. D., & Fisher, B. (1989). Maintaining allegiance toward political
authorities: The role of prior attitudes and the use of fair procedures. American Journal of
Political Science, 33 (3), 629-652.
Wilson, S. E., & Butler, D. M. (2007). A lot more to do: The sensitivity of time-series cross-section analyses to simple alternative specifications. Political Analysis, 15(2), 101-123. Wlezien, C., Franklin, M., & Twiggs, D. (1997). Economic perceptions and vote choice:
Disentangling the endogeneity. Political Behavior, 19(1), 7-17.
Zechmeister, E. J., & Zizumbo-Colunga, D. (2013). The varying political toll of concerns about corruption in good versus bad economic times. Comparative Political Studies, 46(10), 1190-1218.
Figure 1. The estimated average marginal effect of national economic evaluations on government
job approval, across the range of values of procedural fairness, among respondents of low (left) and high (right) political sophistication.
Figure 2. The estimated average marginal effect of GDP growth on the share of votes for incumbent parties across the range of values of impartiality (Undue Influence).
Table 1. Economic evaluations, procedural fairness, political sophistication and government approval (OLS, with country fixed-effects not shown; standardized coefficients)
Variables All respondents All respondents High sophistication Low sophistication
Evaluation national economy 2.54***
(.02) 2.55*** (.02) 2.40*** (.06) 2.56*** (.02) Procedural fairness 1.65*** (.03) 1.65*** (.03) 2.01*** (.09) 1.60*** (.04) Procedural fairness*Ev. national economy -.10**
(.03) -.10** (.03) -.31*** (.09) -.08* (.04) High sophistication - .14** (.05) - -
High sophistication*Ev. national economy - -.10*
(.05)
- -
Close to incumbent party .83***
(.02) .83*** (.02) .86*** (.05) .81*** (.02) Ideological self-placement .63*** (.02) .63*** (.02) .67*** (.04) .62*** (.02) Unemployed -.04 (.03) -.04 (.03) -.07 (.10) -.03 (.03) Female .10*** (.02) .10*** (.02) .07 (.04) .10*** (.02) Age .02 (.02) .02 (.02) .01 (.05) .02 (.02)
Subjective social status .12***
(.02) .11*** (.02) .06 (.05) .11*** (.02) Constant .80*** (.07) .79*** (.07) 1.25*** (.21) .76*** (.08) R2 Respondents Countries .57 42,889 29 .57 42,656 29 .59 6,505 29 .57 36,151 29 *p<.05; **p<.01;***p<.001 (two-tailed tests)
Table 2. GDP growth, Undue Influence, and the electoral performance of incumbent parties (country fixed effects not shown, panel corrected standard errors, control for previous voter share)
Variables
Model 1 Model 2 Model 3
GYSA 4.76*** (.79) 4.41*** (.79) 4.74*** (1.34) Undue Influence 11.90*** (2.12) 11.08*** (2.47) 10.41*** (2.27) Undue Influence*GYSA -.94*** (.14) -1.33*** (.31) -.65** (.23)
Corruption Perceptions Index (CPI) - 3.77
(2.48)
-
CPI*GYSA - .32
(.21)
-
Age of democracy (log) - - -14.30
(8.60)
Age of democracy (log)*GYSA - - -.36
(.52)
Previous vote share .53***
(.11) .48*** (.11) .53*** (.10) Constant -36.36** (11.67) -59.16*** (16.60) 30.37*** (43.64) N elections 92 N countries 32 *p<.05; **p<.01;***p<.001 (two-tailed tests)
Online appendix
On the data employed in Procedural Fairness, the Economy, and Support for Political Authorities Study one uses the European Social Survey Round 6 data, a set of surveys applied to national representative samples of the 15 year-old and above populations of 29 countries between (ESS Round 6 2012). Data was downloaded from
http://www.europeansocialsurvey.org/download.html?file=ESS6e02_3&y=2012.
Variables employed (all refusals, DK, and NA treated as missing values):
Original variables:
stfgov (How satisfied with the national government). Question: “Now thinking about the
[country] government, how satisfied are you with the way it is doing its job?”. From 0
(“Extremely dissatisfied”) to 10 (“Extremely satisfied”). Recoded into Government job approval.
stfeco (How satisfied with present state of economy in country). Question: “On the whole how
satisfied are you with the present state of the economy in [country]?” From 0 (“Extremely dissatisfied”) to 10 (“Extremely satisfied”). Recoded into Evaluation of national economy.
cttresac (In country the courts treat everyone the same). Question: “Using the same card please
tell me to what extent you think each of these statements applies in [country]. ‘The courts in [country] treat everyone the same?’” From 0 (“Does not apply at all”) to 10 (“Applies completely”).
gvexpdcc (The government explains its decisions to voters). Question: “Using the same card
please tell me to what extent you think each of these statements applies in [country]. ‘The government in [country] explains its decisions to voters.’” From 0 (“Does not apply at all”) to 10 (“Applies completely”).
trstprl (Trust in the country’s parliament). Question: “Using this card, please tell me on a score
of 0-10 how much you personally trust each of the institutions I read out. 0 means you do not trust an institution at all, and 10 means you have complete trust.
‘The [country]’s parliament.’” From 0 (“No trust at all”) to 10 (“Complete trust”).
gndr (Gender). Recoded into Female, so that Male is 0 and Female 1.
plinsoc (Your place in society). Recoded into Subjective social status. Question: “There are
people who tend to be towards the top of our society and people who tend to be towards the bottom. On this card there is a scale that runs from top to bottom. Where would you place yourself on this scale nowadays?” From 0 (“Bottom of our society”) to 10 (“Top of our society”).
agea (Age of respondent, calculated on the basis of yrbrn, “And in what year were you born?”).
Constructed variables
Procedural fairness: regression based scores following factor analysis with varimax rotation of cttresac, gvexpdcc and trstprl.
High sophistication: constructed on the basis of edulvlb (Highest level of education) and polintr
(How interested in politics), coded 1 if the respondent has a university degree and declares to be “interested” or “very interested” in politics, which we then interact with economic evaluations. Based on Turper and Aarts (2017).
Close to incumbent party: constructed on the basis of variables prtclal to prtclxk (Which party
feel closer to) for all countries. Using the ParlGov database (Döring and Manow 2017), we determined, first, the parties in government at the time the ESS survey was conducted in each country, and then recoded responses as 1 if the party the respondent felt closest to was included in the cabinet coalition or (for the cases of France and Russia) supported the president, and 0 for all other cases. For Albania, Chile, Kosovo, Mexico, Russia, South Korea, and Ukraine, we use media reports, crosschecked from different sources.
Ideological self-placement: constructed on the basis of variable lrscale (Placement on left right
scale). Recoded depending on whether the head of the executive belonged to a party on the right or the left. In the former cases, we left the variable untransformed, while in the latter we just reversed the scale. Source for party of head of executive: Döring and Manow (2017). For Albania, Chile, Kosovo, Mexico, Russia, South Korea, and Ukraine, we use media reports, crosschecked from different sources. In the cases of Switzerland and Russia, which for different reasons do not allow easy classification of the executive as “right” or “left,” we regressed the original left-right self-placement variable on government approval and found the coefficient to be positive. Thus, for the pooled analysis, we left the variable untransformed in those two cases.
Unemployed: dummy variable constructed on the basis of uempla and uempli, measuring
whether, respectively, respondents, in the last 7 days, were unemployed
Study two uses an original dataset, initially including all presidential elections in Chile, France, Mexico, South Korea, and the United States and all legislative elections in the remaining OECD countries that took place between 2006 and 2016, the period during which Undue Influence is available at the time of this writing. Not all “first-order” elections in all OECD countries from 2006 to 2016 ended up being included. Reasons for exclusion are:
1) Elections in countries that were not free electoral democracies at the time of the election, on the basis of Freedom House’s “Freedom in the World” country ratings (see
https://freedomhouse.org/sites/default/files/Country%20Ratings%20and%20Status%2C%201973 -2016%20%28FINAL%29_0.xlsx.) This leads to the exclusion of Turkey, as well as of elections in Mexico before 2000;
2) Elections that took place after caretaker cabinets with non-partisan prime ministers had been in office for more than one year. This leads to the exclusion of the 2011 and 2013 elections in Italy, following the Dini, Amato, and Monti governments, and of the Czech 2010 election, following the Fischer government.
3) Cases where parties listed as being part of the government at the time of the election did not run as such in that election, and either their successors or the parties they might have merged into could not be unambiguously identified. For this reason, we excluded the 2011 elections in
Ireland (PD); the 2006 (NPSI and PRI), and 2008 (RI, PdCI, FdV, and PoUD) elections in Italy; the 2013 (Haatz) elections in Israel; the 2007 elections in Korea; and the 2010 elections in Latvia (JL and PS). Note also that, because Previous vote share is employed as an independent variable, elections where any of the incumbent parties did not run for the preceding election and their eventual predecessors could not be unambiguously identified were also excluded: the 2011 elections in Switzerland (BDP) and the 2006 elections in Israel (Kadima);
4) Finally, given the panel structure of the data, countries where only one election could be included in the period were also excluded. In other words, given the combination of these constraints, Italy, Korea, and Turkey are excluded from our analysis of 2006-2016 elections in OECD countries.
Variables:
Incumbent vote share. The % share of the vote of the parties that were in government at the time
of each election. In presidential elections, the vote share of the candidate that was supported by the party of the incumbent president is considered. From (Döring and Manow 2017) for most countries. For Chile, Mexico, and South Korea, we use media reports, crosschecked from different sources. For the United States, we use data from the Federal Electoral Commission: https://transition.fec.gov/pubrec/electionresults.shtml.
Previous vote share. The % share of the vote in the preceding election of the parties that were in
government at the time of each election. Same source as before.
GYSA. The growth rate of real GDP, in %, compared to the same quarter of the previous year,
seasonally adjusted, measured in the quarter preceding the one when each election in each country took place. Data for each country/election come from OECD Statistics, available at: https://stats.oecd.org/index.aspx?queryid=350.
Undue Influence: constructed on the basis of responses to two items of the Global
Competitiveness Report (GCR) of the World Economic Forum’s Executive Opinion Survey (the Survey), about the extent to which “the judicial system in each country is independent from influences of the government, individuals, or companies” and “government officials show favoritism to well-connected firms and individuals when deciding upon policies and contracts”. Values range from 1 to 7, with higher values denoting greater impartiality. Available at:
Corruption Perceptions Index (CPI). Based on data from Transparency International, relying on
a variety of institutional sources that monitor perceptions among business people and experts about the extent to which “any kind of abuse of entrusted power for private gain” takes place within the government or government bodies. Countries’ governments receive a score every year from 0 to 10, from high to low perceptions of corruption. Available at
https://www.transparency.org/research/cpi/overview. Starting in 2012, the published scores were rescaled from 0 to 100. In our data, we preserve the 0 to 10 scale.
Age of democracy (log). the log of the number of consecutive years that a country has had a Polity score of 6 or higher up to the year of the election, on the basis of the Polity IV dataset. Available at: http://www.systemicpeace.org/polityproject.html. For Iceland and Luxembourg, absent from the dataset, we considered 1944 and 1945, respectively, as the starting year.
Both datasets, including all variables, are available with the authors.
References:
ESS Round 6: European Social Survey Round 6 Data (2012). Data file edition 2.3. NSD - Norwegian Centre for Research Data, Norway – Data Archive and distributor of ESS data for ESS ERIC.
Döring, H., and Manow, P. (2017). Parliaments and Governments Database (ParlGov): Information on Parties, Elections and Cabinets in Modern Democracies. Available from www.parlgov.org, accessed January 2018.
Turper, S., & Aarts, K. (2017). Political Trust and Sophistication: Taking Measurement Seriously. Social Indicators Research, 130(1), 415-434.