\marf
~
Getulio Vargas
EPGE
Escola de Pós-Graduação em Economia
Seminários de Pesquisa Econômica 11 (laparte)
"ELECTOBAL Il\TSTI'I'U'rIOl\TS
.,
CLEAVAGESTBUCTUBES,Al\TD
---TBE l\TUlVIBEB OI' PABTIES"
OCTAVIO AMORIM NETO
(Department of Political Science
-Uni versity of CalifomÍa)
Coordenação: Prof Pedro Cavalcanti Ferreira Tel: 536-9353
3;;L ,
•
..
•
ELECTORAL INSTITUTIONS, CLEA V AGE STRUCTURES,
AND THE NUMBER OF PARTIES*
by
Octavio Amorim Neto
and
GaryW. Cox
Department of Polítical Science University of Calífornia, San Diego
La JoIla, CA 92093-0521
September 1995
•
•
,.'
Abstract:
Electoral Institutions, Cleavage Structures, and the Number of Parties
Theory: A classic question in political science concems ",hat deteImines the number of parties
that compete in a given polity. Broadly speaking, there are two approaches to answering this
question, one that emphasizes the role of electorallaws in structuring coalitional incentives,
another that emphasizes the importance of pre-existing social cleavages. In tbis paper, we view
the number of parties as a product of the interaction between these two forces, following Powell
(1982) and Ordeshook and Shvetsova (1994).
Hypotheses: The effective number of parties in a polity should be a multiplicative rather than an
additive function ofthe peImissiveness ofthe electoral system and the heterogeneity ofthe
society.
Methods: Multiple regression on cross-sectional aggregate electoral statistics. Unlike previous
studies, we (1) do not confine attention to developed democracies; (2) explicitly control for the
influence of presidential elections, taking account of whether they are concurrent or
non-concurrent, and ofthe effective number ofpresidential candidates; and (3) also control for the
presence and operation of upper tiers in legislative elections.
Results: The hypothesis is confiImed, both as regards the number of legislative and the number
•
Electoral Institutions, Cleavage Structures, and the Number or Parties
The study of political parties and party systems is one of the largest subfields of political
science. Within this subfield, a classic question concerns what determines the number of parties
that compete in a given polity. Broadly speaking, there are two approaches to answering this
question, one that emphasizes the role of electorallaws in structuring coalitional incentives,
another that emphasizes the importance of pre-existing social cleavages.
The first approach--found in the work ofsuch scholars as Duverger (1954), Sartori (1968,
1976), Rae (1971), Lijphart (1990; 1994), Riker (1982), Taagepera and Shugart (1989), Palfrey
(1989), Myerson and Weber (1993), and Cox (1994 )--can be exemplified by what Riker has
dubbed Duverger's Law: the proposition that "the simple-majority single-ballot system [i.e.,
simple plurality mIe in single-member districts] favors the two-party system" (Duverger 1954, p.
217). The logic behind this proposition looks both to the incentives that face voters under the
plurality voting system (they will avoid wasting their votes on hopeless third party candidacies)
and to the incentives that consequently face elites (they will avoid wasting their time, money and
effort in launching what the voters wiIl perceive as hopeless candidacies, instead looking to form
coalitions of sufficient size to win a plurality).
The second approach--associated with the work of such scholars as Grumm (1958),
Eckstein (1963), Meisel (1963), Lipson (1964), Lipset and Rokkan (1967), Rose and Urwin
(l970)--can be exemplified by Lipset and Rokkan's famous freezing hypothesis: the proposition
.. that the European party systems stabilized or "froze" in the 1920s, and continued with the same
basic socially-defined patterns ofpolitical competition (and sometimes the same parties
competing) until at least the 1960s. The logic behind this proposition relies on an implicit notion
of social equilibrium to account for the longevity of the party systems spawned in early
•
•
The two approaches just sketched coexist uneasily. Some adherents of the sociological
school question whether Duverger's generalizations serve "any useful function at alI"' (Jesse
1990, p. 62); argue that the institutionalists have got the direction of causality backwards; I or
argue that the institutionalists have simply focused on a relatively unimportant variable, at the
expense of a relatively more important \'ariable--the number and type of c1eavages in society.~
Adherents ofthe institutionalist approach object to a beliefthat socially defined groups will
always be able to organize in the political arena, because this ignores the problem of collective
action (Olson 1965); or object to a beliefthat social groups wiIl always organize as parties,
because tbis assumes that "going it alone" is always a better strategy than forging coalitions; or argue that politicians can take sociaIly defined groups and combine or recombine them in many
ways for political purposes (Schattschneider 1960)--so that a given set of social c1eavages does
not imply a unique set of politically activated cIeavages, and hence does not imply a unique party
system.3
Despite these differences, however, the two approaches are not mutually excIusive. To
assert that social structure matters to the formation and competition of parties--which noone
denies, when the point is stated in such a broad fashion--does not imply that electoral structures
do not matter. To make this latter point, one has to adopt a rather extreme monocausalist
perspective according to wbich the underlying cIeavage structure of a society is so much more
important than the details of electorallaw tha4
t basically the same party system would arise
regardless ofthe electoral system employed (cf. Cairns 1968, p. 78). Does anyone believe that
the
V.S.
would remain a two-party system, even if it adopted the Israeli electoral system?Similarly, to assert that electoral structure affe~ts party competition in important and systematic ways does not imply that social structure is irrelevant. It might appear that tbis is
exactly what Duverger's Law does imply--bipartism in any society merely upon application of
single-member districts--but in fact that overstates Duverger's proposition and the institutionalist
development of it, where there has been an increasing appreciation of the interaction effects
•
Duverger did take social structure more or less as a residual error, something lhal might
perturb a party system away from its central tendency defined by electorallaw. Later scholars,
however, have considered the possibility that c1ea\'age and electoraI structures may interact. This
has been the case in the string of papers that consider the importance of the geographic location
of supporters of a given part)' (e.g., Sartori 1968; Rae 1971; Riker 1982; Kim and Ohn 1992) and
also in a recent pair of works (Powell 1982; Ordeshook and Shvetsova 1994) that have inc1uded
both sociological and institutional variables in regression analyses of cross-national variations in the number of parties.
This paper follows lhe latter set of works in that it investigates the role of both social
c1eavages and electorallaws in determining the number ofparties. We put particular emphasis
on testing Ordeshook and Shvetsova's main finding--that there is a significant interaction
between social heterogeneity and electoral structure. In order to put this claim to a stringent test,
we employ a substantial1y different dataset--one that inc1udes about twice as many countries as
have previous studies, including a large number ofthird-worId democracies--and model the
impact of both electoraI structure and presidential elections differently than have previous
studies.
The structure of the paper is as follows. Section 1 sketches a hypothetical series of stages
by which social cleavages are reduced to party-defining cleavages, noting that some stages are
sensitive to the particularities of social structure, some to the details of electoral structure, and
some to both. The sketch outline suggests the inclusion ofboth social and electoral variables in
statistical analyses ofthe number of parties and Section 1 also reviews the work of Powell (1982)
and Ordeshook and Shvetsova (1994), noted above, th~t takes this approach. Section 2 explains
• how our data and methods differ from, and complement, previous efforls. Section 3 presents our
•
1. Social Clea\'ages, Possible Parties, and Actual Parties
The effective number of elective or legislative parties in a poli!)' can be thought of as the
end product of a series of decisions by various agents that serve to reduce a large number of
social differences, or cleavages, to a smaller number ofpart)'-defining cleavages.s There are three broad stages to consider in this process of reduction: the translation of social c1eavages into
partisan preferences; the translation of partisan preferences into votes; and the translation of
votes into seats.
In most institutionalist models, the first stage is not explored: there is an exogenously
given number ofparties vvith c1ear demarcating features (e.g., the position they adopt along an
ideological dimension), so that voters' preferences over parties are easily deducible. No party
ever fails to get votes because it is too poor to advertise its position; no would-be party ever fails
to materialize because it does not have the organizational substrate (e.g., labor unions, churches)
needed to launch a mass party.
In an expanded view, of course, the creation of parties and the
advertisement of their positions would be key points at which a reduction of the number of
political players occurs. The multiplicity of possible or imaginable parties is reduced to an actual
number of launched parties even before the electorate produces an effective number of
vote-getting parties, and the electoral mechanism produces an effective number of seat-winning
parties.6
The reduction of launched parties to voted-for parties is the domain of strategic voting.
Even if launched, a party still has to be perceived as viable in order to turn favorable preferences
into votes. Whether it is so perceived depends on how many other parties are chasing after votes
and on the details of electoral structure.
In particular, Sartori' s (1968) notion of the
strength ofan electoral system (where the strength in question is that ofthe incentives to coalesce that the
electoral system produces) is useful here. The Stronger the electoral system, the greater will be
•
•
voted-for parties. (Operational measures of the strength of an electoral system will be introduced
below.)
Finally, the reduction ofvoted-for parties to seat-winning parties is typically a mechanical
feature of the electoral system. The only substantial exceptions within individual electoral
districts occur when votes are not pooled across all candidates from a given party, as in Taiwan
or Colombia. In these systems, the distribution of a party's ,"ote support across its candidates or
lists materially affects its seat allocation (cf. Cox and Shugart N.d.).
Given this general picture of how parties arise and of how the leveI of vote or seat
concentration is set, one would imagine that studies ofthe effective number of elective or
legislative parties would investigate the impact of both social cleavages and electorallaws on
party system fractionalization. However, among quantitative studies we are aware of only two
that do this. The first ofthese, Powell (1982), looks only at legislative fractionalization while the
second, Ordeshook and Shvetsova (1994), looks at both elective and legislative fractionalization.7
Powell's work focuses on a set of 84 elections held in 27 mostly European countries
during the period 1965-1976. The dependent variable, legislative fractionalization, is measured
by Rae's index (that is, 1 -
Is;,
where Si is the seat share ofthe ith party). The independentvariables of primary interest are three measures of social heterogeneity--ethnic fractionalization
as measured by Rae's index (that is, 1 -
Ig;,
where gi is the proportion ofthe population in ethnic group i); an index of agricultural minorities (coded 3, 2 or 1 ifthe agricultural populationcomprises 20-49%, 50-80%, or 5-19% of the total population); and an index of Catholic
minorities (coded similarly to the agricultural index)--and two measures of electoral
structure--the "strength" of structure--the electoral system for legislative elections (coded 3 for single-member
plurality elections, 2 for the Japanese, German and Irish systems, and 1 for proportional systems);
and a dummy variable indicating whether or not the system is presidential (1 if yes, O if no
V
Regressing the independent variables just listed on the legislative fractionalization scores forby ... nonrnajoritarian electorallaws, but also by all ofthe heterogeneity measures, and
discouraged by presidential executives."
Ordeshook and Shvetsova (1994) consider several different data sets: Lijphart's (1990)
sample of20 Westem democracies from 1945-85 (representing 32 distinct electoral systems); an
extension ofthis dataset covering elections in 23 Westem democracies from 1945-90
(representing 52 distinct electoral systems); and a further extension that inc1udes Continental
elections in the period 1918-39. The dependent variables that Ordeshook and Shvetsova
investigate are four: the effective number of elective parties (ENPV =
1/I v; ,
where Vi is partyi's vote share); the effective number oflegislative parties (ENPS
=
1/Is; ,
where Si is party i's seat share); the number of parties that receive at least 1 % of the vote in two or more successiveelections; and the number of parties that secure one or more seats in two or more successive
elections. They measure social structure chiefly in terms of ethnicity, calculating the effective
number of ethnic groups (ENETH
=
l / Ig; ,
where gi is the proportion of the population in ethnic group i); and meaure electoral system properties by the average district magnitude and byTaagepera and Shugart's "effective magnitude" measure. They then use OLS regression to
explain variations in their dependent variables (here we shalllook just at ENPV), considering
three basic specifications: (1) The institutionalist specification: ENPV as a function solely of
the log of district magnitude, as in Taagepera and Shugart (1989); (2) The sociological
specification: ENPV as a function solely of ethnic heterogeneity; and (3) The interactive
specification: ENPV as a function ofthe product of ethnic heterogeneity and district magnitude.
They find that the interactive model does best in explaining the data, summarizing their findings
as follows:
.. .ifthe effective number of ethnic groups is large, political systems become
especially sensitive to district magnitude. But if ethnic fractionalization is low,
•
..
increase in fonnally organized parties. Finally, if district magnitude equals one,
then the party system is relatively 'impervious' to ethnic and linguistic
heterogeneity ... (Ordeshook and Shvetsova 1994, p. 122).
Thus, whereas Powe11 (1982, p. 81) had success with an additive specification, Ordeshook and
Shvetsova find an interactive model to be superior.
Why should an interactive model work we11? One answer runs as fo11ows. A polity will
have many parties only if it bOlh has many cIeavages and has a pennissive enough electoral
system to allow political entrepreneurs to base separate parties on these cIeavages. Or, to turn the
fonnulation around, a polity can have few parties either because it has no need for many (few
cIeavages) or poor opportunities to create many (a strong electoral system). Ifthese cIaims are
true, they would mIe out models in which the number of parties depends only on the cIeavage
structure, or only on the electoral system, or only on an additive combination ofthese two
considerations.9
Plausible though this fonnulation might be, it stillleaves several questions unanswered.
First, and most important, is the question of empirical evidence. Thus far we have one study in
which an additive specification seems to work well (Powell) and one study in which an
interactive specification proves superior (Ordeshook and Shvetsova). The latter study, moreover,
is based largely on European evidence, and one might well ask what would happen if India (or .
other socially di verse third-world countries with strong electoral systems) were added. Since
India appears to have lots of social cIeavages and also to have lots of parties, would the addition
of this (kind of) case to the analysis not bolster the importance of social heterogeneity and,
perhaps, point more toward an additive rather than an interactive specification? Second, there is
also the issue of what the fonn of the interaction between electoral and cIeavage structure is.
Perhaps the effective number of elective parties (ENPV) should equal the minimum of (1) the
number ofparties that the cIeavage structure will support (loosely fo11owing Taagepera and
•
•
the number of parties that the electoral system wi11 support (fo11owing the "generalized
Duverger's Law" of Taagepera and Shugart 1989. we might say this number was 2.5 +
1.2510g1OM. where M is the district magnitude). That is. perhaps the equation should be
something like EKPV
=
MIN[2.5 + 1.2510gIOM,C+1]. Or, perhaps the forro ofthe interaction isas Ordeshook and Shvetsova specify it, a simple product of factors reflecting electoral strength
and number of cleavages. In the next two sections, we investigate both these questions, especia11y the first.
2. Data and Methods
In considering the interaction between social heterogeneity and electoral perroissiveness,
our analytical strategy is to look at different data than did Ordeshook and Shvetsova (1994),
using different operational measures of key variables. The notion is that, if their basic finding of
a significant interaction is robust to these changes, then we can have more confidence in it. The
most important differences between our analysis and Ordeshook and Shvetsova's are as fo11ows:
we inelude a larger number of countries, ineluding many third-world democracies; we measure
the strength of an electoral system by employing separate measures of lower-tier district
magnitude and upper-tier characteristics, rather than combining these two factors (in an
"effective magnitude") or ignoring upper tiers (by taking a simple average of the district
magnitudes); and we inelude variables tapping the influence of presidential elections (if any) in
the system. Let us consider each point in turn.IO
Case selection: We have taken as a case every polity with an election in the 1980s
(defined as 1980-1990 inclusive) that qualifies as 'free' by Freedom House's score on political
rights (either a 1 or a 2); if a polity has multiple such elections in the 1980s, we have taken the
one elosest to 1985.11
These criteria of selection mean that we have a substantially more diverse
sample than do Ordeshook and Shvetsova (or PoweIl before them), one that includes India,
•
•
of countries incIuded is 54. As there is only one observation per country, our sample can also be
described as having observations on 54 electoral systems.
Measuring electoral structure. We differ from Ordeshook and Shvetsova and most ofthe
previous literature in that we do not use average magnitude or Taagepera and Shugart's 'effective
magnitude' as our main indicator of the strength of an electoral system. Instead, we use two
variables, one to describe the magnitude of the lower-tier districts, one to describe the impact of
the upper tier.
The lower tier variable that we use is based on the magnitude ofthe median legislator's
district. An example may help to clarify why we use this variable rather than simply the average
district magnitude. Suppose an electoral system has just two districts, one returning a single
member and one retuming 100 members. The average district magnitude in this system is
(100+1)/2
=
50.5. But this process ofaveraging, in which each district counts equally, does notcorrespond to the usual way in which the effective number ofparties is calculated. To see this,
suppose that there are 100 voters in the l-seat district, who split equally between two parties,
while there are 10,000 voters in the 100-seat district, who split equally between ten parties. In
this case, the effective number of parties in the l-seat district, the 100-seat district, and the
nationa as a whole are respectively 2, 10, and almost 10. The national effective number of
parties is much cIoser to the effective number of parties in the large district because the votes
from both districts are simply added to arrive at the national vote totaIs, and there are 100 times
more voters in the large district than in the small. The national effective number of parties, in
other words, is a weighted average of the district figures, in which larger districts get more
weight. Accordingly, it seems natural to use a similarly weighted measure ofthe central
tendency in district magnitudes. We choose to weight each district by the number of legislators
from that district (which, ifthere is no malapportionrnent in the system, and turnout is equal
across districts, will correspond to the weights used in calculating the national effective number
ofparties). We also have chosen to use medians rather than means. In the example at hand, this
..
•
magnitude 100; the magnitude of the median legislator' s district is thus 100. As it turns out,
using the average ofthe legislators' district magnitudes. rather than the median, has virtually no
impact on the results that follow. Finally, we follo\\' Taagepera and Shugart (1989) and take the
logarithm of the median legislator" s district' s magnitude, to produce a variable we denote LML.
The upper tier variable that we use. denoted UPPER, equals the percentage of all
assembly seats allocated in the upper tier(s) ofthe polity. It ranges from zero for polities without
upper tiers to a maximum of 50% for Gennany. The idea here is that instead of attempting to
deduce how the existence of an upper tier affects the "effective magnitude" of a system, we
simply let the upper tiers speak for themselves. Because all but one ofthe upper tiers in our
sample are compensatory--designed specifically to increase the proportionality of the overall
result--we can avoid some ofthe complexities ofTaagepera and Shugart's "effective magnitude,"
which attempts to put the effects of compensatory and additional seats on a common metric
(Taagepera and Shugart 1989, ch. 12).12
Presidentialism. Several previous studies--e.g., Powell (1982), Lijphart (1994), Jones
(1994), Mainwaring and Shugart (1995)--have included a code for presidential elections in
investigations oflegislative fractionalization. So do we. As our coding ofthis variable differs
from these previous studies, however, we discuss it at some length.
The simplest way to code presidentialism is with a dummy variable (I for presidential
systems, O for parliamentary), as do Lijphart and Powell. The problem with this approach is that
there are different kinds ofpresidential elections (runoff, plurality), held at different times
relative to the legislative elections (concurrently, non-concurrently), and these factors plausibly
matter. Thus, other scholars--such as Shugart and Carey (1992), Jones (1994), Shugart (1995),
and Mainwaring and Shugart (1995)--have developed more elaborate schemes. Our approach,
which fo11ows Shugart and Carey in general conception but differs in the details of
implementation, takes the influence a presidential election exerts on a legislative election as
depending on two factors: the proximity ofthe two elections; and the degree offractionalization
•
•
Proximity is a matter of degree. If the presidential and legislative elections are
concurrent. then proximity is maximal. Here, we take the maximum "alue of proximity to be
unity (so concurrent elections are "100% proximal," so to speak). At the other end ofthe scale
are legislative elections held in complete isolation from presidential elections--i.e., in
non-presidential systems.IJ Such legislative elections are not at alI proximal to a presidential
election--so they are coded as of zero proximity. In between these two extremes are presidential systems
with non-concurrent elections. Ifwe denote the date ofthe legislative election by
Lt,
the date ofthe preceding presidential election by Pt-I, and the date ofthe succeeding presidential election by
Pt+
l,
then the proximity value is PROXIMITY = 2*
LI -P,-l
_!.
This formula expresses theP'+l - P,-l
2time elapsed between the preceding presidential election and the legislative election
(Lt -
PI _I), asa fraction ofthe presidential term (Pt+1 - PI_I). Subtracting 1/2 from this elapsed time fraction,
and then taking the absolute value, shows how far away from the midterm the legislative eIection
was held. The logic ofthe formula is as folIows: The least proximal legislative elections are
those held at midterm. This particular formula gives a proximity value of zero to these elections,
which equates mem with the totally isolated elections of non-presidential systems.14
The most
proximal non-concurrent elections are those held just before or just after a presidential eIection.
The formula above gives them a proximity value that approaches one, the same value given to
concurrent elections.15
The proximity of the presidential election to the legislative election is a necessary
condition for the former to influence the latter. But the nature ofthat influence depends on the
nature of the presidential election. One approach to coding the nature of the presidential election
is institutional. Mainwaring and Shugart (1995), for example, introduce variables that
distinguish three classes of presidential elections: concurrent plurality, majority runoff, and
other. Although we report some results in a footnote that folIow this route, our approach is
•
..
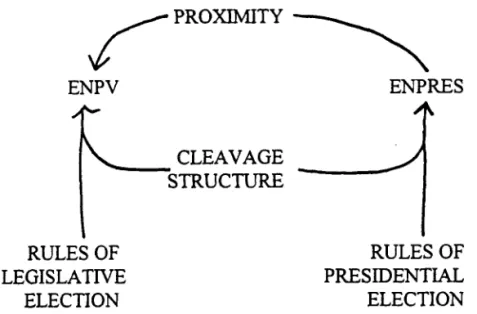
Our point of departure is the notion that both presidential and legislative election results
convey infonnation about the impact of social clea\'ages and electorallaws. To put it another
way, ifwe denote the effective nurnber ofpresidential candidates by ENPRES, and the effective
number of elective parties in the legislative election by ENPV, then both ENPRES and ENPV
may be thought of as dependent variables--products of social and electoral structure--along the
lines of Figure 1.
There are three things to note about Figure 1. First, the picture assumes that the effect of
the presidential election on the legislative election dominates that ofthe legislative eIection on
the presidential: thus there is an arrow from El\TpRES to ENPV but not one going in the reverse
direction. In reality, there no doubt are reverse causal arrows ofthe kind omitted from Figure 1. But we believe that the direction of influence is primarily from executive to legislative elections,
and making this assumption facilitates econometric estimation of the system of equations implied
by Figure 1. In particular, one can first estimate an equation detennining ENPRES and then estimate an equation--in which ENPRES appears as a regressor--detennining ENPV (see below).
The second thing to note is that the influence of presidential on Iegislative elections is
mediated through the effective number of presidential candidates, ENPRES, and does not incIude
a direct impact of presidential roles on legislative fractionalization, as does the Mainwaring and
Shugart fonnulation. Our justification for this runs as follows. Imagine a presidential election
held under runoff roles that nonetheless--perhaps because the country is dominated by a single
cleavage, perhaps for reasons idiosyncratic to the particular election--ends up as a two-way race.
Given that there are just two candidates in the presidential race, we expect the same kind of
influence as would be produced by an otherwise similar plurality race. The nature of the coattail
• opportunities that face legislative candidates should be similar, the nature ofthe advertising
economies of scale that might be exploited should be similar, and so forth. It is hard to see why
the presidential roles themselves, having failed to produce the expected result in the presidential
race, would nonetheless exert some direct influence on the legislative race. Thus, we prefer to
•
presidential election mIes (these mIes, of course. do have an indirect impact via their influence
on ENPRES). AIl told, our expectation is that legislative elections that are highly proximal to
presidential elections should have a lower effective number of parties, but how much lower
should depend on ENPRES. Thus we include both PROXIMITY and PROXIMITY*ENPRES in
the anaIysis.16
A final point to note about Figure 1 is that it presupposes an interaction between electoraI
and social stmcture, both in the production ofENPV and in the production ofENPRES. Ifthere
is such an interaction in legislative elections, as Ordeshook and Shvetsova (1994) claim, then
there should aIso be an interaction in presidentiaI elections.
Specifying lhe Equalions. Having discussed the main differences of data and
operationalization between our anaIysis and Ordeshook and Shvetsova's, we can turn to the issue
ofhow we specify the relations ofinterest. We shaII consider first the effective number of
legislative parties (ENPS), then the effective number of elective parties (ENPV), and finaIly the
effective number of presidentiaI candidates (ENPRES). J7
In investigating the frrst ofthese dependent variables (ENPS), we are interested in the
purely mechanical features ofhow the legislative electoraI system translates votes into seats.
Accordingly, we include ENPV on the right-hand side (cf. Coppedge 1995). Indeed, in our view,
the proper formulation is one in which ENPS would equal ENPV, were the electoraI system
perfectly proportional, with stronger electoraI systems reducing ENPS below ENPV. Thus, we
run the following regression:
ENPS
=
a+
ENPV*(/3o+
/3ILML+
/32UPPER)+
EIfthe electoral system employs single-member districts (so LML
=
O) and has no upper tier (soUPPER
=
O), then it is maximal1y strong, and only a fraction /30 of ENPV is added to a to givethe predicted effective number of legislative parties in the system. As LML and UPPER
increase, the system becomes more permissive and the fraction of ENPV that translates into seats
should be greater. That is, the coefficients on ENPV*LML (i.e., /31) and on ENPV*UPPER (i.e.,
..
..
coefficients associated with both should be significant!
In the analysis ofthe effective number of elective parties, ENPV, we run five
specifications: apure institutionalist specification, with only variables pertaining to the
legislative electoral system or the impact of presidential elections; apure sociological model,
with onIy a variable tapping into social heterogeneity (specificaHy, ENETH, the effective number
of ethnic groups, used by Ordeshook and Shvetsova); 18 an additive model in which both sets of
variables are included; an additive/interactive model in which an interaction term (between LML
and ENETH) is added to the previous specification; and an interactive model in which the linear
terms for LML and ENETH are omitted but the interaction term LML *ENETH is kept.
Finally, our analysis ofthe effective number ofpresidential candidates is as suggested in
Figure 1. The main regressors are a dummy variable identifying runoff systems (RUNOFF), the
effective number of ethnic groups (ENETH), and their interaction (RUNOFF*ENETH).
3. Results
Our results are displayed in Tables 1, 2 and 3. Table 1 shows, not surprisingly, that a fair
amount ofthe variance (93%) in the effective number ofparliamentary parties can be explained
by just ENPV and interactions between ENPV and two indicators ofthe strength ofthe electoral
system--LML and UPPER. All variables have the expected sign and are statistically discernible
from zero at about the .001 leveI or better. One way to explain the substantive impacts implied
by the results in Table 1 is to compare two hypothetical systems, in neither of which there is an
upper tier. System A has single-member districts, hence LML = O. System B has ten-seat
districts, hence LML
=
2.3. Suppose that both systems have ENPV=
3 in a particular election.The stronger system (A) is predicted to reduce this number of elective parties by almost a fuH
17
to reduce the three effective parties competing in the election by much less, to 2.64 legislative
parties. The substantive importance ofthis difference might vary from situation to situation, but
it certainly suggests an important change from essentially a two-party legislative system with
mostly single-party govemments to a two-and-a-half or three-party legislative system with
coalition govemments as the norm.19
[Table 1 about here.]
The results in Table 2 show the results for the five equations estimating the effective
number of elective parties (ENPV) outlined in the previous section. In running these regressions, we have omitted electoraI systems with fused votes--that is, systems in which the voter casts a
singIe vote for a slate which includes candidates for executive and legislative offices. The reason
for omitting such systems is that they change the meaning of essentially alI the institutional
regressors. For example, do voters in such systems respond to the district magnitude at the
legislative leveI or at the presidential leveI? Fused-vote systems really need to be analyzed
separately (see Shugart 1985 for the case of Venezuela, which has a fused vote for senate and
house races) but we do not attempt to do so here: we just omit the three cases of
executive-legislative fused votes in our sample--BoIivia, Honduras, and Uruguay.20 This reduces our
number of observations to 51 for the regressions in Table 2. We shall discuss each brief1y in
turno
The first model, with only institutional variables, explains about 61 % of the variance in
our sample ofENPV values. All coefficients are ofth~ expected sign and significant at the .05 leveI or better. The second model, with only the effective number of ethnic groups (ENETH) as
a regressor, produces a poor fit (an adjusted R2 of .01) and an insignificant coefficient and
regression. The third model, which combines the regressors from the first two, shows little
change in the coefficients ofthe institutional variables but produces a coefficient on ENETH that
..
18
important in disceming any independent additive effect due to ethnic heterogeneity. The founh
model--which adds to the third an interaction term, LML *ENETH--reduces the coefficients on
LML and ENETH to statistical1y insignificant values, while producing a substantial and
statistically significant positive coefficient on the interaction term (LML *ENETH), together \vith
little change in the coefficients ofthe remaining variables. Finally, the fifth model, in which the
variables LML and ENETH are omitted, but their interaction is retained, produces a somewhat
smaller interaction coefficient (but a substanitally smaller interaction standard error), \vith other
coefficients largely unchanged. If one chooses among specifications according to which
produces the largest adjusted R2 (not necessarily recommended; see the discussion in Kennedy
1994), then the last specification--\vith an adjusted R2 of .69--is the best.
[Table 2 about here.]
We have also investigated a different formulation for the interactive term, using the
minimum of LML and ENETH instead of their product. Substituting this minimum term for
LML
*ENETH in the last model produces little change in any ofthe other coefficients or in theoveral fit ofthe equation. lt is thus difficult on the basis ofthis study to say much one way or
another about whether the form of the interaction should be thought of as a product or a
minimum.21
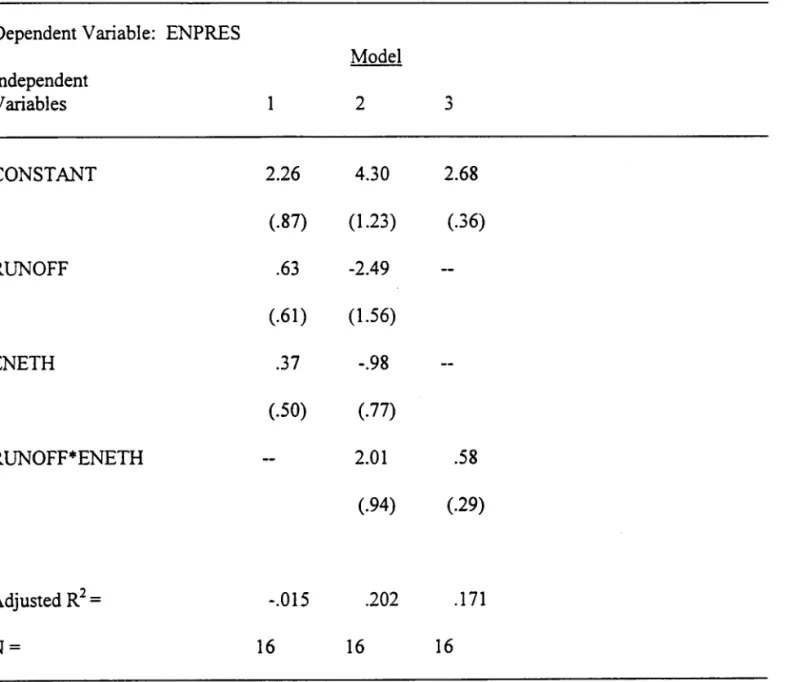
Finally, Table 3 displays results for three regressions that take ENPRES as the dependent
variable. The first model is additive, using RUNOFF and ENETH as regressors. As can be seen,
neither regressor is statistically significant and the regr~ssion as a whole sports a negative
adjusted R2 (regressions withjust RUNOFF andjust ENETH are also insignificant). The second
model adds the interaction term, RUNOFF*ENETH, to the first. The linear terms remain
insignificant (albeit reversing sign) but the interaction term is appropriately signed and
..
19
the interaction term is again positive and statistically discernible from zero in a one-tailed test at
the .05 leveI.
[Table 3 about here.]
Two questions that might arise about the series of results just presented are whether our
results hold for other measures of social diversity and whether our results hold both for the
mostly-European industrialized democracies (investigated in previous studies) and for the
mostly-non-European developing democracies (thatwe have added to the analysis). The answer
to both questions is affirmative. If, instead of the effective number of ethnic groups, one uses the
effective number of language groups as a measure of social diversity, one finds qualitatively
similar results.:!2 If one removes the 20 mostly-European democracies studied by Rae (1971),
Lijphart (1990), and Ordeshook and Shvetsova (1994) from the analysis, leaving a sample of 34
mostly non-European developing countries, one again finds qualitatively similar results in alI
analyses.23
4. Conclusion
The results presented in the previous section pertaining to legislative elections are
remarkably similar to those generated by Ordeshook and Shvetsova (1994). Despite using a
different data set--one that included many new and developing democracies rather than
concentrating on the long-term democracies--and des~ite several differences in operationalization and specification, the basic result holds up: the effective number ofparties appears to depend on
the product of social heterogeneity and electoral permissiveness, rather than being an additive
function ofthese two factors.24 The intuitive formulation ofthis finding is that a polity can tend
•
Multipartism arises as lhe joint product of many exploitable cleavages and a permissive electoral
system.
If tbis general conclusion is valid, it ought to hold, not just for elections to the lower
house of the nationallegislature, but also for other elections. And we do find a bit of evidence
consistent with the notion that the effective number of presidential candidates is an interactive
product of social and electoral structure. In particular, elections that are both held under more
permissive rules (runoffrather than plurality) and occur in more diverse societies (with a larger
effective number of ethnic groups) are those that tend to have the largest fields of contestants for
the presidency.
It is worth discussing why this finding--that the size ofthe party system depends
interactively on social and electoral structure--is important and has merited the effort of
reexamination and extension. First, it clearly differs from the more purely sociological
formulations noted at the outset ofthe paper, in wbich the cleavage structure drives both the
choice of an electoral system and the number ofparties. For, under such a formulation, a polity
with many cleavages always chooses a permissive electoral system, so that the strength ofthe
electoral system should have had no discernible impact after controlling for the cleavage
structure. The measure of cleavage structure employed here is crude, so that one cannot
confidently reject the purely sociological approach based on this study, but certainly our results
lend no support.
Second, that there is an interaction between electoral strength and social heterogeneity in
the genesis of political parties also argues against purely institutionalist approaches. Consider,
for example, Lijphart's (1994) magisterial examinatio~ of changes in post-war democratic
electoral systems and the subsequent changes in number of parties. Ofien he found that increases
in the permissiveness of an electoral system did not subsequently give rise to an increase in the
number of parties. On a purely institutionalist account, this would count against the importance
of electorallaw. Taking account ofthe interaction between social and electoral structure,
•
electoral system counts as evidence against the importance of electoral structure only if one
believes that the previous electoral system had impeded the exploitation of extant c1ea\'ages in
the society, so that it was actually holding the number of parties below what it would be with a
more permissive system. Absent such a belief, one would not expect a weakening of the
electoral system to lead to increases in the number of parties, and so one would not count failure
to observe such an increase as evidence of the frailty of electorallaws in conditioning political
life. Similarly, finding that an increase in the strength of an electoral system does not produce a
contraction in the party system is telling evidence only if the number of parties under the old
system exceeds the "carrying capacity" of the new system.
Finally, we should note some directions for further research that our work suggests. One
follows directly from the remarksjust made: perhaps there is room for a reanalysis ofLijphart's
findings with social heterogeneity taken into account. Another follows from a question posed but
left unanswered above: what precisely should the form of the interaction between social and
electoraI structure be? To address this question would require a substantially larger dataset than
that we have compiled here. A third possible direction for research follows from the general
observation that electoral studies ought to move toward constituency-Ievel evidence (e.g.,
Taagepera and Shugart 1989, pp. 213-14; Cox and Shugart 1991). Clearly the key electoral
factors (e.g., district magnitude) can vary widely within a given nation. Just as clearly, it is also
possible to find substantial variation across a given nation' s electoral constituencies in ethnic,
linguistic and religious heterogeneity. These observations suggest that it may be fruitful in
further investigations of the interaction (or lack thereof) between social and electoral structure, to
COUNTRY Year ENPV ENPS ML UPPER PROXIMITY ENPRES ENETH
Argentina 1985 3.37 2.37 9.0 0.00 0.55 2.51 1.34
Australia 1984 2.79 2.38 1.0 0.00 0.00 1.11
Austria 1986 2.72 2.63 30.0 0.11 0.80 2.27 1.01
Bahamas 1987 2.11 1.96 1.0 0.00 0.00 1.34
Barbados 1986 1.93 1.25 1.0 0.00 0.00 1.50
Belgium 1985 8.13 7.01 8.0 0.40 0.00 2.35
Belize 1984 2.06 1.60 1.0 0.00 0.00 3.46
Bolivia 1985 4.58 4.32 17.5 0.00 1.00 4.58 3.77
Botswana 1984 1.96 1.35 1.0 0.00 0.00 1.11
Brazil 1990 9.68 8.69 30.0 0.00 0.63 5.69 2.22
Canada 1984 2.75 1.69 1.0 0.00 0.00 3.49
Co1ombia 1986 2.68 2.45 8.0 0.00 0.93 2.13 2.51
Costa Rica 1986 2.49 2.21 10.0 0.00 1.00 2.07 1.08
Cyprus 1985 3.62 3.57 12.0 0.00 0.00 1.56
Czech Republic* 1990 3.10 2.04 24.0 0.05 0.00 1.12
Denmark 1984 5.25 5.04 11.0 0.00 0.00 1.02
Dominica 1985 2.10 1.76 1.0 0.00 0.00 1.68
Dominican Republic 1986 3.19 2.53 5.0 0.00 1.00 2.80 1.75 El Salvador 1985 2.68 2.10 4.0 0.00 0.64 3.16 1.25
Equador 1984 10.32 5.78 3.0 0.00 1.00 5.18 2.60
Finland 1983 5.45 5.14 17.0 0.00 0.61 3.79 1.13
France 1981 4.13 2.68 1.0 0.00 0.96 4.86 1.17
Germany 1983 3.21 3.16 1.0 0.50 0.00 1.15
Greece 1985 2.59 2.14 6.0 0.24 0.00 1.04
Grenada 1990 3.84 3.08 1.0 0.00 0.00 1.06
Honduras 1985 3.49 2.80 9.0 0.00 1.00 3.49 1.23
lceland 1983 4.26 4.07 7.0 0.18 0.41 3.60 1.06
lndia 1984 3.98 1.69 1.0 0.00 0.00 1.72
lreland 1987 3.46 2.89 5.0 0.00 0.00 1.08
Israel 1984 4.28 3.86 120.0 0.00 0.00 1.39
ltaly 1983 4.51 4.11 24.0 0.11 0.00 1.04
Jamaica 1989 1.97 1.60 1.0 0.00 0.00 1.65
Japan 1986 3.35 2.57 4.0 0.00 0.00 1.01
Korea (South) 1988 4.22 3.56 1.0 0.25** 0.87 3.55 1.01
..
Liechtenstein 1986 2.28 1.99 15.0 0.00 0.00 1.11Luxembourg 1984 3.56 3.22 21.0 0.00 0.00 1.63
Malta 1987 2.01 2.00 5.0 0.00 0.00 1.13
lO
Mauritius 1983 1.96 2.16 3.0 0.00 0.00 1.86
Netherlands 1986 3.77 3.49 150.0 0.00 0.00 1.08
New Zealand 1984 2.99 1.98 1.0 0.00 0.00 1.28
Norway 1985 3.63 3.09 10.0 0.00 0.00 1.04
Peru 1985 3.00 .., ~..,
_ • .J_ 9.0 0.00 1.00 2.76 2.76
Portugal 1983 3.73 3.41 16.0 0.00 0.05 1.96 1.02
Spain 1986 3.59 2.81 7.0 0.00 0.00 1.65
St.Kins and Nevis 1984 2.45 2.46 1.0 0.00 0.00 1.22
•
St.Vincent &Grenadines 1984 2.28 1.74 1.0 0.00 0.00 1.66
Sweden 1985 3.52 3.39 12.0 0.00 0.00 1.26
Switzerland 1983 5.99 5.26 12.0 0.00 0.00 2.13
Trinidad & Tobago 1986 1.84 1.18 1.0 0.00 0.00 2.74
United Kingdom 1983 3.12 2.09 1.0 0.00 0.00 1.48
United States 1984 2.03 1.95 1.0 0.00 1.00 1.96 1.36
Uruguay 1989 3.38 3.35 11.0 0.27 1.00 3.38 1.28
Venezuela 1983 2.97 2.42 11.0 0.09 1.00 2.19 1.99
Notes:
(*) The Czech Republic was not of course an independent state in 1990. We use the Czech results from the Czechoslovak election of that year. Omitting this case does not affect our results.
(**) South Korea's upper tier is not compensatory and so in our main results we do not handle it in the same way as the other systems with upper tiers (see footnote 11).
(1) ENPV =
1/I
v;,
where Vi is party i's vote share in the legislative election; the effective number of elective parties.(2) ENPS =
1/Is; ,
where Si is party i's seat share in the legislature; the effective number of legislative parties.(3) ML is the magnitude ofthe median legislator's district. Ifthere are N members of a given country's legislature, one can associate with each member the magnitude ofthe electoral district from which that member was elected. Taking the median ofthese N numbers then gives ML. We take the median rather than the average because the former is a more robust measure of central tendency, although in practice the two measures work similarly. Data to compute ML come from Cox 1995.
(4) UPPER: see below.
(5) PROXIMITY: as defined in text.
(6) ENPRES
=
1/Ip; ,
where Pi is party i's vote share in the presidential election; the effective number of presidential candidates.• Country Austria Belgium Czech Republic Germany Greece Iceland Italy Uruguay Venezuela Sources:
PercentaQe of Seats Allocated at the Upper Tier LeveI
Election Year 1986 1985 1990 1983 1985 1983 1983 1989 1983 Assembly Size 183 212 101 498 232 60 630 99 200
Seats A warded in Upper Tier
N
%
21 11.4
85 40.0
5 5.0
248 49.8
56 24.1
11 18.3
72 11.4
27 27.2
18 9.0
Austria -Bunsdesministerium fur Inneres. 1987. Die Nationalratswahl vom 23 November 1986. Wien: Druck und Kommissionsverlag der Osterreichischen Staatsdruckerei.
Belgium -Ministere de L'Intérieur et de la FonctionPublique. (N.d.). Éleetions Législatives du
13 Oetobre 1985 - Chambre des Représentants. Ministere de L'Intérieur et de la Fonction
Publique.
Czech Republic -Wightman, Gordon. 1990. "Czechoslovakia." Eleetoral Studies 9:319-26.
Germany -Lijphart, Arend. 1994. Eleetoral Systems and Party Systems: A Study
ofTwenty-Seven Demoeracies, 1945-1990. Oxford: Oxford University Press.
Greece - ibid.
Iceland -Mackie, Thomas T. and Richard Rose. 1991. The lnternational Almanae of Eleetoral
History, 3rd. ed. Washington, D.C.: Congressional Quarterly.
Italy -Instituto Central e di Statistica. 1984. Elezion,i de lia Camera dei Deputati e dei Senato
della Repubbliea - 26 Giugno 1983. Roma: Ministero Dell'Interno.
Uruguay -Albornoz, Alfredo. 1992. Eleeciones. Montevideo: Cámara de Representantes.
Venezuela - Consejo Supremo Electoral. 1987. Los Partidos Políticos y Sus Estadístieas
References
Arms, Thomas S., and Eileen Riley, eds. 1987. World Elections on File. New York: Facts on
File.
Brazil - Tribunal Superior Eleitoral. 1990. Resultado das Eleições de 1990 para a Câmara dos
Deputados. Brasília: Supervisão de Engenharia de Sistemas do Tribunal Superior
Eleitoral.
Caims, A. 1968. "The Electoral System and the Party System in Canada, 1921-1965."
Canadian Journal of Polítical Science 1 :55-80.
Campbell, Peter. 1958. French Electoral Systems and Elections 1789-1957. London: Faber
and Faber.
Central Intelligence Agency. 1990. World Factbook. Washington, D.C.: Central Intelligence
Agency.
Central Intelligence Agency. 1994. World Factbook. Washington, D.C.: Brassey's.
Coppedge, MíchaeI. 1995. "District Magnitude, Economic Performance, and Party-System
Fragmentatíon in Five Latin American Countries." University ofNotre Dame.
Unpublished manuscript .
•
Cox, Gary W. 1994. "Strategic Voting Equílibria under the Single Non-Transferable Vote."
•
Cox, Gary W. 1995. The Po/itics of Electoral Coalition. University of California, San Diego.
Unpublished book manuscript.
Cox, Gary W., and Matthew S. Shugart. 1991. "Comment on Gallagher's 'Proportionality,
Disproportionality and Electoral Systems'." Electoral Studies 10:348-52.
Cox, Gary W., and Matthew S. Shugart. 1995. "Strategic Voting Under Proportional
Representation." University of California, San Diego. Unpublished manuscript.
Cox, Gary W., and Matthew S. Shugart. N.d. "In the Absence ofVote Pooling: Nomination and
Vote Allocation Errors in Colombia." Electoral Studies. Forthcoming.
Duverger, Maurice. 1954. Political Parties. New York: Wiley.
Encyclopedia Britannica. 1980. Chicago: Encyclopedia Britannica.
Eckstein, H. 1963. "The Impact of Electoral Systems on Representative Govemment." In
Comparative Politics: A Reader, ed. H. Eckstein and D. Apter. New York: Free Press.
Franco, Rolando. 1986. "EI Sistema Electoral Uruguayo en un Perspectivo Comparada." In EI
Sistema Electoral Uruguayo: Peculiaridades y Perspectivas, ed. Rolando Franco.
Montevideo: Fundación Hanns-Seidel.
Freedom House. 1980-1991. Freedom in the World.· New York: Freedom House .
Fukui, Haruhiro. 1988. "Electoral Laws and the Japanese Party System." In Japan and the
•
li
Gallagher, Michael, Michael Laver and Peter Mair. 1992. Representative Government in
Western Europe. New York: McGraw-Hill.
Gorwin, lan, ed. 1989. Elections Since 1945. A Worldwide Reference Compendium. Essex:
Longman.
Grumm, J. G. 1958. "Theories ofElectoral Systems." Midwest Journal ofPolitical Science
2:357-76.
lesse, Eckhard. 1990. Elections: The Federal Republic ofGermany in Comparison. Trans.
Lindsay Batson. New York: St. Martin's.
Jones, Mark P. 1994. "Presidential Election Laws and Multipartism in Latin America."
Political Research Quarterly 47:41-57.
Jones, Mark P. 1995. "A Guide to the Electoral Systems ofthe Americas." Electoral Studies
14:5-21.
Kennedy, Peter. 1994. A Guide to Econometrics. 3rd edition. Cambridge: MIT Press.
Kim, Jae-On, and Mahn-Geum Ohn. 1992. "A Theory ofMinor-Party Persistence: Election
Rules, Social Cleavage, and the Number ofPolitical Parties." Social Forces 70:575-99.
Laakso, Marku, and Rein Taagepera. 1979. "Effective Number ofParties: A Measure with
Application to West Europe." Comparative Political Studies 12:3-27.
•
•
Lijphart, Arend. 1990. "The Political Consequences of Electoral Laws. 1945-85." American
Po/itical Science Review 84:481-96.
Lijphart, Arend. 1994. Electoral Systems and Party Systems: A Study ofTwenty-Seven
Democracies, 1945-1990. Oxford: Oxford University Press.
Lipset, Seymour Martin, and Stein Rokkan, eds. 1967. Party Systems and Voter Alignments:
Cross-National Perspectives. New York: Free Press.
Lipson, Leslie. 1959. "Party Systems in the United Kingdom and the Older Commonwealth:
Causes, Resemblances, and V ariations." Po/itical Studies 7: 12-31.
Lipson, Leslie. 1964. The Democratic Civilization. New Y ork: Oxford University Press.
Mackie, Thomas T., and Richard Rose. 1991. The International Almanac of Electoral History.
3rd. ed. Washington, D.C.: Congressional Quarterly.
Mainwaring, Scott, and Matthew S. Shugart. 1995. "Conclusion: Presidentialism and the Party
System." In Mainwaring, Scott, and Matthew S. Shugart, eds. Presidentia/ism and
Democracy in Latin America. Unpublished book manuscript, University of California,
San Diego .
Meisel, John. 1963. "The Stalled Omnibus: Canadian Parties in the 1960s." Social Research
30:383-4.
Myerson, Roger, and Robert Weber. 1993. "A Theory ofVoting Equilibria." American
•
•
Nagel, Jack H. 1994. "Predicting the Political Consequences ofElectoral Refonn: How Many
Parties Will New Zealand Have Under Proportional Representation?" Paper presented at
the annual meeting ofthe American Political Science Association, New York.
Nohlen, Dieter, ed. 1993. Encic/opedia Electoral Latinoamericana y deI Caribe. San José:
Instituto Interamericano de Derechos Humanos.
Olson, Mancur. 1965. The Logic ofCollective Action. Cambridge, MA: Harvard University
Press.
Ordeshook, Peter, and Olga Shvetsova. 1994. "Ethnic Heterogeneity, District Magnitude, and
the Number of Parties." American Journal of Polítical Science 38: 1 00-23.
Palfrey, Thomas. 1989. "A Mathematical Proof ofDuverger's Law." In Models of Strategic
Choice in Polítics, ed. Peter C. Ordeshook. Ann Arbor: University ofMichigan Press.
Powell, G. Bingham. 1982. Contemporary Democracies: Participation, Stability and Violence.
Cambridge: Harvard University Press.
Rae, Douglas. 1971. The Polítical Consequences of Electoral Laws. Rev. ed. New Haven, CT:
Yale University Press .
Riker, William H. 1982. "The Two-Party System and Duverger's Law: An Essay on the History
ofPolitical Science." American Polítical Science Review 76:753-66.
.,
•
Rose, Richard, and Derek Urwin. 1970. "Persistence and Change in Westem Party Systems
since 1945." Political Studies 18:287-319.
Santos, Wanderley Guilherme dos, ed. 1990. Que Brasil é Este? Manual de Indicadores
Políticos e Sociais. São Paulo: Vértice.
-'30
Sãrlvik, Bo. 1983. "Scandinavia." In Democracy and Elections: Electoral Systems and Their
Political Consequences, ed. Vemon Bogdanor and David Butler. Cambridge: Cambridge
University Press.
Sartori, Giovanni. 1968. "Political Development and Political Engineering." In Public Policy,
ed. John D. Montgomery and Albert O. Hirschman. Cambridge: Cambridge University
Press.
Sartori, Giovanni. 1976. Parties and Party Systems: A Framework of Analysis. Cambridge:
Cambridge University Press.
Schattschneider, Elmer Eric. 1960. The Semisovereign People: A Realist's View of Democracy
in America. New York: Holt, Rinehart and Winston.
Singh V. B., and Bose Shankar. 1986. Elections in India: Data Handbook on Lok Sabha
Elections, 1952-85. New Delhi: Sage Publications .
Shugart, Matthew S. 1985. "The Two Effects ofDistrict Magnitude: Venezuela as a Crucial
•
•
Shugart, Matthew S. 1995. "The ElectoraI Cyc1e and Institutional Sources ofDivided
Presidential Governrnent." American Polítical Science Review 89:327-43.
Shugart, Matthew S., and Jolm M. Carey. 1992. Presidents and Assemblies. Constitutional
Design and Electoral Dynamics. New Y ork: Cambridge University Press.
Solari, Aldo E. 1986. "EI Sistema de Partidos y Régimen Electoral en el Uruguay." In El
Sistema Electoral Uruguayo: Peculiaridades y Perspectivas, ed. Rolando Franco
Montevideo: Fundación Hanns-Seidel.
Taagepera, Rein, and Bemard Grofman. 1985. "Rethinking Duverger's Law: Predicting the
Effective Number ofParties in Plurality and PR Systems -- Parties Minus Issues Equals
One." European Journal of Political Research 13 :341-52.
Taagepera, Rein, and Matthew Soberg Shugart. 1989. Seats and Votes: The E.ffects and
Determinants of Electoral Systems. New Haven: VaIe University Press.
Vanhanen, Tatu. 1990. The Process of Democratization. A Comparative Study of 147 States
(1980-88). New York: Crane Russak.
Worldmark Encyclopedia ofthe Nations. 1984. New York: Jolm Wiley .
Dependent Variable:
Independent Variables
CONSTANT
ENPV
ENPV*LML
ENPV*UPPER
Adjusted R2 =
N ofObs=
•
Table 1: The Determinants of the Effecti\'e Number of Legislati\'e Parties
ENPS
Estimated Standard
Coefficients Errors
.582 .135
.507 .048
.080 .012
.372 .111
.921
•
•
Table 2: The Determinants of the Effective Number of Electoral Parties
Dependent Variable: ENPV
Independent Variables CONSTANT LML UPPER PROXIMITY
PROXIMITY
*
ENPRESENETH
LML* ENETH
Adjusted R 2 =
N=
1 2
2.44 2.76
(.25) (.66)
.48 (.11) 3.64 (1.52) -5.98 (.97) 2.18 (.29) .49 (.40)
.613 .01
51 51
Model
3 4 5
1.61 2.45 2.40
(.47) (.55) (.21)
.52 -.23
(.11 ) (.31)
3.95 3.46 3.51
(1.48) (1.40) (1.37)
-5.95 -6.01 -6.04
(.94) (.89) (.88)
2.14 2.05 2.09
(.28) (.26) (.26)
.51 .01
(.25) (.30)
.53 .39
(.21) (.07)
.639 .679 .686
•
•
Table 3: The Determinants of the Effecti\'e Number of Presidential Candidates
Dependent Variable: ENPRES
Independent Variables
CONSTANT
RUNOFF
ENETH
RUNOFF*ENETH
Adjusted R2
=
N=
Model
1 2 3
2.26 4.30 2.68
(.87) (1.23) (.36)
.63 -2.49
(.61) (1.56)
.37 -.98
(.50) (.77)
2.01 .58
(.94) (.29)
-.015 .202 .171
"
•
Figure 1: A Schematic Representation of the Relationship Between Social Cleavages, Rules of Election, and Number of Competitors
in Presidential and Legislati"e Elections
~PROXIMITY
~
ENPV ENPRES
~_CLEAVAGE
STRUCTURE
RULES OF LEGISLA TIVE
ELECTION
•
•
ENDNOTES
I. In this view. party systems detennine electoral systems, rather than the other way around; cf. Grumm 1958;
Eckstein 1963. p. 253: Lipson 1964; Sãrlvik 1983, p. 123; Fukui 1988, p. 121.
2. Cf. Lavau 1953, p. 46; Campbell 1958. pp. 30-32; Grumm 1958; Lipson 1959; Meisel 1963; Lipson 1964; Lipset
and Rokkan 1967; Rokkan 1970; Franco 1986, pp. 82-3; Solari 1986, pp. 120-21. In perhaps the earlíest retort of this kind to Duverger's theses, Lavau (1953, p. 46) opined that "/e mode de scrutin demeure une bien petite chose en
regard desfacteurs complexes et infiniment divers qui. combinés différemment dans chaque sociéré nationa/e ....
conditionnent /a vie po/itique."
3. By 1isting these criticisms, we do not mean to imply that the side criticized has not recognized the problem and sought to deal with it. Adherents ofthe sociological approach, for example, have recognized the collective action problems inherent in translating social c1eavages into polítical party c1eavages (e.g., Rose and Urwin, Meisel), while adherents ofthe institutionalist approach have addressed the endogeneity ofinstitutional structure (e.g., Riker 1982; Cox 1995).
4. By social c1eavages we mean enduring social differences that might become politicized, or might not: differences
of ethnicity, religion, language, or occupation, for example. Ofien, the notion of a social c1eavage carries more than just this base notion of"socially-defmed difference." Gallagher, Laver and Mair (1992, p. 90), for example, defme a
social cleavage as a social division in which the groups involved are conscious oftheir collective identity, partly because their is an organization (church, union, etc.) that gives expression to this identity.
s. The reduction ofpossible to launched parties depends on many things: the levei ofpre-existing non-political organization that can be turned to political advantage; monetary resources; media access; and so on. Thus, a religious cleavage with well-organized and well-fmanced churches on both sides (e.g., Evangelicals versus Pietists in the nineteenth-century U.S.) is more likely to be politically activated, other things equal, than a racial c1eavage in which one side is poorly organized and poorly fmanced (e.g., whites versus Aborigines in Australía).
6. Other studies that share the same basic conception, but do not run regressions with explicit measures ofboth
electoral and social structure, include Nagel (1994) and Coppedge (1995).
•
•
•
8. An additive combination model--such as PowelI's--alIows the number ofparties to be large either because there
are many c1eavages (regardless ofhow strong the electoral s)'stem is) or because the electoral system is very permissive (regardless ofhow few cleavages there are) .
9. A copy ofthe fulI dataset, along with SAS co de that reads and analyzes the data, can be found under the
"publication-related datasets" heading ofthe Lijphart Elections Archive at http://ssdc.ucsd.edu/lij (or http://ssdc.ucsd.edu/lijlcharbase for character-based browsers).
10. The only exceptions to these roles are as follows. First, we have not included any ofthe Pacific Island states
(e.g., Tuvalu, Solomon Islands) because we could not get complete data. Hungary (1990) is excluded for the same reason. Finally, we take the 1990 Brazilian election rather than the (unusual) 1986 election.
J I. The South Korean upper tier is designed to ensure that the largest party can secure a majority, or a near-majority,
in the legislature--and thus in principIe it reduces proportionality. Our results do not change appreciably depending
on how we code South Korea. Nor do they change ifSouth Korea is simply omitted from the analysis.
12. In deciding whether a system is presidential or not, we have followed Shugart and Carey 1992, ch. 8. Ireland, for example, in which the president has neither legislative nor govemmental powers, is coded as non-presidential. Ali systems in which the president has either legislative, or govemmental, or both kinds of powers are coded as presidential.
13. lt is possible to include an additional parameter to test whether midterm elections are significantly more affected by presidential politics than elections occurring in non-presidential systems. We have done 50 and found that one cannot reject the hypothesis that midterm and non-presidential elections are equally unaffected by presidential elections.
14. With the current dataset, it is difficult to test Shugart's (1995) hypothesis that there is ajump between nearly
concurrent and exactly concurrent elections--with the depressive effect of presidential elections being much larger in • the latter-since there are only five observations on concurrent elections. Some limited exploration--replacing the
value "2" in the defmition of PROXIMITY given in the text by "1.9" and other lower values--suggests that the main results ofthe paper do not depend on how one handles this issue.
...
-
Wightman (1990).17. Our data on ethnic groups (and on language groups, which we discuss at the end ofthe results section) come from the
elA
World Factbook (1990,1994), the Encyclopedia Britannica (1980), Vanhanen (1990), and the Worldmark EncycJopedia ofthe Nations (1984). We thank Olga Shvetsova for sharing her data with uso18. Because the translation oflegislative votes into legislative seats is not affected by whether presidential elections
occur in the system, nor by the number and character of social c\eavages, these variables should not affect ENPS once ENPV is incJuded. We have verified that they do not. We also note that a model that excJudes the intercept term works slightly less well than the model with the intercepto in terms ofthe root mean squared error (.47 versus .40).
19. These cases did not need to be omitted in the frrst regressions because, once the votes are given, the translation to
seats is via the legislative electoral system--so the variables LML and UPPER retain their meaning. Omitting these cases does not in any event change any of our previous results.
20. We have also replaced the variable PROXIMITY*ENPRES with PROXIMITY*RUNOFF, to produce specifications along the lines of those offered by Mainwaring and Shugart (1995). This produces qualitatively similar results with poorer fits (adjusted R2,s around .3). As might be expected from the results in Table 3, if one pursues this more purely institutionalist specification, then a new electoral structure/social structure interatction term--RUNOFF*ENETH--is significant. In our formulation, this interaction is still significant but contributes only indirectly to the determination ofENPV, via its influence on ENPRES.
21.. We view the effective number of ethnic groups as a crude proxy for social diversity sensu lato. ThUS, we do not
•
necessarily expect that more ethnic groups should lead to more ethnically-based parties. To begin to get predictions•
ofthis kind, one would have to take on the issue of cross-cutting c1eavages in some fashion--which seems a hard task.li!
•
...
..
39
~3. Or, to take account of the results with the minimun of LML and ENETH just mentioned, perhaps we should say that the effective number ofparties depends on an interaction between electoral and social structure.
000086264