Does Ownership Matter? Evidence From
South-European Privatized Companies
Iolanda Sequeira Gomes
Master in Finance Dissertation
Supervisor
Prof. Miguel Augusto Sousa
ii
About the Author
Iolanda Sequeira Gomes was born on 3rd July, 1990. She is from Matosinhos, where she grew up and concluded high school in 2008, year in which she entered University. Graduated in Economics at School of Economics and Management at University of Porto (Faculdade de Economia do Porto) in 2011, she proceeded her education with the enrolment in the Master in Finance in the same school.
Alongside with her academic education, she developed her professional and personal skills through the integration in several student organizations, namely, FEP Junior Consulting and FEP Finance Club.
iii
Abstract
This paper contributes to the literature on privatization by examining the performance of newly privatized firms in South-European countries, more precisely by analyzing operational performance changes between the pre and post-privatization period.
To measure operational performance change, accounting measures for profitability, efficiency, investment, output, employment, leverage and dividend policy are analyzed between 3 years before and 3 years after the privatization. In addition to the raw analysis, market-adjusted analysis is performed, both for full sample and for two subsamples: i) firms in competitive versus non-competitive markets and ii) privatizations in which the government sells enough shares to bring its holdings below 50 percent (control privatizations) versus privatizations in which the government retains a majority stake (revenue privatizations). Finally, to more effectively isolate the effect of the privatization, a multivariate analysis is also reported.
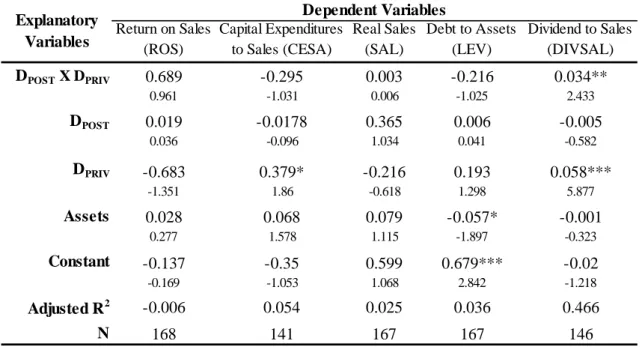
For the full sample, unadjusted data show an increase in profitability, efficiency, output and dividends and a decrease in investment. Despite the positive change in employment and the negative change in leverage, these changes are insignificant. The market-adjusted analysis reveals less significant results. Changes in performance for all measures but dividends (where a significant increase is reported) are insignificant. The multivariate analysis corroborates the results obtained in the maket-adjusted univariate analysis.
Key-Words: State-owned; Privatization; Performance
iv
Contents
I. Introduction ...1
II. Literature Review ...4
1. Theoretical Framework ...4
2. Empirical Evidence ...7
III. Data and Sample ... 11
1. Sample selection ... 11
2. Sample description ... 12
IV. Methodology and Testable Predictions ... 14
V. Univariate Analysis ... 17
1. Full Sample Analysis ... 17
2. Subsample Analysis ... 25
VI. Multivariate Analysis ... 37
VII. Conclusions ... 40
References ... 41
v
List of Figures and Tables
Figure I: Privatization Revenues ... 1
Table I: Sample Summary Statistics ... 12
Table II: Summary of Testable Predictions ... 15
Table III: Summary of Unadjusted Results for the Sample of All Privatized Firms ... 18
Table IV: Summary of Market-adjusted Results for the Sample of Market-adjusted Firms ... 20
Table V: Summary of Unadjusted Results for the Control Privatization versus Revenue Privatization ... 28
Table VI: Summary of Market-adjusted Results for the Control Privatization versus Revenue Privatization ... 30
Table VII: Summary of Unadjusted Results for Non-Competitive versus Competitive Firms ... 33
Table VIII: Summary of Market-adjusted Results for Non-Competitive versus Competitive Firms ... 35
1
I. Introduction
In the last three decades, several countries have launched ambitious privatization programs.
Although Britain’s Thatcher government may not have been the first to launch a large privatization program, it is without question the most important one historically (Megginson and Netter, 2001). After this ambitious plan launched in the early 80s, several countries worldwide introduced privatization as a tool to achieve political and economic goals and, since then, governments have raised around 2.5 trillion dollars through privatizations (Megginson, 2011)
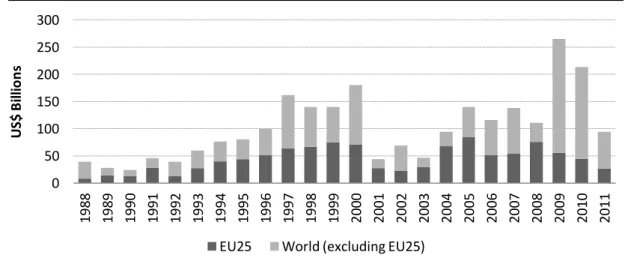
Figure I describes the evolution of total privatization revenues (in billion dollars) worldwide and in the enlarged European Union since 1988. It clearly illustrates that the sale revenues peaked in the late 90s, dropped sharply during the recession of 2001-2003, and then fluctuated between 94 billion and 140 billion dollars during 2004 and 2008. Both 2009 and 2010 were record years in privatization revenues but, due to the financial gloom pervading most of 2011, this year witnessed the lowest total value of revenues (94.4 billion dollars) from privatizations worldwide since 2004.
0 50 100 150 200 250 300 1988 1989 1990 1991 1992 1993 1994 1995 1996 1997 1998 1999 2000 2001 2002 2003 2004 2005 2006 2007 2008 2009 2010 2011 U S$ B ill io n s
EU25 World (excluding EU25) Figure I: Privatization Revenues
This figure presents the total revenue (in billion dollars) from privatization transactions occurring between 1988 and 2011. Data is aggregated by countries from European Union (EU25) and the rest
2 As seen in Figure I, the trend in the enlarged European Union is similar to what happened round the world. Those 25 countries have raised more than 1 trillion dollars since 1988, which represents 43% of the total world privatization revenue. However, since 2008, a major decline occurred in the privatization revenues from the European Union, hitting the minimum in 2011 with just 26 billion dollars, and those countries accounted for a small minority of the total value of privatization deals worldwide.
Despite this reduction, the next few years are expected to witness a growth in privatization deals, especially in South-European countries. The debt crisis which arose in the last years has forced some governments to launch ambitious privatization programs in order to raise revenues. Specifically Greece1, Portugal2, Spain3 and even Italy4 are already implementing privatization plans for the period 2011-2013 that amount to 15 billion euros, 5.5 billion euros, 30 billion euros and 10 billion euros, respectively.
This paper contributes to the literature on privatization by examining the performance of newly privatized firms in South-European countries, more precisely by analyzing operating performance changes between the pre- and post-privatization period. The sample includes 45 companies, from 4 countries (Greece, Portugal, Spain and Italy), that experienced full or partial privatization from 1997 to 2012. Accounting measures for profitability, efficiency, investment, output, employment, leverage and dividends are analyzed between 3 years before and 3 years after privatization. To more closely examine the sources of any privatization-induced performance changes, in addition to the full sample analysis, two pairs of subsamples are examined: i) firms in competitive
1
Greek privatization program includes transactions regarding a number of key sectors such as: Banking, Energy (Public Power Corporation, DEPA and DESFA), Gaming (OPAP, Casinos and State Lottery Tickets), Telecoms (OTE), Ports, Airports (Athens International Airport, Regional Airports), Motorways, Railways, Mining (LARCO), Water and Waste Management, Defence Industries and Real Estate.
2
Portuguese privatization plan includes the privatization of companies from the transportation sector (Airports of Portugal, TAP, and CP Cargo), energy sector (GALP, EDP and REN), communications sector (Correios de Portugal and RTP), insurance (Caixa Seguros) and services (Águas de Portugal).
3
The Spanish privatization plan affects state companies such as Renfe, Aena, Puertos del Estado y Paradores, and will include the divestment on IAG, Ebro Foods and Red Eléctrica de España (REE).
4
The Italian plan includes the privatization of Fintecna, Sace and Simest. The government still is studying the opportunity to privatize other companies.
3 versus non-competitive markets and ii) control versus revenue privatizations. Moreover, to isolate the effect of privatization from the impact of macroeconomic and sector changes, both raw and market-adjusted measures are analyzed. Finally, to more effectively isolate the effect of the privatization from others sources of performance changes, a multivariate analysis is also reported.
For the full sample, unadjusted data show an increase in profitability, efficiency, output and dividends and a decrease in investment. Although the positive change in employment and the negative change in leverage, these changes are insignificant. The market-adjusted analysis reveals less significant results. Changes in performance for all measures but dividends (where a significant increase is reported) are insignificant. The multivariate analysis corroborates the results obtained in the maket-adjusted univariate analysis.
The remainder of the paper is organized as follows. Section II provides a summary of the recent theoretical and empirical research on privatization. Section III describes the data and the sample selection. Section IV presents the methodology and testable predictions. In Section V and VI, are presented and discussed the empirical results from the univariate and multivariate analysis, respectively. Finally, Section VI summarizes the results.
4
II. Literature Review
This section is divided into two main subjects. Firstly, it includes a presentation of the main theories on the effect of privatization on firms’ performance. Afterwards, it focuses on the analysis of the empirical results reported in the most influent studies on this subject.
1. Theoretical Framework
The assumption behind privatization in many parts of the world is that private ownership improves corporate performance (Frydman et al., 1999). However, this is still a matter of debate for which theorists found no consensus.
Supporters of privatization argue that under competitive markets, the private sector can provide the same services more efficiently than the public sector, both in terms of technical and allocative efficiency (Megginson and Netter, 2001; Shleifer, 1998). This superior performance of privately owned companies can be explained by the different conditions these companies face in comparison with state-owned companies and can be briefly classified into four categories:
a) Harder budget constraints: the ‘property rights’ theorists argue that managers in public firms do not suffer the economic consequences of their decisions, which reduces the incentives to maximize performance. A major source of inefficiency in public firms stems from less-prosperous firms being allowed to rely on the government for funding, leading to soft budget constraints (Shleifer, 1998). Therefore, the discipline enforced on private firms by the capital markets and by the threat of financial distress is dramatically reduced for state-owned firms as they benefit of almost unlimited funding from government, minimizing the company connection with capital markets and lessening the bankruptcy risk to almost zero. Ultimately, these soft budget constrains faced by state-owned enterprises withdraw the pressure of good results from the manager, contributing to a worse performance.
b) More competitive and more efficient markets for corporate and managerial control: in line with the previous category, the ‘property rights’ theorists argue that managers in
5 public firms have weaker incentives to maximize performance as they do not face the threat of takeover. (Boycko et al., 1996; Vining and Boardman, 1992);
c) Clearer corporate and managerial goals: the political view of the Agency theory argues that governments pursue objectives in addition to and in conflict with profit maximization, and that this political interference can distort the objectives and constraints faced by managers (Shleifer and Vishny, 1997; Vickers and Yarrow, 1991). Commonly, government-owned firms forgo maximum profit in the pursuit of social and political objectives, such as wealth redistribution. However, this kind of goal is difficult to measure and to use as guiding policy for corporate operations (Megginson and Netter, 2001).
d) More intense monitoring: the managerial view of the Agency theory postulates the separation of ownership and control as the main source of relatively poorer performance of public firms as conflicts of interests will arise. Additionally, it argues that state-owned firms have difficulty on monitoring managers (Vickers and Yarrow, 1991). As stated above, the unclearness and incompatibility of the objectives of state-owned firms leads to greater difficulty in measuring the accomplishment of those goals and, consequently, in linking the manager’s performance to their accomplishment. Moreover, even if the government and the nation's citizens agree that profit maximization is the goal of the firm (leaving behind the incompatibility of profit and social welfare maximization), Shleifer (1998) argues that the owners of public firms (the nation’s citizens) are less able to write complete contracts that adequately tie managers' incentives to that goal.
However, as mentioned above, the view that government firms are inherently less efficient than private ones remains controversial among economists.
Vickers and Yarrow (1991), among others, point out that agency problems arise in private firms as well as in public ones. It happens because, in most large private corporations, managers own little of the stock. Therefore, a divergence between their objectives and those of private shareholders arises. As each private shareholder typically holds a small stake in the firm and as monitoring is costly, it may not pay any shareholder to bear the cost of monitoring management.
6 Other arguments against privatization have centered on the possibility that the higher performance of privatized companies has come at the expense of social welfare, namely by the exploitation of market power (and resulting higher prices) or by the reduction of employment and wages (Megginson and Netter, 2001). Likewise, several authors stated that the performance improvements in privatized state-owned firms are not due to the change in ownership but due to the competitive environment and capital-market discipline that greatly improve monitoring possibilities and hence increase incentives for production efficiency (Vickers and Yarrow, 1991).
Furthermore, a debate about the role of privatization and the role of market competition has arisen. Arguments for state-ownership rely on the need to regulate or own monopolies, intervene in case of externalities, and help provide public goods. Thus, Welfare theory would argue that privatization tends to have the greatest positive impact for state-owned firms in competitive markets or markets that can become readily competitive (Megginson and Netter, 2001). Nevertheless, Shleifer (1998) and others have argued that, for many of the reasons discussed above, even in markets for public goods and natural monopolies, state-owned firms are rarely the appropriate solution. As mentioned above, this is still a matter of debate. As stated by Megginson and Netter (2001), arguments for state-ownership rest on some market failure or perceived market failure. Arguments for privatization, in turn, are a response to the failings of state-ownership.
7
2. Empirical Evidence
There are several empirical studies evaluating the impact of state-ownership on firms’ performance. In this regard, besides the methodology of case-study analysis, there are two possible approaches: i) cross-sectional analysis, which compares the performance of state-owned companies and privately owned companies, or ii) time-series analysis, which examines the performance of a company before and after the privatization process.
Due to the serious methodological difficulties faced by the first mentioned approach1, as for instance the determination of the appropriate set of comparison firms or benchmarks, the research done in this paper follows the second approach. Therefore, the literature review is focused on studies that analyzed pre- versus post-privatization performance of privatized companies2. Nevertheless, a summary of recent papers comparing the performance of state-owned and privately owned companies is available at Megginson and Netter (2001) and the reported results suggest a consensus in this matter: all studies but one found evidence of better performance on privately owned companies3.
Since the first study published examining the effect of privatization on firm performance comparing pre- versus post-privatization performance, Megginson et al. (1994), a large number of studies using the same methodology emerged4.
Megginson et al. (1994) use a methodology that consists of the comparison of three-year average post-privatization operating performance ratios to the three-three-year pre-privatization values of firms in different countries and industries. Those authors tested for the significance of median changes in ratio values in the post- versus pre-privatization periods and also employed binomial tests for the percentage of firms
1
Detailed information about the methodological difficulties is available at Megginson and Netter (2001)
2
A summary of the methodology and main results of the papers discussed in this literature review is available in the Appendix I.
3
Despite this relative recent consensus, as surveyed in Boardman and Vining (1989), different studies realized before the 1990s found evidence of either superior performance of state-owned firms or privately owned firms, or no significant difference between performances.
4
A summary of the statistical results obtained in the three most cited papers on this subject is available in the Appendix II.
8 whose ratio changed according to their predictions. Their predictions are generally in accordance with the study of several authors and are as follow:
-Profitability: as firms move from public to private ownership, their profitability should increase. In contrast to government-ownership, private shareholders wish the firm to maximize profit. So, newly privatized firms' managers should place greater emphasis on profit goals (Yarrow et al., 1986).
-Operating efficiency: following privatization, firms should employ their human, financial and technological resources more efficiently because of a greater stress on profit goals and a reduction of government subsidies (Boycko et al., 1996; Kikeri et al., 1994).
-Capital investment: the greater emphasis on efficiency, the access to private debt and equity markets and the higher incentives to invest in growth opportunities will lead newly privatized firms to increase their capital investment spending (Megginson et al., 1994).
-Output: according to Megginson et al. (1994), following privatization, output should increase because of greater competition, better incentives and more flexible financing opportunities. However, the theoretical model of Boycko et al. (1996) predicts a fall in output since the government no longer subsidizes the newly privatized firms to maintain inefficiently high output levels.
-Employment: there is no consensus with regard to the impact of privatization on the level of employment. On the one hand, privatization might lead to an increase in the level of employment, since privatized firms probably would target growth and expand their investment spending. On the other hand, it is confirmed that most state-owned firms tend to be overstaffed for many social reasons. So, in order to increase efficiency, extensive layoffs would be expected following privatization (Kikeri et al., 1994).
-Leverage: according to Megginson et al. (1994), the switch from public to private ownership should lead to a decrease in the proportion of debt in the capital structure. This is expected due to the higher cost of borrowing that the company will face once the
9 government debt guarantees are withdrawn and due to their access to public equity markets.
-Dividends: following privatization, dividend payments should increase because, unlike governments, private investors generally demand dividends. Furthermore, dividend payments are a classic response to the atomized ownership structure which most privatization programs lead to (Megginson et al., 1994).
Following that methodology, analyzing the performance of 61 companies from 18 countries and 32 industries that were divested during 1961–1989, Megginson et al. (1994) documented statistically significant post-privatization increases in output, operating efficiency, profitability, capital investment spending and dividend payments, as well as significant decreases in leverage. Contrary to their predictions, Megginson et al. (1994) found that the median level of employment increases significantly (at the 10 percent significance level).
Megginson et al. (1994) also found that their basic results remain unchanged when they compared firms operating in competitive versus non-competitive industries, when they examined full versus partial privatizations, and when they compared industrialized and developing country privatizations. However, when Megginson et al. (1994) partitioned their data based on the fraction of a firm’s board that is replaced, they documented significantly greater performance improvements for the group of firms that experience 50 percent or greater turnover than for the group of companies experiencing less dramatic change in directors after divestment.
Using the same approach, Boubakri and Cosset (1998) analyzed the privatization experience of 79 companies from 21 developing countries divested between 1980 and 1992 and documented the same results: increases in output, operating efficiency, profitability, capital investment spending, employment and dividend payments, as well as significant decreases in leverage. Boubakri and Cosset (1998) also used market-adjusted measures to isolate macroeconomic and industry-level changes. The obtained results were similar, although the decrease in leverage becomes insignificant. Similar results were reported by Boubakri et al. (2005), when analyzing profitability, efficiency,
10 output and investment measures from privatized companies in 32 developed countries between 1980 and 1999.
The same results were reported in D'Souza et al. (2005), studying 129 companies from 23 developed countries privatized from 1961 to 1999, and in D'Souza and Megginson (1999) that studies 85 companies from 28 countries privatized during the period 1990– 1996. The only5 exception occurs for employment measures in which both studies documented an insignificant decrease.
In other study that analyzes 16 African firms divested through public share offering between 1989 and 1996, Boubakri and Cosset (1999) documented significant increased capital spending by privatized firms, but found only insignificant changes in profitability, efficiency, output and leverage.
In addition to the Megginson et al. (1994)’s methodology, Dewenter and Malatesta (2001) performed a multivariate regression analysis in order to control for changes occurring before privatization and for business cycle. Their results also documented significant increases in profitability and significant decreases in leverage over both short-term (3 years) and long-term (5 years) horizons. Contrary to Megginson et al. (1994) and Boubakri and Cosset (1998), labour intensity decreased significantly. Another important finding of this study is the increase of profits prior to divestiture, supporting the idea that privatization can have a significant anticipation effect.
This literature review focused on the most relevant international studies comparing pre- versus post-privatization performance demonstrates some consensus on the effect of privatization on profitability, output, operating efficiency, capital investment spending, dividend payments, and leverage. Except leverage, which decreases after privatization, all other parameters show an increase following state divestment. However, the effect on employment is not clear.
5
Note that there is an additional minor difference in D'Souza and Megginson (1999). Though absolute capital expenditures increase significantly, relative capital expenditures increase insignificantly.
11
III. Data and Sample
This section explains how the sample and the data were collected and presents its main descriptive statistics.
1. Sample selection
In order to try to understand the effect that privatization may have on countries of southern Europe, which will suffer a new wave of privatization in the coming years, it seems pertinent to study what effect privatization in the same countries has had in the operating performance of companies privatized in the last years.
For this purpose a sample of companies from Portugal, Italy, Greece and Spain privatized between 1985 and 2012 was selected. The sample of privatized firms was drawn from the Privatization Barometer Database, the official provider of privatization data to OECD and the World Bank. The analysis is limited to non-financial companies that privatized 5 percent or more of their equity. To avoid overlapping effects in companies where there were multiple privatization operations, only the first privatization operation of each company is considered. These selection criteria yield a sample of 256 companies.
Subsequently, the financial data for those companies was obtained from Capital IQ Database. Only companies with at least one annual observation in the years -3 to -1 and in the period +1 to +3 (where the year of privatization is defined as year 0) are considered. Thereafter, the final sample includes 45 companies (9 from Portugal, 22 from Italy, 5 from Greece and 9 from Spain). The list of companies included in this study is available in the Appendix III.
Finally, Consumer Price Index (CPI) used to calculate real sales, sales efficiency and net income efficiency, was drawn from the World Bank Database.
12
2. Sample description
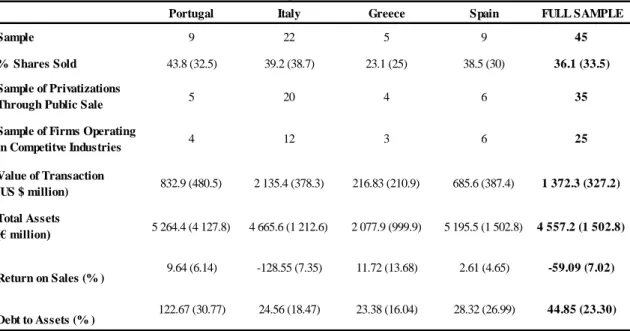
Table I presents some characteristics of the privatization transactions and privatized firms included in the sample.
As referred before, the sample includes 45 transactions, half of them occurring in Italy (22), 5 in Greece and 9 both in Portugal and Spain. On average, in each transaction, a 36% stake on the firm was sold by the government. This value is significantly higher for transactions that took place in Portugal (43.8%), and significantly lower for Greek transactions (23.1%).
The majority of the transactions included in the sample (35 out of 45) were public offers and almost half of the companies (25 out of 45) operated in competitive industries. Regarding the dimension of the transaction, Table I shows that on average (median), each transaction is worth 1 372 million dollars (372 million dollars). The average (median) transaction´s dimension is the largest in Italy (Portugal), being worth 2 135 million dollars (481 million dollars).
Portugal Italy Greece Spain FULL SAMPLE
Sample 9 22 5 9 45
% Shares Sold 43.8 (32.5) 39.2 (38.7) 23.1 (25) 38.5 (30) 36.1 (33.5)
Sample of Privatizations
Through Public Sale 5 20 4 6 35
Sample of Firms Operating
in Competitve Industries 4 12 3 6 25 Value of Transaction (US $ million) 832.9 (480.5) 2 135.4 (378.3) 216.83 (210.9) 685.6 (387.4) 1 372.3 (327.2) Total Assets (€ million) 5 264.4 (4 127.8) 4 665.6 (1 212.6) 2 077.9 (999.9) 5 195.5 (1 502.8) 4 557.2 (1 502.8) Return on Sales (% ) 9.64 (6.14) -128.55 (7.35) 11.72 (13.68) 2.61 (4.65) -59.09 (7.02) Debt to Assets (% ) 122.67 (30.77) 24.56 (18.47) 23.38 (16.04) 28.32 (26.99) 44.85 (23.30)
Table I: Sample Summary Statistics
This table presents some statistics related to the sample. It provides the number of transactions included in the sample, the mean (median) stake (in % of the company) sold by the government, the number of transactions that were publicly traded, the
number of firms operating in Competitve Industries (firms opperating in all industries with the exception of telecommunications, water and electric utilities), the mean (median) value of the transaction (in million dollars), the mean (median) value of total assets of the firms (in million euros) in the three years before privatization, the mean (median) return on
assets and debt to assets in the three years before privatization. In addition to the full sample data, data by country is also provided.
13 Regarding the firm characteristics, in the three years before privatization, on average (median), the total assets were equal to 4 557 million euros (1 503 million euros). Considering the mean and median total assets values, the largest firms privatized were Portuguese and Spanish companies. Profitability, measured by the return on sales, was on average (median), -59.09% (7.02%). This negative value for the average return on sales is mainly explained by some large negative values observed in Italy (which accounts for almost half of the full sample). However, note that the median return on sales for Italy is positive and similar to the median in Portugal. Finally, debt-to-assets ratio is on average (median) equal to 44.85% (23.30%) for the full sample. Data shows a higher leverage in Portuguese firms and a lower leverage in Greek firms.
14
IV. Methodology and Testable Predictions
In line with previous studies, the methodology used and testable predictions are similar to those in the reference work of Boubakri and Cosset (1998), D'Souza and Megginson (1999) and Megginson et al. (1994)
To test for changes on firms’ performance, firstly empirical proxies are computed for every company for a seven-year period, from three years before to three years after privatization.
Subsequently, the mean of each variable for each firm over the pre- and post-privatization windows (pre-post-privatization years: -3 to -1, post-post-privatization years: +1 to +3) is calculated. However, it is important to note that the sample includes companies that had one observation or more in each window. Furthermore, since the year of privatization (year 0) includes both the public and private ownership phases for all firms, it is excluded from the analysis.
To test for significant changes in the variables, two tests are used. The Wilcoxon signed-rank test is used to test whether the median difference in variable values between the pre- and post-privatization samples is zero. In addition to the Wilcoxon test, it is used a binomial Proportion Test to determine whether the proportion p of firms experiencing changes in a given direction is greater than would be expected by chance, typically testing whether p =0.5.
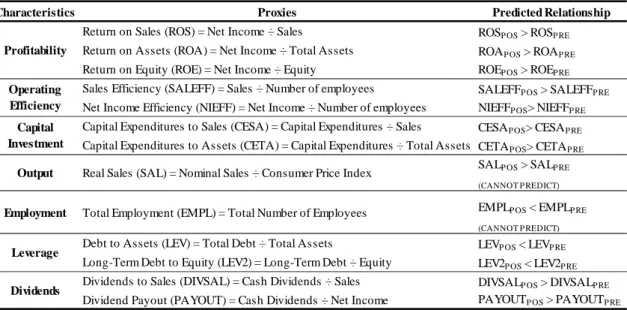
As summarized in Table II, following Megginson et al. (1994)’s predictions, it is tested whether a firm:
a) increases its profitability: to test for changes in profitability return on sales, return on assets and return on equity are used as proxies.
b) increases its operating efficiency: real sales (ie, inflation-adjusted sales) per employee and net income per employee are used to test for operating efficiency changes. For both measures values are normalized to equal 1 in the privatization year (year 0) so other year figures are expressed as a fraction of the value observed in the year of divestment.
15 c) increases its capital investment spending: two ratios are analyzed to test for investment changes, capital expenditures-to-sales and capital expenditures-to-total assets.
d) increases its output: real sales (ie, inflation-adjusted sales) are used to test for output changes. To compare pre- and post-privatization performance, values are normalized to equal 1 in the privatization year (year 0) so other year figures are expressed as a fraction of the value observed in the year of divestment.
e) decreases employment: total number of full time employees is used to test for employment changes. Once again, values are normalized to equal 1 in the privatization year (year 0) so other year figures are expressed as a fraction of the value observed in the year of divestment.
f) decreases leverage: two proxies are used to test for leverage changes, total debt-to-total assets and long-term debt-to-equity.
g) increases dividend payments: changes in the dividend policy are tested using two ratios, dividend-to-sales and dividend-to-net income.
Characteristics Proxies Predicted Relationship
Return on Sales (ROS) = Net Income ÷ Sales ROSP OS > ROSP RE
Return on Assets (ROA) = Net Income ÷ Total Assets ROAP OS > ROAP RE
Return on Equity (ROE) = Net Income ÷ Equity ROEP OS > ROEP RE
Sales Efficiency (SALEFF) = Sales ÷ Number of employees SALEFFP OS > SALEFFP RE
Net Income Efficiency (NIEFF) = Net Income ÷ Number of employees NIEFFP OS> NIEFFP RE
Capital Expenditures to Sales (CESA) = Capital Expenditures ÷ Sales CESAP OS> CESAP RE
Capital Expenditures to Assets (CETA) = Capital Expenditures ÷ Total Assets CETAP OS> CETAP RE
Output Real Sales (SAL) = Nominal Sales ÷ Consumer Price Index SALP OS > SALP RE
(CANNOT P REDICT)
Employment Total Employment (EMPL) = Total Number of Employees EMPLP OS < EMPLP RE (CANNOT P REDICT)
Debt to Assets (LEV) = Total Debt ÷ Total Assets LEVP OS < LEVP RE
Long-Term Debt to Equity (LEV2) = Long-Term Debt ÷ Equity LEV2P OS < LEV2P RE
Dividends to Sales (DIVSAL) = Cash Dividends ÷ Sales DIVSALP OS > DIVSALP RE
Dividend Payout (PAYOUT) = Cash Dividends ÷ Net Income PAYOUTP OS > PAYOUTP RE
Dividends
Table II: Summary of Testable Predictions
Profitability Operating Efficiency Capital Investment Leverage
This table details the economic characteristics that will be examined in order to evaluate changes in firms performance. It also presents and defines the preferred and alternative empirical proxies that will be employed in the analyses. In all cases with two or more proxies listed, the one listed first is considered to be the preferred and most reliable empirical variable because it
uses a current-euro measure in either the numerator or the denominator, or both. Furthermore, the predicted changes in the economic characteristics after privatization are detailed. The index words PRE and POS in the predicted relationship column
16 Following Boubakri and Cosset (1998), it is important to isolate the effect of privatization on the operating performance of state-owned firms from other determinants of this performance, like macro-economic or industry-level events. To take this possibility into account, in addition to the simple analysis mentioned above, market-adjusted accounting performance measures are used. Hence, the market-adjusted accounting performance measure of a firm is the difference between its accounting performance measure and its industry accounting performance measure. Note that the industry index for each company is estimated as the median ratio for all worldwide similar firms on the Capital IQ database. In this study, a company is considered to be similar to the one in analysis if it operates in the same industry and if its total assets or total revenues are contained in the interval corresponding to 125% and 75% of the total assets or total revenues of the original company, in the privatization year. The financial data for those companies was also obtained from Capital IQ Database. Due to the lack of financial data for similar companies, the market-adjusted analysis was computed only for 41 companies (5 from Portugal, 22 from Italy, 5 from Greece and 9 from Spain). To more closely analyse the effect of privatization, in addition to the full sample analysis, data was divided into two subsamples according to the level of competition in the industry and according to the percentage of the company sold by the government. Finally, to more effectively isolate the effect of the privatization, a multivariate analysis is also reported.
As argued in D'Souza et al. (2005), studies using accounting data are subject to numerous empirical hazards. However, in this study, some of these concerns are minimized. First, the fact that the sample is entirely from developed countries and mainly from publicly listed companies, it is expected a higher quality and a greater availability of accounting data. Second, sample selection bias is also reduced once, as stated by D'Souza et al. (2005), this concern is more relevant in earlier studies of privatization, which is not the case. Finally, contrary to many studies, a market-adjusted analysis is performed, controlling for business cycle and industry level changes, allowing comparisons between accounting information generated at different times in many different countries.
17
V. Univariate Analysis
In the following sections the empirical results are presented and discussed, using unadjusted performance measures for the whole sample of 45 privatized firms and adjusted performance measures for the 41 privatized firms for which market-adjusted ratios could be computed. Due to the lack of data, marked-market-adjusted measures for efficiency and employment could not be computed.
1. Full Sample Analysis
Profitability
Profitability is measured using three ratios: return on sales (ROS), return on assets (ROA) and return on equity (ROE). According to Boubakri and Cosset (1998), ROS is the most reliable ratio as it is based on two flow measures that are less sensitive to inflation and to accounting conventions. Therefore, the analysis is focused on the ROS ratio.
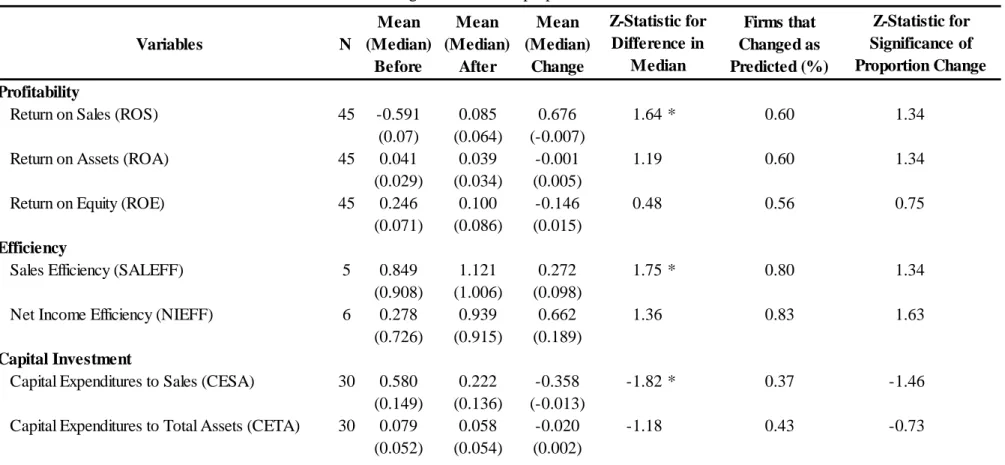
As reported in Table III, despite the inconsistency of the unadjusted results regarding the change in profitability depending on the analyzed measure (mean or median), both test statistics show improvements in profitability after divestiture. This increase in profitability is in accordance with the predictions of Megginson et al. (1994). Nevertheless, those improvements are only significant (at 10 percent level) for the ROS ratio.
The mean unadjusted return on sales goes from -5.9 percent before privatization to 8.5 percent after privatization. Sixty percent of the sample firms experienced an increase in ROS and ROA and 56 percent experienced an increase in ROE. As in D'Souza and Megginson (1999), Megginson et al. (1994) and Boubakri and Cosset (1998), results are stronger for the return on sales. Similar to this study, increases in ROE are insignificant in those three studies.
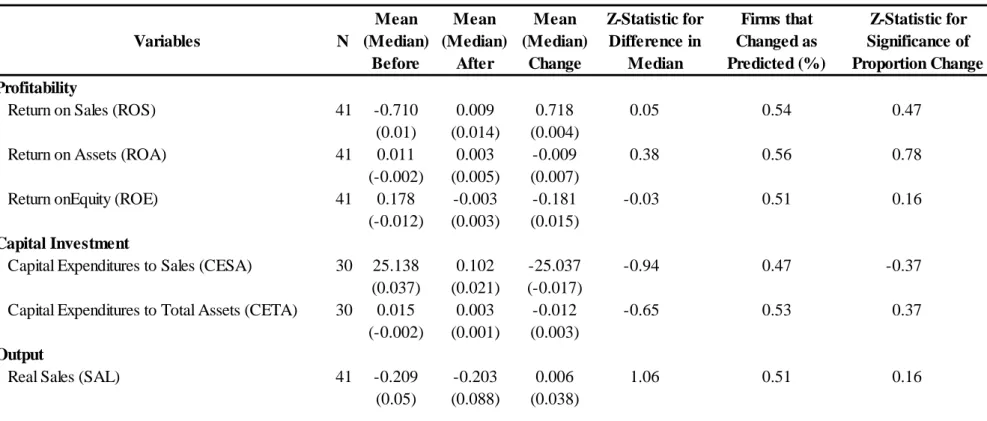
Regarding the market-adjusted data, as occurred in Boubakri and Cosset (1998), the significance of results diminishes. Therefore, as it can be seen in Table IV, the increase in profitability is not significant anymore, contrary to what happened in Boubakri and Cosset (1998), where the increase in ROS was significant.
18 Variables N Mean (Median) Before Mean (Median) After Mean (Median) Change Firms that Changed as Predicted (%) Profitability
Return on Sales (ROS) 45 -0.591 0.085 0.676 1.64 * 0.60 1.34
(0.07) (0.064) (-0.007)
Return on Assets (ROA) 45 0.041 0.039 -0.001 1.19 0.60 1.34
(0.029) (0.034) (0.005)
Return on Equity (ROE) 45 0.246 0.100 -0.146 0.48 0.56 0.75
(0.071) (0.086) (0.015)
Efficiency
Sales Efficiency (SALEFF) 5 0.849 1.121 0.272 1.75 * 0.80 1.34
(0.908) (1.006) (0.098)
Net Income Efficiency (NIEFF) 6 0.278 0.939 0.662 1.36 0.83 1.63
(0.726) (0.915) (0.189)
Capital Investment
Capital Expenditures to Sales (CESA) 30 0.580 0.222 -0.358 -1.82 * 0.37 -1.46
(0.149) (0.136) (-0.013)
Capital Expenditures to Total Assets (CETA) 30 0.079 0.058 -0.020 -1.18 0.43 -0.73
(0.052) (0.054) (0.002)
Table III: Summary of Unadjusted Results for the Sample of All Privatized Firms
This table presents the unadjusted empirical results for the full sample of privatized firms. For each empirical proxy it provides the number of usable observations, the mean and median values of the proxy for the three-year periods mean prior and subsequent to privatization, the mean and median change in
the proxy’s three-year mean value after versus before privatization. It also provides the Wilcoxon signed rank test (with its Z-statistics) as the test for significance for the change in median values. The final two columns detail the percentage of firms whose proxy values changed as predicted and a test of
significance for this proportion.
Z-Statistic for Difference in Median Z-Statistic for Significance of Proportion Change
19
Output
Real Sales (SAL) 43 0.951 1.281 0.330 4.31 *** 0.86 4.73 ***
(0.93) (1.192) (0.263)
Employment
Full-Time Employees (EMPL) 6 1.098 1.041 -0.058 -0.73 0.67 0.82
(1.073) (0.965) (-0.108)
Leverage
Debt to Assets (LEV) 45 0.449 0.252 -0.197 -0.25 0.49 -0.15
(0.233) (0.253) (0.02)
Long-Term Debt to Equity (LEV2) 43 1.492 0.433 -1.059 -0.37 0.49 -0.15
(0.36) (0.362) (0.002)
Dividends
Dividend to Sales (DIVSAL) 31 0.033 0.062 -0.197 3.19 *** 0.84 3.77 ***
(0.014) (0.042) (0.02)
Payout Ratio (PAYOUT) 30 0.208 0.575 -1.059 3.65 *** 0.90 4.38 ***
(0.224) (0.531) (0.002)
20 Variables N Mean (Median) Before Mean (Median) After Mean (Median) Change Firms that Changed as Predicted (%) Profitability
Return on Sales (ROS) 41 -0.710 0.009 0.718 0.05 0.54 0.47
(0.01) (0.014) (0.004)
Return on Assets (ROA) 41 0.011 0.003 -0.009 0.38 0.56 0.78
(-0.002) (0.005) (0.007)
Return onEquity (ROE) 41 0.178 -0.003 -0.181 -0.03 0.51 0.16
(-0.012) (0.003) (0.015)
Capital Investment
Capital Expenditures to Sales (CESA) 30 25.138 0.102 -25.037 -0.94 0.47 -0.37
(0.037) (0.021) (-0.017)
Capital Expenditures to Total Assets (CETA) 30 0.015 0.003 -0.012 -0.65 0.53 0.37
(-0.002) (0.001) (0.003)
Output
Real Sales (SAL) 41 -0.209 -0.203 0.006 1.06 0.51 0.16
(0.05) (0.088) (0.038)
Table IV: Summary of Market-Adjusted Results for the Sample of Market-Adjusted Firms
This table presents, for the sample of firms for which it was possible to compute market-adjusted accounting performance measures, market-adjusted results. Market-adjusted proxies are obtained by subtracting the market empirical accounting proxy from the firm’s accounting proxy in the sample. The market proxies are calculated as the median values of each proxy for a sample of similar firms available on the IQ Capital database. The table provides, for selected accounting performance measures, the number of available observations, the median values for the three-year period mean before and after privatization, and
the change in median values. It also presents the Wilcoxon Z statistic for the difference in medians and the Binomial test for the proportion of firms whose proxy changed as predicted.
Z-Statistic for Difference in Median Z-Statistic for Significance of Proportion Change
21
Leverage
Debt to Assets (LEV) 41 -0.008 -0.021 -0.014 -0.65 0.59 1.09
(-0.058) (-0.022) (0.036)
Long-Term Debt to Equity (LEV2) 41 1.029 -0.066 -1.095 -0.32 0.51 0.16
(-0.159) (-0.08) (0.08)
Dividends
Dividend to Sales (DIVSAL) 32 0.057 0.092 0.036 2.71 *** 0.69 2.12 **
(0.048) (0.074) (0.026)
Payout Ratio (PAYOUT) 31 0.465 0.889 0.424 3.86 *** 0.84 3.77 ***
(0.512) (0.907) (0.395)
22 These results suggest that despite the increase in profitability experienced after privatization, this improvement may be explained by macroeconomic factors since the market experienced a similar increase in profitability.
Efficiency
To measure efficiency, two measures are employed: inflation-adjusted sales per employee (SALEFF) and net income per employee (NIEFF). As explained before, both measures are transformed into an index in which the ratio observed in the privatization year assumes the value 1 and the remaining years are expressed relative to the privatization year. Due to the reduced number of observations available, the results must be interpreted carefully.
As in D'Souza and Megginson (1999), Megginson et al. (1994), Boubakri and Cosset (1998), both SALEFF and NIEFF show median and mean increases following privatization, although the increase is significant (at 5 percent level) only for SALEFF. Nevertheless, as reported in Table III, for both ratios more than 80% of the firms experienced an increase in efficiency. These findings are in accordance with Megginson et al. (1994)’s predictions, suggesting that privatized companies tend to increase productivity.
The sales per employee increases from an average (median) of 0.85 (0.91), during the pre-privatization period, to an average (median) of 1.12 (1.00), in the post-privatization period. Net income per employee also increases from a mean (median) 0.28 (0.73) before privatization to 0.94 percent (0.92) afterwards.
Investment
Investment intensity is computed using two proxies: capital expenditures divided by sales (CESA) and capital expenditures divided by total assets (CETA).
Though both ratios related are found to consistently decrease, only results for CESA are significant (at 10 percent level) according to the Wilcoxon signed rank test. Furthermore, the adjusted results show a decrease that is insignificant for both ratios, both for the Wilcoxon and the Proportion Test. These results are similar to D'Souza and Megginson (1999) that found an insignificant decrease in investment, but are contrary to
23 Boubakri and Cosset (1998) and Megginson et al. (1994) that found a significant increase in these ratios.
Despite these results, an analysis to the change in capital expenditures (CAPEX) reveals that, prior to divestment, the sample firms presented CAPEX levels that were on average (median) 105 percent (94 percent) of year 0 levels. After privatization those levels were 137 percent (101 percent) of year 0. Thus, these results show that the decrease in CETA is, at least partially, explained by a growth in total assets higher than the growth in investment, and not by the decrease of CAPEX.
Output
Changes in output are tested by computing the average inflation-adjusted sales (SAL) level for the pre- and post-privatization. Afterwards, following the methodology applied for the calculation of CESA and CETA, real sales values are transformed into an index in which the output from the privatization year (year 0) assumes the value 1.
As predicted by Megginson et al. (1994), both the Wilcoxon and Proportion Tests show that real sales increase after privatization, and the change is significant at the 1 percent level under both measures. Similar results were obtained by D'Souza and Megginson (1999), Boubakri and Cosset (1998) and Megginson et al. (1994). As reported in Table III, the mean (median) increase in real sales from the average level during the three years prior to divestiture to the average level afterward is 33 percentage points (26 points), and 86 percent of all firms experience increased real sales. Prior to divestment, the sample firms have deflated sales levels that are on average (median) 95 percent (93 percent) of year 0 levels. By the year of privatization, output increases slightly (to an index level of 100), before surging to 128 percent (119 percent) of year 0 levels after privatization.
Besides the strong results in the adjusted data, Table IV shows that the market-adjusted data reveals an increase in sales that is insignificant according both to the Wilcoxon and Proportion Test. Thus, despite the significant increase in sales after privatization, those improvements are not stronger than the experienced by the market, which suggest that privatization is not the source of such increase.
24
Employment
Employment changes are examined by computing the average of the total number of employees (EMPL) for the three-year periods -3 to -1 and +1 to +3, transforming those values into an index in which the privatization year is the base, and then testing whether employment falls after divestiture. Due to the reduced number of observations, results must be interpreted carefully.
Empirical literature shows some inconsistency regarding the behaviour of employment after privatization. Boubakri and Cosset (1998) and Megginson et al. (1994) show significant employment increases while D'Souza and Megginson (1999) show an insignificant decrease. The results from the data analyzed in this work do not allow a clarification of this issue. Table III shows an insignificant change in employment. Nevertheless, both mean and median results reveal a slight decrease in employment levels of 6 and 11 percentage points, respectively.
Leverage
Leverage is measured by the total to-total assets (LEV) and by the long-term debt-to-equity (LEV2) ratios.
As seen in Table III and IV, both unadjusted and market-adjusted data show little difference between the level of leverage in pre- and post-privatization years. Nevertheless, the Wilcoxon test shows a (insignificant) decrease in leverage. These results are rather different from the ones obtained by Boubakri and Cosset (1998), Megginson et al. (1994) and D'Souza and Megginson (1999), where a significant decrease in leverage is reported.
These results suggests that, contrary to the argument that companies with state support tend to have higher levels of debt due to the availability of state guarantees, privatization do not have a significant impact on leverage.
Dividends
Dividend policy changes were measured by the dividend-to-sales ratio (DIVSAL) and the dividend payments divided by net income (PAYOUT).
25 As predicted by Megginson et al. (1994), both ratios show significant increases for both unadjusted and market-adjusted data according to the Wilcoxon and Proportion tests. The average (median) unadjusted dividend-to-sales ratio increases from 3.3 percent (1.4 percent) before privatization to 6.2 percent (4.2 percent) after privatization. Using unadjusted and market-adjusted data, 84 percent and 69 percent of the privatized firms, respectively, distribute more dividends as a proportion of their sales. The average (median) unadjusted payout ratio increases from 2.1 percent (2.2 percent) before privatization to 5.8 percent (5.3 percent) after privatization. Using unadjusted and market-adjusted data, 90 percent and 84 percent of the privatized firms, respectively, distribute more dividends as a proportion of their sales.
Those results are very similar to the ones reported by Boubakri and Cosset (1998), Megginson et al. (1994) and D'Souza and Megginson (1999) , where a significant (at 1 percent level) increase of dividends was reported.
2. Subsample Analysis
To more closely analyse the effect of privatization, market-adjusted and unadjusted results are also discussed for two subsamples.
First, to determine whether post-privatization performance depends on the change of control, the sample was partitioned into control privatizations (in which the government sells enough shares to bring its holdings below 50 percent) and revenue privatizations (in which the government retains a majority stake). In this regard, Boardman and Vining (1989) and Boycko et al. (1996) suggest that, in order to facilitate restructuring, both cash flow rights and voting control rights should pass from governments to private hands.
Second, the full sample is partitioned into competitive and non-competitive firms to determine whether the effect of privatization varies according to the prevailing market structure. According to D'Souza and Megginson (1999), privatization of enterprises in competitive industries is likely to yield solid and rapid economic benefits as long as there are no economy-wide distortions that hinder competition. Hence, as argued by Vickers and Yarrow (1991), competition can greatly improve monitoring possibilities and incentives for productive efficiency. However, for the sale of enterprises in
non-26 competitive sectors, the steps are more numerous and the process is more complex. According to D'Souza and Megginson (1999), competitive firms are defined as those that are subject to international product market competition, and non-competitive firms as those that are relatively free of product market competition. Thus, as did D'Souza and Megginson (1999), firms from the telecommunications, water and electric utilities are included in the non-competitive sample and all other firms in the competitive sample.
Control and Revenue Privatization Analysis
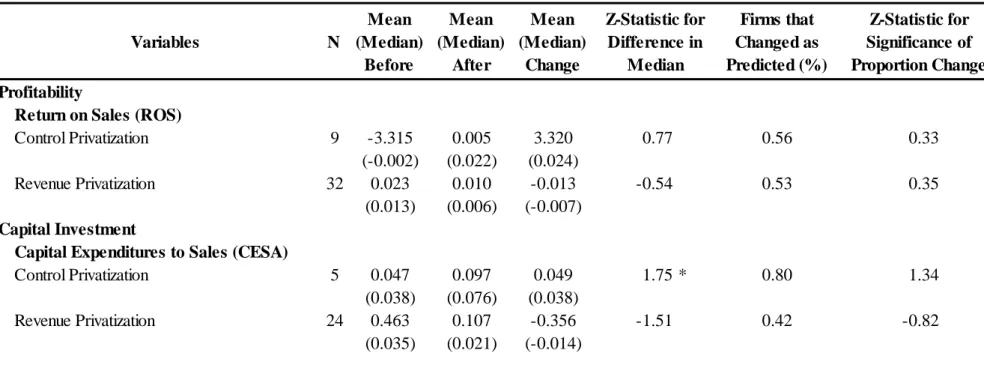
As shown in Table V and VI, the subsample unadjusted analysis reveals an increase in profitability that is more significant for control privatizations (the increase in ROS is significant at 5 percent level) than for revenue privatizations (the increase in ROS is insignificant). Market-adjusted results reveal the same trend, although none of the value is significant. In fact, when adjusted to market index, the ROS ratio from revenue privatizations shows an insignificant reduction. These findings corroborate the predictions of Boardman and Vining (1989) that firms in which the government brings its holdings below 50 percent will experience stronger changes in performance.
Regarding the investment, Table V reveals that the decrease in CESA is more significant for revenue privatizations, where the decrease is significant at 5 percent level. However, as shown in Table VI, when data is adjusted for market measures, the difference is even more evident. Companies that experienced revenue privatizations show an insignificant decrease in CESA, while companies that experienced control privatizations show an increase (significant at a 10 percent level) in that measure. Once again, these results are in accordance with the predictions of Boardman and Vining (1989) and suggest that when the government loses the control (selling 50 percent or more of the company), the company puts more emphasis on the level of investment and reveals an evolution that is more expansionist than the experienced by the market. While the change in leverage is quite similar both for control and revenue privatizations, real sales seem to increase more significantly in the second group of companies both according to the adjusted and unadjusted results, contradicting the predictions of Boardman and Vining (1989)
27 Finally, as shown in Table V, the increase in the payment of dividends is more significant for firms experiencing revenue privatizations (the increase in DIVSAL is significant at a 1 percent level) than for control privatizations (the increase in DIVSAL is significant at a 10 percent level). However, when the data is adjusted by the market performance, the opposite occurs. The increase in DIVSAL is significant at 1 and 5 percent level of significance for revenue and control privatizations, respectively. This suggest that the increase in dividends after privatization is common both to control and revenue privatizations, and is more significant in the first group, corroborating the predictions of Boardman and Vining (1989)
28 Variables N Mean (Median) Before Mean (Median) After Mean (Median) Change Firms that Changed as Predicted (%) Profitability
Return on Sales (ROS)
Control Privatization 10 -2.961 0.070 3.031 2.40 ** 0.80 1.90 *
(-0.009) (0.049) (0.058)
Revenue Privatization 35 0.086 0.090 0.003 0.47 0.54 0.51
(0.076) (0.072) (-0.004)
Capital Investment
Capital Expenditures to Sales (CESA)
Control Privatization 5 148.661 0.118 -148.543 0.13 0.60 0.45
(0.119) (0.046) (-0.073)
Revenue Privatization 25 0.604 0.243 -0.361 -1.98 ** 0.32 -1.80 *
(0.173) (0.138) (-0.034)
This table presents a comparison between the unadjusted performance changes of firms experiencing control privatizations (in which the government sells enough shares to bring its holdings below 50 percent) versus revenue privatization (in which the government retains a majority stake). It provides, for selected performance measures,the number of available observations, the median values for the three-year period mean before and after privatization, and
the change in median values. It also provides the Wilcoxon Z statistic for the difference in medians and the Binomial test for the proportion of firms whose proxy changed as predicted.
Z-Statistic for Difference in Median Z-Statistic for Significance of Proportion Change Table V: Summary of Unadjusted Results for the Control Privatization versus Revenue Privatization
29
Output
Real Sales (SAL)
Control Privatization 8 0.905 1.148 0.243 2.10 ** 0.88 2.12 **
(0.873) (1.174) (0.301)
Revenue Privatization 35 0.962 1.312 0.350 3.78 *** 0.86 4.23 ***
(0.931) (1.194) (0.263)
Leverage
Debt to Assets (LEV)
Control Privatization 10 1.054 0.203 -0.851 -0.15 0.60 0.60
(0.222) (0.181) (-0.04)
Revenue Privatization 35 0.276 0.265 -0.010 -0.07 0.46 -0.51
(0.233) (0.269) (0.037)
Dividends
Dividend to Sales (DIVSAL)
Control Privatization 4 0.021 0.088 0.068 1.83 * 1.00 2.00 **
(0.02) (0.062) (0.041)
Revenue Privatization 27 0.035 0.058 0.023 2.71 *** 0.81 3.27 ***
(0.013) (0.042) (0.029)
30 Variables N Mean (Median) Before Mean (Median) After Mean (Median) Change Firms that Changed as Predicted (%) Profitability
Return on Sales (ROS)
Control Privatization 9 -3.315 0.005 3.320 0.77 0.56 0.33
(-0.002) (0.022) (0.024)
Revenue Privatization 32 0.023 0.010 -0.013 -0.54 0.53 0.35
(0.013) (0.006) (-0.007)
Capital Investment
Capital Expenditures to Sales (CESA)
Control Privatization 5 0.047 0.097 0.049 1.75 * 0.80 1.34
(0.038) (0.076) (0.038)
Revenue Privatization 24 0.463 0.107 -0.356 -1.51 0.42 -0.82
(0.035) (0.021) (-0.014)
Table VI: Summary of Market-Adjusted Results for the Control Privatization versus Revenue Privatization
This table presents a comparison between the market-adjusted performance changes of firms experiencing control privatizations (in which the government sells enough shares to bring its holdings below 50 percent) versus revenue privatization (in which the government retains a majority stake). Market-adjusted proxies are obtained by subtracting the market median empirical accounting proxy from the firm’s accounting proxy in the sample. Market proxies are calculated as the median values of each proxy for a sample of similar firms available on the IQ Capital database. This table provides, for selected performance measures,the number of available observations, the median values for the three-year period mean before and after privatization, and
the change in median values. It also provides the Wilcoxon Z statistic for the difference in medians and the Binomial test for the proportion of firms whose proxy changed as predicted.
Z-Statistic for Difference in Median Z-Statistic for Significance of Proportion Change
31
Output
Real Sales (SAL)
Control Privatization 9 -1.215 -2.017 -0.802 -0.06 0.56 0.33
(0.041) (0) (-0.041)
Revenue Privatization 32 0.074 0.244 0.170 1.23 0.50 0.00
(0.053) (0.088) (0.035)
Leverage
Debt to Assets (LEV)
Control Privatization 9 -0.072 -0.097 -0.025 -0.06 0.67 0.67
(-0.131) (-0.05) (0.081)
Revenue Privatization 32 0.010 -0.007 -0.018 -0.73 0.56 0.71
(-0.051) (-0.017) (0.034)
Dividends
Dividend to Sales (DIVSAL)
Control Privatization 6 0.035 0.101 0.066 2.20 ** 1.00 2.45 **
(0.037) (0.064) (0.027)
Revenue Privatization 26 0.061 0.093 0.032 1.94 * 0.62 1.18
(0.052) (0.074) (0.022)
32
Competitive and Non-Competitive Firms Analysis
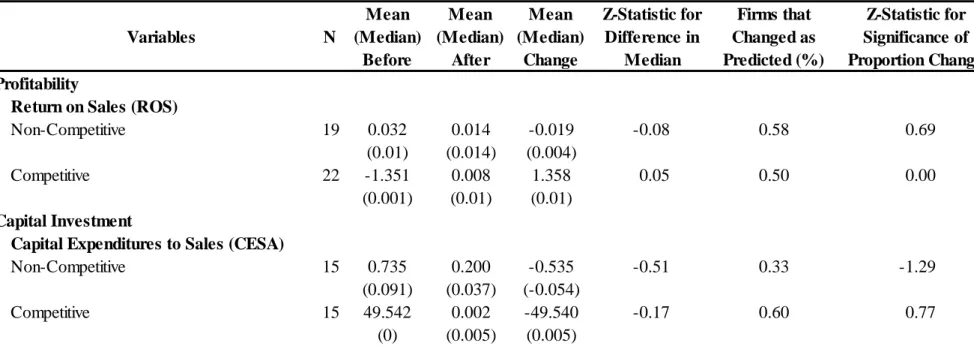
As shown in both Table VII and VIII, although all the changes in ROS remain insignificant, both unadjusted and market-adjusted analyses reveal a slight greater profitability enhancement in firms operating in competitive industries. This finding is in accordance with the prediction of Vickers and Yarrow (1991) that argue that firms operating in competitive industries will experience stronger changes in performance. Regarding the investment changes, although the unadjusted data shows a decrease in leverage that is more significant for firms operating in competitive industries, when data is adjusted by the market performance, this difference becomes almost null.
Table VII also shows an increase in real sales for both competitive and non-competitive firms. Nevertheless, Table VIII reveals that when adjusted by market performance, the change in real sales becomes insignificant for both competitive and non-competitive firms.
Changes in leverage are not significantly different. Nonetheless, both for unadjusted and adjusted results, there is some evidence of a reduction in leverage for non-competitive firms and an increase for competitive firms (even though all the changes are insignificant).
Finally, both Table VII and VIII reveal that the increase in the payment of dividends is more significant for companies operating in non-competitive industries than for companies operating in competitive industries. This result is valid both for the adjusted and unadjusted analysis and both for mean and median values, which shows a clear sign of rent extraction.
33 Variables N Mean (Median) Before Mean (Median) After Mean (Median) Change Firms that Changed as Predicted (%) Profitability
Return on Sales (ROS)
Non-Competitive 20 0.105 0.106 0.000 0.56 0.65 1.34
0.086 0.099 0.013
Competitive 25 -1.148 0.074 1.222 1.57 0.56 0.60
0.046 0.050 0.003
Capital Investment
Capital Expenditures to Sales (CESA)
Non-Competitive 15 0.864 0.336 -0.529 -0.40 0.33 -1.29
0.238 0.257 0.018
Competitive 15 49.696 0.108 -49.587 -1.65 * 0.40 -0.77
0.090 0.046 -0.043
This table presents a comparison between the unadjusted performance changes of non-competitive privatized firms (firms from the telecommunication and water and electric utilities) versus competitive privatized firms. It provides, for selected performance measures,the number of available observations, the median values for the three-year period mean before and after privatization, and the change in median values. It also provides the Wilcoxon Z Statistic for
the difference in medians and the Binomial Test for the proportion of firms whose proxy changed as predicted.
Z-Statistic for Difference in Median Z-Statistic for Significance of Proportion Change Table VII: Summary of Unadjusted Results for the Non-Competitive versus Competitive Privatized Firms
34
Output
Real Sales (SAL)
Non Competitive 20 1.010 1.371 0.361 2.50 ** 0.85 3.13 ***
0.931 1.213 0.282
Competitive 23 0.900 1.215 0.315 3.59 *** 0.87 3.54 ***
0.880 1.192 0.313
Leverage
Debt to Assets (LEV)
Non Competitive 20 0.338 0.344 0.006 0.45 0.40 0.40
0.281 0.316 0.035
Competitive 25 0.537 0.187 -0.350 -0.69 0.56 0.60
0.192 0.173 -0.019
Dividends
Dividend to Sales (DIVSAL)
Non Competitive 15 0.032 0.066 0.034 3.07 *** 0.93 3.36 ***
0.018 0.046 0.028
Competitive 16 0.035 0.058 0.023 1.60 0.75 2.00 **
0.014 0.034 0.020
35 Variables N Mean (Median) Before Mean (Median) After Mean (Median) Change Firms that Changed as Predicted (%) Profitability
Return on Sales (ROS)
Non-Competitive 19 0.032 0.014 -0.019 -0.08 0.58 0.69
(0.01) (0.014) (0.004)
Competitive 22 -1.351 0.008 1.358 0.05 0.50 0.00
(0.001) (0.01) (0.01)
Capital Investment
Capital Expenditures to Sales (CESA)
Non-Competitive 15 0.735 0.200 -0.535 -0.51 0.33 -1.29
(0.091) (0.037) (-0.054)
Competitive 15 49.542 0.002 -49.540 -0.17 0.60 0.77
(0) (0.005) (0.005)
Table VIII: Summary of Market-Adjusted Results for the Non-Competitive versus Competitive Privatized Firms
This table presents a comparison between the market-adjusted performance changes of non-competitive privatized firms (firms from the telecommunication and water and electric utilities) versus competitive privatized firms. Market-adjusted proxies are obtained by subtracting the market median empirical accounting proxy from the firm’s accounting proxy in the sample. Market proxies are calculated as the median values of each proxy for
a sample of similar firms available on the IQ Capital database. This table provides, for selected performance measures,the number of available observations, the median values for the three-year period mean before and after privatization, and the change in median values. It also provides the
Wilcoxon Z Statistic for the difference in medians and the Binomial Test for the proportion of firms whose proxy changed as predicted.
Z-Statistic for Difference in Median Z-Statistic for Significance of Proportion Change
36
Output
Real Sales (SAL)
Non Competitive 19 -0.469 -0.542 -0.073 1.05 0.53 0.23
(0.012) (0.167) (0.155)
Competitive 22 0.015 0.029 0.014 0.47 0.50 0.00
(0.053) (0.026) (-0.027)
Leverage
Debt to Assets (LEV)
Non Competitive 19 0.031 0.034 0.003 0.04 0.47 0.47
(-0.044) (0) (0.045)
Competitive 22 -0.041 -0.055 -0.014 -0.80 0.68 1.71 *
(-0.063) (-0.083) (-0.02)
Dividends
Dividend to Sales (DIVSAL)
Non Competitive 15 0.077 0.102 0.025 2.16 ** 0.73 1.81 *
(0.064) (0.087) (0.023)
Competitive 17 0.040 0.068 0.028 1.73 * 0.65 1.21
(0.022) (0.053) (0.031)