Multi-Platooning Leaders Positioning and
Cooperative Behavior Algorithms of Communicant
Automated Vehicles for High Traffic Capacity
Pedro Fernandes, Member, IEEE, and Urbano Nunes, Senior Member, IEEE
Abstract—Multi-platooning leaders positioning and coopera-tive behavior strategies are proposed in this paper, to improve the efficiency of a traffic system of communicant automated vehicles evolving on dedicated lanes. Novel algorithms to ensure high traffic capacity are presented, and Matlab/Simulink-based simulation results are reported. In previous research work, we proposed new algorithms to mitigate communication delays effects on platoon string stability using anticipatory information. In this paper we consider a constant spacing between platoons’ leaders as a fundamental condition to attain high traffic capac-ity. New algorithms to maintain interplatoon leaders’ constant spacing are proposed, as well as novel algorithms allowing vehicles to enter the main track cooperatively. Furthermore, a new set of algorithms to improve safety is also presented. A novel agent-based architecture was developed, where each vehicle consists of two distinct modules: a leader and a follower. Based on Matlab/Simulink simulations of several scenarios, the new algorithms are assessed and the simulation results presented, confirming that the proposed algorithms ensure high traffic capacity and vehicle density, and avoid traffic congestion. These features were validated through simulations performed on the SUMO simulation platform, using a new car-following model. The results proved that the proposed algorithms enable a clear benefit of a platooning system, when compared to bus and light rail-based transit systems.
Index Terms—Advanced traffic management systems (ATMS), cooperative automated vehicles (CAV), cooperative behavior, high traffic capacity, intervehicle communications (IVC), multi-platooning leaders positioning, personal rapid transit (PRT), pla-toon leaders’ constant spacing, plapla-tooning, safety improvement, traffic simulation.
I. INTRODUCTION
T
HIS research addresses urban traffic congestion,propos-ing a novel approach to improve mobility, and is part of a more vast research project regarding a comprehensive ap-proach to solve metropolitan mobility through the integration of complementary concepts towards a co-modality solution.
The main challenge is to improve road capacity and avoid traffic congestion. For common traffic, when vehicle density is high, perturbations may cause traffic jams [1]. Platooning may help to improve lane capacity, particularly if constant vehicles’ spacing is used in the platoons [2], [3].
Manuscript received
This work was supported by Portuguese Foundation for Science and Technology, QREN and COMPETE program under Grants RECI/EEI-AUT/0181/2012 and Centro-07-ST24-FEDER-002028.
The authors are with the Institute of Systems and Robotics, Department of Electrical and Computer Engineering, University of Coimbra, 3030-290 Coim-bra, Portugal (e-mail: [email protected]; [email protected]).
Color versions of one or more of the figures in this paper are available online at http://ieeexplore.ieee.org.
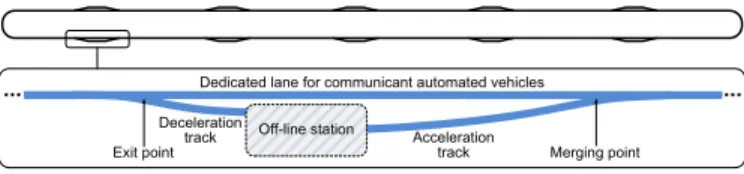
Deceleration
track Acceleration track Off-line station
Dedicated lane for communicant automated vehicles
Exit point Merging point
... ...
Fig. 1. Dedicated lane for cooperative automated vehicles, showing a zooming view of an off-line station and the exit and merging points.
A) Scenario Definition
The considered scenario of this research work consists of a highly dynamic and flexible simulation of IVC-enabled cooperative automated vehicles (CAV), in an urban context, where platoons’ vehicles are constantly exiting and entering the main track at off-line stations. Fig. 1 shows an example of a dedicated track with exit and entrance points. The specific context used in the simulations performed through this study considered a dedicated track of a fixed guideway for the exclusive use of CAV, in a similar configuration of personal rapid transit (PRT) vehicles. Therefore, no lane changes are considered. Fig. 2 presents a brief description of the problems to tackle for a system of platoons of CAV to operate at high traffic capacities. In Fig. 2a the interaction between higher layers of an advanced traffic management system (ATMS) and the platoon leaders are shown, since the monitoring and control of the leaders should be undertaken at the multi-platoon level to maintain the whole system operational and to avoid traffic congestion. However, for that layer to operate properly, platoon string stability must be ensured within each platoon, which is dealt with at a lower layer as shown in Fig. 2b. This, in turn, require reliable intervehicle communications (IVC), as shown in Fig. 2c, since they are mandatory for the platoon to be string stable when using an intervehicle constant spacing policy [3]. B) Research Prerequisites
In our previous work [4], we proposed new information updating algorithms to mitigate the effects of communication delays on platoon string stability. To achieve our goal, we enclosed the communication, computation and actuation de-lays within an upper bound delay, managed by algorithms that avoid their impact on the platoon string stability. Moreover, using intervehicle communications (IVC), we also assessed the behavior of the dedicated short range communications (DSRC) [5]–[7], through the NS-3 simulator [8], under the presented platooning scenarios. Therefore, higher traffic capac-ity is theoretically achievable, since vehicles may evolve very
L L
User demand Traffic monitoring
(a) Multi-platoon level: leaders’ monitoring and control by the ATMS Vehicle 2 Vehicle 1 DSRC DSRC Vehicle 4 Vehicle 3 DSRC DSRC Vehicle 5 Vehicle 6 DSRC DSRC Vehicle 8 Vehicle 7 DSRC DSRC
(b) Platoon level: string stability using IVC
Vehicle i+1 Vehicle i
DSRC DSRC
(c) Vehicle level: reliable IVC and radar/lidar
Fig. 2. Challenges that must be addressed to ensure high traffic capacity.
close to each other in platoons. Simulation results obtained through the Simulation for Urban MObility (SUMO) traffic simulator [9], with a new car-following model to allow the simulation of automated vehicles as reported in [10], sug-gest that we may envisage to break down the traffic flow limits of conventional traffic with human-driven vehicles, as shown in Fig. 4. However, interplatoon strategies must also be addressed, to ensure that traffic congestion is avoided when operating at such high vehicle density values.
C) Research Context
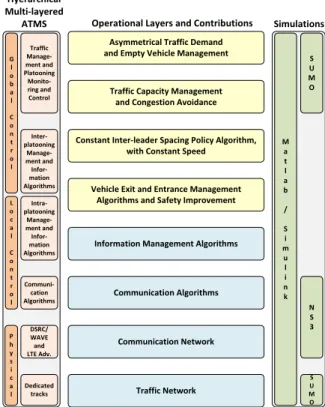
In this paper we propose new algorithms to ensure high traffic flow of a system operating at high traffic densities, while avoiding traffic congestion, addressing the four upper operational layers of the hierarchical ATMS shown in Fig. 3. In the proposed algorithms a constant spacing between platoons’ leaders is considered as a fundamental condition to attain high traffic capacity of a multi-platooning traffic system by avoiding speed variations of platoons and keeping enough space available to permanently accommodate up to eight vehicles per platoon, which correspond to the context shown in Fig. 2a. The algorithms and simulation results presented in this paper are made possible by the use of the information-updating algorithms proposed in [4], whose operational layers are the four bottom operational layers in Fig. 3, corresponding to the context shown in Fig. 2b and Fig. 2c. Without the mitigation of communication delays’ effects over the platoon string stability it would not be viable to propose the present algorithms, which rely upon that previous framework of very string stable platoons.
Traffic Network
v
Communication Network Communication Algorithms Information Management Algorithms Vehicle Exit and Entrance Management Algorithms and Safety Improvement Constant Inter-leader Spacing Policy Algorithm,
with Constant Speed Traffic Capacity Management
and Congestion Avoidance Asymmetrical Traffic Demand and Empty Vehicle Management
P h y s i c a l Inter-platooning Manage-ment and Infor-mation Algorithms Intra-platooning Manage-ment and Infor-mation Algorithms Communi-cation Algorithms DSRC/ WAVE and LTE Adv. Dedicated tracks L o c a l C o n t r o l G l o b a l C o n t r o l Hyerarchical Multi-layered ATMS Simulations M a t l a b / S i m u l i n k N S 3 S U M O S U M O
Operational Layers and Contributions
Traffic Manage-ment and Platooning Monito-ring and Control
Fig. 3. ATMS scope, operational layers, and the three simulation tools used.
D) Novel Contributions
The main problem to address consisted of an highly dy-namic scenario of platooning of CAV, where platoons are constantly changing in dimension when passing by off-line stations. Maintaining the system operating at full capacity in face of the exiting of vehicles of a platoon from the main track to an off-line station, and the subsequent entrance of other vehicles joining the same platoon at the same station, is a challenging task.
For that purpose, we considered a constant spacing between platoons’ leaders as a fundamental condition to attain high traffic capacity, and avoid any negative impact on the speed of the platoons behind. However, as explained in detail in section V, a challenging problem had to be solved: when a platoon passes by an off-line station and some of its vehicles exit at that station, how to always ensure enough spacing to allow a number of vehicles to join the platoon in order to complete it with eight vehicles?
This problem is addressed with the proposal of a multi-agent model of a vehicle, consisting of two distinct agents: a leader and a follower. This model was developed in Matlab/Simulink and allowed to implement the repositioning maneuvers of new platoon leaders at each station, to occupy the position that the previous leader would have if it had not exit from the main track, thereby creating enough space behind the remaining platoon to accommodate enough vehicles entering at the same station until the platoon is complete.
To accomplish the exiting maneuvers of vehicles to a station, the repositioning maneuvers of the new leaders, the regrouping of the remaining followers, and the vehicles entering cooper-atively in the main track behind the incomplete platoon, four
major algorithms are proposed in this paper:
I. Interplatoon positioning management algorithm aims to
maintain a constant spacing between platoons’ leaders, using novel repositioning maneuvers to lead each new platoon’s leader to the position occupied by the previous leader;
II. Intraplatoon positioning management algorithm aims to
ensure that all platoons’ followers regroup together, evolving close to their leaders, under a control loop as described in [4];
III. Platoon joining maneuvers management algorithmaims to
allow vehicles to enter the main track cooperatively, whether behind incomplete platoons or occupying vacant leader’s po-sitions;
IV. Extra spacing for secure maneuvering improvement
al-gorithm aims to add extra spacing to improve safety when
vehicles perform exiting maneuvers.
All the proposed algorithms were tested in Matlab/Simulink using an agent-based version of the model presented in [4]. The results attained evince that a significant lane capacity improvement is achievable. These new algorithms were val-idated through simulations performed on the scenario shown in Fig. 23 implemented in the SUMO traffic simulator, con-sisting of a complete track with off-line stations and the new features [10] that we added to SUMO, enabling the use of platooning with constant spaced CAV. A performance comparison between the proposed platooning system and bus and light rail-based transit systems is presented.
II. RELATEDWORK
The concept of Personal Rapid Transit (PRT) has been ana-lyzed in the scientific community for quite a while. Among a large number of researchers that published on the subject, An-derson’s book [11], as well as the book from Irving et al. [12], paved the fundamental concepts of such mode of transporta-tion. More recently, Anderson [13] published updated details about the PRT concept. PRT experimental testing and field ap-plications have been reported [14], [15]. However, the benefits of such system with regard to light rail or conventional cars, are yet to be clearly demonstrated. Simulators more focused on PRT systems have been proposed [16], [17]. However, it is not clear how they model both communications and cooperation. The concept of platooning of automated vehicles and the resultant capacity improvement have been subject of research for almost forty years. In [18], Shladover demonstrated that dynamic entrainment of automated guideway transit (AGV) vehicles as platoons could improve system capacity, and in [19] he described the simulation of a single merge junction and discussed the related capacity and delay performance in the AGT context. In [20], Shladover reviews the history of the founding of the California Partners for Advanced Transit and Highways (PATH) program, and of the national ITS program in the U.S., providing perspective on the changes that have occurred during the past twenty years. In [21], Varaiya and Shladover proposed a hierarchical architecture to accommo-date the demanding functional requirements of the automated highway system (AHS), and in [22] Varaiya addressed key issues related to highly automated intelligent vehicle highway systems (IVHS). Swaroop et al. [2], [23] investigated vari-ous platooning control strategies. Alvarez and Horowitz [24]
researched the conditions to achieve safe platooning under normal mode of operation. In [25], Horowitz and Varaiya discussed in detail the multilayer AHS control architecture implementation, involving the infrastructure and the vehicles. Many other research works on the subject were published, such as [26]–[30].
Rajamani presented in [3] a controller of platoons with constant spacing, concluding that autonomous control is not enough to ensure string stability. He found that only with IVC is the string stability of vehicle platoons achieved. The method was experimentally evaluated in field tests [31].
We consider the use of a constant spacing policy by intrapla-toon vehicles, and by interplaintrapla-toon leaders, as key issues to obtain considerable higher capacity values with platooning of CAV. No relevant simulation studies using these policies under the aforementioned scenario in the literature were found. Most of the published studies consider constant time headway for the spacing policy between consecutive vehicles, and others use moving blocks which is a concept based on a similar principle where the safety gap is proportional to speed. The constant time headway spacing policy presents a major draw-back: the spacing between vehicles increases for higher speed values, lowering vehicle density and consequently limiting the capacity of the system.
Since platooning with a constant spacing policy is very sensitive to communication delays [32], [33], in [4] we pro-posed new algorithms to mitigate communication delays on platoons of IVC-enabled driverless vehicles, using anticipatory information, both from the platoon’s leader and the followers. The results obtained through Matlab/Simulink simulations showed a significant improvement on platoons’ string stability. A full scale automated system managed by an ATMS may raise some concerns with respect to computation lim-its, if using a centralized approach. As such, a distributed and hierarchical ATMS is considered more appropriate and scalable. Hall´e and Chaib-draa [34] proposed a hierarchical driving agent architecture based on three layers (guidance layer, management layer and traffic control layer), to achieve collaborative driving in ITS context, making use of commu-nications to autonomously guide cooperative vehicles on an AHS. Wang [35] proposed a three-level hierarchical architec-ture, applying concepts of agent-based control to networked traffic and transportation systems. In [36], Wang presented an overview of the background, concepts, basic methods, major issues, and current applications of parallel transportation management systems.
In [10] we addressed the implementation of autonomous ve-hicle platooning capabilities in SUMO traffic simulator. More recently, we used the modified SUMO simulator to validate traffic flow assumptions, as described in [4], and we imple-mented new scenarios to assess the feasibility of a complete multi-platooning system of IVC-enabled automated vehicles with off-line stations, performing cooperatively. In [37], we proposed the base rules for interplatoon positioning manage-ment strategies, by maintaining a constant spacing between platoons’ leaders, for safe and efficient ATMS operation, and to ensure high traffic capacity and vehicle density while avoiding traffic congestion. To our best knowledge, there are
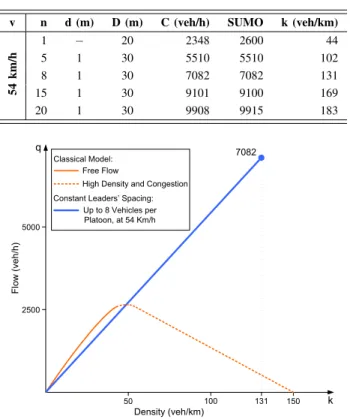
TABLE I
LANECAPACITY USINGPLATOONS
v n d (m) D (m) C (veh/h) SUMO k (veh/km)
54 km/h 1 − 20 2348 2600 44 5 1 30 5510 5510 102 8 1 30 7082 7082 131 15 1 30 9101 9100 169 20 1 30 9908 9915 183 50 100 150 Density (veh/km) 2500 5000 F lo w ( v e h /h ) Classical Model: Up to 8 Vehicles per Platoon, at 54 Km/h 7082
High Density and Congestion Free Flow
Constant Leaders’ Spacing:
131
Fig. 4. Diagram of Traffic Flow for conventional vehicles and platooning of automated vehicles (k-q diagram).
still no traffic simulators with the new presented features in this paper, such as: the simulation of a large number of platoons of constant spaced CAV; vehicles cooperatively exiting to stations and entering the main track from stations; the permanent measuring of the traffic flow, capacity, occupancy and vehicle density; and the avoidance of traffic congestion on a system operating at very high traffic flow and vehicle density values.
III. BREAKINGUP THETRAFFICFLOWLIMITS
In [4] we presented the rationale for the use of platooning of constant spaced vehicles, and have shown how this policy could significantly improve lane capacity. More importantly, the traffic flow limits of conventional traffic with human-driven vehicles were presented through the fundamental diagram, along with values of traffic flow of constant spacing platoon-ing, for platoons with five, eight and fifteen vehicles, evolving at 20 m/s. It was clear that platooning with CAV could envisage a significant improvement of lane capacity. Using the previously proposed information-updating schemes [4], the car-following model added to SUMO [10], and the constant interplatoon leaders’ spacing [37], we performed a set of simulations in SUMO using a more conservative value for the speed, of 15m/s. The results are presented in Fig. 4, and show that platoons at half the speed of conventional human-driven vehicles (when these evolve at the free flow speed) may significantly improve lane capacity, notably at densities of the fundamental diagram corresponding to the hypercritical flow state, i.e., above vehicle densities of approximately 50 veh/km.
0 1000 2000 3000 4000 5000 6000 7000 8000 0 1 2 3 4 5 6 7 8
# Vehicles per Platoon
F lo w ( V e h /h )
Constant Platoons' Spacing Constant Leaders' Spacing
Fig. 5. Traffic flow for two different strategies of driverless vehicles platooning, for a constant speed of 54 km/h.
Using the formulation to determine road capacity presented by Varaiya [22]:
C= v n
ns+ (n − 1)d + D (1)
where C represents the number of vehicles (veh/s), d the intra-platoon spacing (m), D the interintra-platoon spacing (m), s the vehicle length (m), v the steady-state speed (m/s), and n the number of cars in each platoon, Table I presents the values of lane capacity for several platoon dimensions, with v = 54 km/h (15 m/s). This reference speed was chosen as a compromise between two conflicting objectives: ensuring safe operation by the use of a conservative speed value, and maintaining a favorable maximum traffic flow. As shown in Fig. 4, even with a speed limit of 54 km/h a flow value of 7082 veh/h is attainable for platoons of eight vehicles and 30 m apart. A) Rationale For Using Constant Platoon Inter-leaders Spac-ing Instead of Constant Interplatoon SpacSpac-ing
When platoons are incomplete, the data in Fig. 4 concerning the constant spacing between platoons’ leaders policy present lower vehicle densities for the same platoon dimensions–and, consequently, lower flow values–than those we could obtain if the interplatoon spacing was constant, as Fig. 5 clearly shows. For example, for the case of platoons with 5 vehicles each, and considering a constant speed of 54 km/h, with the interplatoon distance of 30 m, the resultant vehicle density should be of 102 veh/km, and the traffic flow of 5510 veh/h. With 5-vehicle platoons, when using a constant interleaders spacing policy, the leaders are 61 m apart (from front bumper to front bumper), and the interplatoon distance is 42 m. Therefore, the vehicle density presents a lower value of 83 veh/km for the same speed, and the traffic flow is of 4426 veh/h.
Notwithstanding the foregoing, there is an important reason to use platoons’ interleaders constant spacing. In fact, if inter-platoon constant distance is instead used, congestion avoidance may not be ensured by the system, albeit being automated. For example, consider a circular track where platoons with 5 vehicles each, with constant interplatoon distance of 30 m,
evolve in formation. Consider also that it is necessary to use full system capacity, with platoons of 8-vehicle each. Subsequently, three more vehicles will be inserted just behind each platoon. When the first 5-vehicle platoon receives the three extra vehicles, the platoons immediately behind it will have to brake, in order to maintain the interplatoon distance of 30 m. Two different scenarios may now be considered, both with the same consequences: (i) the communication delays between platoons are mitigated and are not considered; (ii) the communication between platoons presents some delay. In (i), all platoons would brake simultaneously, including the platoon in front of the platoon receiving the three extra vehicles, in a continuous self-feeding process, leading to an eventual stop of the whole system. In (ii), the braking platoons would create a well-known “shock wave” propagating upstream, in the opposite direction of the platoons movement, with a speed related to the involved communication delays. The number of completed platoons (from 5 to 8 vehicles) depends on the track length. However, as soon as the wave would reach the front of the completed platoon, it would continue to propagate more intensely, leading to an eventual congestion in a matter of time. Either way, it becomes clear that the track cannot cope with these extra vehicles and simultaneously maintain the interplatoon distance of 30 m, since there is not enough space available for all of them.
Instead of constant interplatoon spacing, the proposed con-stant spacing between platoons’ leaders ensures that there is always enough space behind each platoon to accommodate as many vehicles as necessary to complete the platoon, when it is not complete (eight vehicles), without forcing the platoons behind to brake in order to maintain the interplatoon distance of 30 m. As such, the ATMS is able to maintain full system capacity. When traffic demand is low, incomplete platoons will be spaced by more than 30 m, which benefits safety. This means that the interplatoon distance can take one of the following values in steady state: 30 m, 34 m, 38 m, 42 m, 46 m, 50 m, 54 m, or 58 m between consecutive platoons, dependent of the platoons’ dimensions.
A considerable higher density could be attained under the considered scenario, if the interplatoon spacing was occupied by more vehicles, forming an almost continuous platoon. In this case, densities around 245 veh/km could be obtained. However, this assumption is not realistic or viable. Firstly, vehicles must be able to enter the main track, which requires a safety gap. Secondly, vehicles must also be allowed to exit the main track, which may require extra spacing to perform exiting maneuvers. These maneuvers could impose speed variations on the platoons. However, in a system operating at such high traffic density, speed variations must be avoided, since they may induce congestion. The proposed ITS based on a multi-platooning system of automated vehicles with constant spacing between platoons’ leaders has traffic congestion avoidance, high traffic capacity, and safety as top priorities.
A maximum of eight vehicles per platoon was adopted by two reasons: first, from Table I it can be concluded that eight vehicles present a good compromise considering traffic flow improvement and platoons dimension to cope with an highly dynamic scenario; second, the information-updating
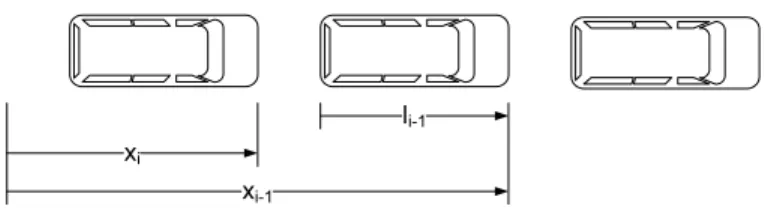
li-1
xi
xi-1
Fig. 6. String of platoon vehicles.
algorithms described in [4] require a communication scheme using time slots with a dimension inversely proportional to the number of vehicles per platoon. Therefore, platoons with a larger number of vehicles could adversely affect the communications performance.
B) Assumptions
In the present stage of our research, some assumptions are made: only longitudinal control of vehicles is assumed; only platoons of automated vehicles are considered; each consid-ered platoon dimension is about 31 m long (eight vehicles 3 m long and 1 m apart); the vehicles’ dynamics are considered identical; the controller performance of the vehicles includes control delays, sensor detection and processing delays, and actuator delays; the controller response uses a first-order vehicle model similar to the one used by Rajamani in [3]; the vehicles use the information management and communication methods to mitigate communication delays described in [4]; when emergency events occur, the platoons behind are alerted through direct interplatoon communications; the information-updating scheme IV proposed in [4] is used, to ensure string stability of platoons; automated vehicles do not share the track with conventional vehicles; vehicles use dedicated tracks consisting on fixed guideways with off-line stations, operating on a nonstop basis from origin to destination, in a way similar to PRT [13]; no lane changes are considered; vehicles are assumed to be lightweight.
The system is managed by a hierarchical multilayered ATMS, which should control: the platoons’ leaders appropriate operation; the admission of vehicles into the system avoiding congestion even when operating at its maximum capacity; and the management of empty vehicles to deal with asymmetrical transportation demand.
IV. BASEMODEL OFVEHICLECONTROL
The use of vehicle platoons with constant spacing is an effective way to improve road capacity, as described in [4]. However, to ensure string stability in a platoon using a constant spacing policy, IVC are required [2], [3].
According to Fig. 6 and considering the desired i th-vehicle position [4] defined by
xi des= xi−1− Li (2)
where
Li= li−1+ gi des (3)
with li−1 being the length of the preceding vehicle and gi des the intervehicle desired gap, the spacing error is defined as:
TABLE II
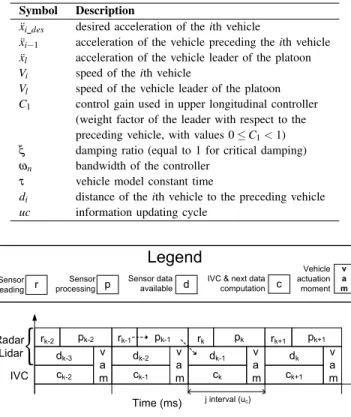
NOMENCLATURE OFMATHEMATICALFORMULATIONS
Symbol Description
¨
xi des desired acceleration of the ith vehicle
¨
xi−1 acceleration of the vehicle preceding the ith vehicle
¨
xl acceleration of the vehicle leader of the platoon
Vi speed of the ith vehicle
Vl speed of the vehicle leader of the platoon
C1 control gain used in upper longitudinal controller
(weight factor of the leader with respect to the preceding vehicle, with values 0 ≤ C1< 1)
ξ damping ratio (equal to 1 for critical damping)
ωn bandwidth of the controller
τ vehicle model constant time
di distance of the ith vehicle to the preceding vehicle
uc information updating cycle
pk-2 ck-2 dk-3 j interval (uc) rk-2 IVC Time (ms) Radar /Lidar v a m pk-1 ck-1 dk-2 v a m rk-1 ck dk-1 v a m rk pk+1 ck+1 dk rk+1 v a m r Sensor reading d v a m Sensor processing p Sensor data available Vehicle actuation moment
Legend
cIVC & next data computation
pk
{
Fig. 7. Time diagram of the range sensor reading and processing de-lays used in the vehicle model (the dashed arrows exemplify a read-ing/processing/availability sequence of the sensor data of a platoon follower).
Using a sliding mode approach, Rajamani [3] designed a controller with vehicles’ desired acceleration expressed as:
¨ xi des = (1 −C1) ¨xi−1+C1x¨l −(2ξ −C1(ξ + p ξ2− 1))ωn˙εi −(ξ +pξ2− 1)ωnC1(Vi−Vl) − ωn2εi (5) We consider a first-order vehicle model [3] given by
¨ xi=
1
τ s + 1x¨i des (6)
Besides control delays, sensor detection and processing delays, actuator delays, and communication delays are also considered in the simulation model. Fig. 7 presents a temporal diagram of the range sensor detection and processing delays for the computation of the data used in each vehicle actuation moment vam (see [4] for further information regarding the communication delays mitigation methods used). In our study we consider, as shown in Fig. 7,
di= dk−1 (7)
and the spacing error εi used in (5) is determined as follows:
εi= gi des− di (8)
The parameters of the formulas are described in Table II.
V. PROBLEMDEFINITION ANDPROPOSEDSOLUTIONS
In Section I, Fig. 2a showing a partial view of ATMS that integrates zone agents responsible for controlling the platoon leaders was presented. One of its purposes is to separate that higher level from the platoon’s management level, depicted in Fig. 2b, where each platoon leader must manage its followers. Fig. 3 represents these different contexts by separated operational layers.
A) Problem Definition
The main problem to deal with is how to maintain full system capacity under a highly dynamic operations of the multi-platooning system. We define a rule stating that all vehicles join the platoon from behind. The main purpose of this rule is to avoid the use of small gaps by vehicles joining a platoon in its middle positions, after the exit of its middle vehicles, since these maneuvers could compromise safety. Following the aforementioned rule, we present two limit sce-narios: Fig. 8a presents the case when the last seven vehicles exit the platoon and no leaders’ repositioning maneuver is performed. In this case up to new seven vehicles may join the platoon safely; Fig. 8b presents the case when the first seven vehicles exit the platoon and no new leaders’ repositioning maneuver is performed. It is clear that, in this case, there is no space behind the eighth vehicle to accommodate all the seven entering vehicles. In fact, if the last of the seven entering vehicles could be accepted in the main track, it would collide with the leader of the platoon following behind. As such, to avoid collision, the subsequent platoons would have to slow down, compromising the “no congestion” principle that the proposed ATMS aims to maintain, as described in [37]. If the adopted rule was to accept vehicles at platoons’ front, the same problem would arise, with the presented arguments in the reverse order.
Fig. 9 shows the station configuration used in the problem definition and proposed solution.
B) Proposed Solutions
When traffic demand is high, complete eight-vehicle pla-toons under the constant spacing policy between plapla-toons’ leaders, present leaders’ spacing of 61 m from each one’s front bumper, and interplatoon spacing of 30 m. Lower traffic demand leads to incomplete platoons (seven vehicles or less). However, leaders’ spacing will be maintained (61 m). So, interplatoon spacing is not constant, but depends on each platoon dimension. Moreover, when traffic demand is low enough to result in the presence of isolated vehicles, they must occupy precise positions, separated by a multiple of the inter-platoon leaders’ defined distance (61 m in the present case), and perform as leaders. This rule may appear too restrictive in respect of the delay that may be imposed upon free vehicle’s entrance in the main track. However, two arguments should be enough to justify it. Firstly, for a speed of 15 m/s (54 km/h), the maximum time overhead imposed to a vehicle entering the track is about 4 s only. Secondly and more important, this rule always ensures a deterministic safety gap between vehicles,
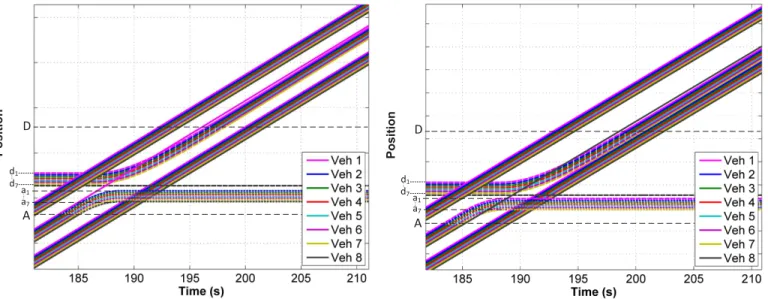
A D d7 d1 a1 a7 ... .. . Pos itio n
(a) Seven tail vehicles exiting and seven vehicles joining a platoon at a station, with the old leader maintaining its position.
A D d7 d1 a1 a7 ... ... P o s itio n
(b) Seven front vehicles exiting and seven vehicles joining a platoon at a station, leading to possible collisions with vehicles of the succeeding platoon following behind.
Fig. 8. Without new leader’s repositioning maneuver, it is not possible to use full capacity at a station. Vehicles evolving in the main track are represented by continuous lines. Dashed lines correspond to vehicles at a station, including the deceleration and acceleration tracks (see Fig. 9).
Deceleration track Acceleration track Off-line station Main track A D a1 a2 a3 a4 a5 a6 a7 a8 d1 d2 d3 d4 d5 d6 d7 d8
Fig. 9. Station configuration used in simulations (parts of the figure are not represented to scale). Position A corresponds to the exiting point in the main track of vehicles arriving at a station. Position D (D = A + 200 m) correspond to the entrance point in the main track of vehicles that departed from the same station. a1 to a8are the positions where vehicles arriving at a station stop. d1 to d8are the positions where vehicles about to depart are stopped at a station.
allowing an appropriate management of new vehicle entrance, whether to evolve alone or to join another vehicle to form a platoon. Moreover, if incomplete platoons are already in place, there is always enough space behind them for vehicles to enter the main track, until a maximum of eight vehicles per platoon. As such, when a leader leaves the main track, the lead vehicle of the remaining vehicles of the platoon must assume leadership. Therefore, the new leader must accelerate to reach the position that previous leader would be occupying. The same reasoning applies to platoons’ middle vehicles. When a vehicle exits from a middle position of the platoon, its followers must close the gap it left as soon as possible. Additionally, vehicles leaving the platoon must perform the exiting maneuvers safely.
In the next section we address this challenges, by proposing four algorithms to ensure appropriate and safe operation of the multi-platooning system.
VI. POSITIONINGMANAGEMENTALGORITHMS
To accomplish the task of vehicles’ repositioning of new platoons’ leaders, each vehicle consists of two modules, a leader agent (LA) and a follower agent (FA), as shown in
... Communications a, v, C1 a, v, C1 a, v, C1 al, vl, ai-1,C1 al, vl, ai-1,C1 xi xi xi Platoon info al, vl, ai-1,C1 a, v, C1 Leader agent Follower agent Vehicle 8 Leader agent Follower agent Vehicle 3 Leader agent Follower agent Vehicle 2 Leader agent Follower agent Vehicle 1
Fig. 10. Information flow diagram of agent-based platoons.
Fig. 10. As such, every vehicle may assume leadership of a platoon or follower behavior, depending on the operational context. Fig. 11 present the state diagram of the agent-based vehicle model, where the LA and the FA role play is shown for each vehicle state: leader or follower.
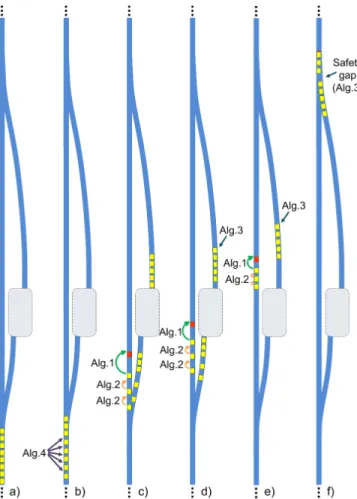
Fig. 12 presents graphically the operation of the four pro-posed positioning management algorithms applied to a platoon within the context of an off-line station. In the next subsections the behavior patterns of the vehicles are further clarified, and
FA FA LA Enter main track Exit main track Exit main track Enter main track in track in track th th
Fig. 11. State diagram for the two states (leader and follower) of the agent-based vehicle model, with leader agent (LA) and follower agent (FA) roles.
TABLE III ALGORITHMPARAMETERS
Parameter Definition
VA vehicle agent
LA vehicle’s leader agent
FA vehicle’s follower agent
vpl previous leader vehicle
vnl new leader vehicle
vl leader vehicle
vi follower vehicle i (1 < i ≤ 8)
vi−1 preceding vehicle of vi (1 < i ≤ 8)
vsi vehicle i to enter the track from a station (1 ≤ i ≤ 8)
Li objective tracking value (see (3))
ε spacing error
th predetermined spacing error threshold
nf number of platoon’s front vehicles that exit
ni number of immediate preceding vehicles of i that exit
the four proposed algorithms are described in detail.
Case I. Interplatoon Positioning Management Algorithm We propose a constant spacing policy between platoons’ leaders, of 61 m from each one’s front bumper, for the ref-erence speed of 15 m/s. Vehicles exiting from a platoon’s tail do not raise concerns. However, when a leader vehicle leaves the platoon, strategies must be implemented to avoid slowing down the platoons behind. The front vehicle of the remaining vehicles of the platoon becomes the new platoon’s leader. If it maintains its current interplatoon positioning while other vehicles join the platoon, constant speed of platoons that follow behind may be compromised. So, the new leader must accelerate within some conditions, to ensure a large enough spacing behind the platoon to be occupied by new vehicles joining the platoon. As such, when a platoon leader leaves the main track, a follower will take its place becoming the new leader of the platoon, and will perform a repositioning maneuver to reach the position occupied by the previous leader, under the procedures presented in Algorithm 1, to ensure a constant spacing between platoons’ leaders. So, high traffic capacity should be attained, whereas traffic congestion may be avoided. Fig. 11 shows detailed information regarding the vehicle state transition, from a follower to a new leader.
Fig. 12. Graphical diagrams illustrating the operation of the four positioning management algorithms applied to a platoon within an off-line station context (parts of the figure are not represented to scale). In a) vehicles in positions 1 (leader), 2, 3, 5, and 7 will exit the main track; in b) extra spacing is created among some of the vehicles under algorithm 4; in c) the position that the new leader (which was in position 4) must attain under algorithm 1 is marked by its LA with a virtual vehicle in red, and the two followers close the gaps under algorithm 2; in d) five vehicles depart from the station to join the incomplete platoon under algorithm 3; in e) the platoon in the main track continues to perform the repositioning maneuver; in f) the five vehicles enter the main track behind the incomplete platoon, whose vehicles are almost grouped together in their new positions, with an extra distance for safety gap, as defined in (9).
Case II. Intraplatoon Positioning Management Algorithm Vehicles exiting the main track to a station may also come from middle positions of a platoon. Such occurrences do not pose any problems to the relative platoon positioning with respect to its neighbors. However, those maneuvers must be timely performed, and the space that exiting vehicles were occupying must be filled in by their followers, if any, under the procedures presented in Algorithm 2.
Case III. Platoon Joining Maneuvers Management Algorithm Inter- and intraplatoon positioning management algorithms described in the two previous subsections, allow the vehicles to enter the main track safely after ATMS clearance, whether behind incomplete platoons or occupying vacant leader’s po-sitions, without slowing down platoons behind. To accomplish such task, vehicles entering the main track must act syn-chronously and cooperatively with the platoon’s vehicles that remained in the track. In the case when all platoon’s vehicles
Algorithm 1 Platoon New Leader’s Positioning Algorithm if vi becomes vnl then
FA of vi controls the vehicle VA of vnl activates LA
LA of vnl serve as the vpl reference positioning
LA of vnlcontinues receiving commands from the ATMS
FA of vnl changes Li from 4 m to 0 m;
//To reach the reference positioning of the virtual vehicle represented by LA
FA’s ε of vnl is increased by ni× 4 m while ε > th do
FA of vnl is in control of the vehicle and follows LA end while
LA of vnl assumes the command of the vehicle and,
consequently, of the platoon end if
Algorithm 2 Platoon Vehicles’ Positioning Algorithm for all vi do
FA of vi controls the vehicle if vi−1 exiting then
FA’s ε of vi is increased by ni× 4 m
FA of vi remains in control and closes the gap to its new vi−1
end if end for
exited the track, the lead vehicle of the entering vehicles will occupy a leader’s position, followed by any vehicles that enter behind, up to a maximum of eight vehicles per platoon. The procedures that describe the actions required to ensure safe and smooth vehicle entrance are presented in Algorithm 3, and the used parameters are described in Table IV.
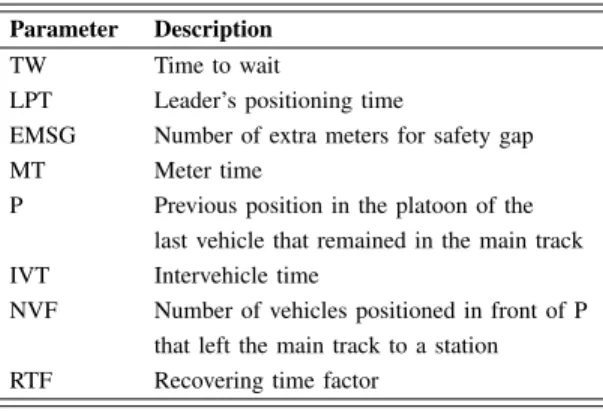
The departure delay is computed as follows:
TW= LPT + EMSG × MT + P × IV T − NV F × RT F (9)
The parameters of (9) are described in Table IV. TW increases with higher previous position in the platoon of the last vehicle that remained in the main track (P), and decreases with higher number of vehicles that exited the track and were previously positioned in front the last vehicle that remained
TABLE IV
JOININGMANEUVERPARAMETERS
Parameter Description
TW Time to wait
LPT Leader’s positioning time
EMSG Number of extra meters for safety gap
MT Meter time
P Previous position in the platoon of the
last vehicle that remained in the main track
IVT Intervehicle time
NVF Number of vehicles positioned in front of P
that left the main track to a station
RTF Recovering time factor
Algorithm 3 Platoon Joining Maneuvers Management Algo-rithm
for all vsi do
vehicle i is stopped at the station end for
if a leader’s position is available in the track then up to 8 vehicles depart at LPT
end if
if a platoon passes in the track then sensors detect how many vehicles exit
the number of vehicles that remain in track is recorded the previous position of the vehicles in track is recorded the information is confirmed through IVC
end if
the departure delay TW of vehicles vsi is determined by (9)
vs1 and vehicle in position P establish communications
vs1 is follower of vehicle in position P
vs1enters the track at 1 + EMSG m to vehicle in position P vs1 closes the gap to the vehicle in position P
Algorithm 4 Extra Spacing for Secure Maneuvering Improve-ment Algorithm
for all vi do
FA of vi controls the vehicle if vi exiting xor vi−1 exiting then
FA of vi brakes creating extra spacing to vi−1 end if
end for
in the track (NFV). The values of the parameters presented in Table IV are dependent of: the physical characteristics of each station; the considered speed; and the platoon dimension. So, in Section VII (Results) they will be defined for the considered scenario (see Table VI on page 10).
Case IV. Extra Spacing for Secure Maneuvering Improvement Algorithm
For the sake of safety improvement, a further algorithm is proposed to increase the distance between some of the pla-toon’s vehicles, just before exiting maneuvers are performed. As such, the spacing between exiting vehicles and vehicles that remain on the main track is increased to 1 + EMSG m, under the procedures presented in Algorithm 4. Fig. 13 shows detailed information regarding the aforementioned algorithm.
Start End viexiting vi-1exiting Extra Spacing N Y
Fig. 13. Flow diagram for defining an extra spacing between vehicles exiting to a station and vehicles remaining in the main track.
170 175 180 185 190 195 200 205 210 -0.2 0 0.2 0.4 0.6 0.8 1 Time (s) A c c e le ra ti o n ( m /s 2) Veh 1 Veh 2 Veh 3 Veh 4 Veh 5 Veh 6 Veh 7 Veh 8 (a) Acceleration 170 175 180 185 190 195 200 205 210 14.5 15 15.5 16 16.5 17 17.5 Time (s) S p e e d ( m /s ) Veh 1 Veh 2 Veh 3 Veh 4 Veh 5 Veh 6 Veh 7 Veh 8 (b) Speed 170 175 180 185 190 195 200 205 210 -5 0 5 10 15 20 25 30 Time (s) S p a c in g e rr o r (m ) Veh 1 Veh 2 Veh 3 Veh 4 Veh 5 Veh 6 Veh 7 Veh 8 (c) Spacing error Fig. 14. Tracking of leader’s positioning without disturbance.
TABLE V
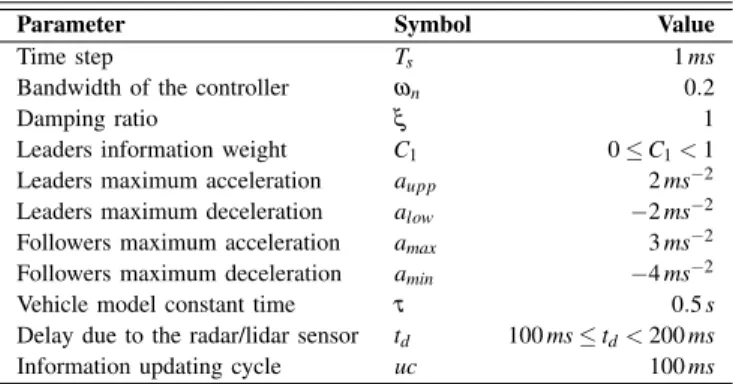
PARAMETERS OF THESIMULATIONMODEL
Parameter Symbol Value
Time step Ts 1 ms
Bandwidth of the controller ωn 0.2
Damping ratio ξ 1
Leaders information weight C1 0 ≤ C1< 1
Leaders maximum acceleration aupp 2 ms−2
Leaders maximum deceleration alow −2 ms−2
Followers maximum acceleration amax 3 ms−2
Followers maximum deceleration amin −4 ms−2
Vehicle model constant time τ 0.5 s
Delay due to the radar/lidar sensor td 100 ms ≤ td< 200 ms
Information updating cycle uc 100 ms
VII. RESULTS
To assess the appropriate operation of the proposed al-gorithms, several simulations were carried out in Mat-lab/Simulink. All models include up to eight-vehicle platoons. Each vehicle is simulated by an agent-based model consisting of two modules: a leader and a follower, as shown in Fig. 10 and Fig. 11. The communication and information-updating systems reported in [4] are used, with an information updating
cycle uc = 100 ms. In the Matlab/Simulink simulations, a
vehicle model constant time of τ = 0.5 s is assumed in the controller, similarly to the value used by Rajamani in [3]. An additional time delay tdbetween 100 ms and 200 ms due to the radar/lidar sensor for acquire and process data is also assumed. The parameters used in the Matlab/Simulink simulations are defined in Table V. Fig. 9 depicts the station configuration used in the simulations.
Case I. Interplatoon Positioning Management Algorithm Fig. 14 presents aggregate results from the repositioning mechanism of the seven possible cases, using Algorithm 1. Fig. 14a presents the acceleration increase, needed for the FA of the new leader to reach the position the old leader would have, if it had not exited the track. That position is being referenced by the LA. So, an acceleration must occur, for the vehicle to increase its speed, and a deceleration must follow, when the vehicle is reaching the new position. The maximum acceleration depends on the previous position that the new
leader had in the platoon, since the incomplete platoon must timely perform the repositioning maneuver between the exit point and the entrance point of a station (see Fig. 9) to allow other vehicles to join that platoon up to a maximum of eight vehicles. So, we can observe in Fig. 14a that the maximum acceleration applied to the new leader is approximately of 0.124 m/s2 if only the previous leader vehicle exits the main track. If two front vehicles exit, the third one, becoming the new leader, is accelerated to a maximum of approximately 0.252 m/s2. In the case of the fourth vehicle becoming the new
leader, the maximum applied acceleration is of 0.377 m/s2.
And so forth (0.5; 0.625; 0.748), until the eight vehicle’s case (0.96 m/s2). As such, the acceleration increases with higher previous position occupied by the new leader of the platoon. Consequently, speed increase is higher for the cases when vehicles in the tail of the platoon assume leadership (Fig. 14b). The spacing error (Fig. 14c) increases by n × 4, where n is the number of platoon’s front vehicles that left the main track. After 30 s, the spacing error is below 1 m, independently of the case (1 to 7 front vehicles exiting). This means that the time needed to reach a low tracking error does not significantly depend of the new leader’s previous position.
To assess the robustness the controller under Algorithm 1, a disturbance was applied on the acceleration in the form of a sudden deceleration followed by an acceleration (see dotted line in Fig. 15a), while the repositioning maneuver was taking place. The LA of the new leader, serving as a reference for its FA which was in control of the vehicle, applied the acceleration pattern in spite of not being yet the active controller of the platoon’s leader. Meanwhile, the FA continued trying to reach the virtual position of the previous leader, given by the LA, adapting its acceleration pattern accordingly. Even considering the applied disturbance, the resultant acceleration (Fig. 15a) and speed (Fig. 15b) are such that the spacing error profile is not affected (Fig. 15c).
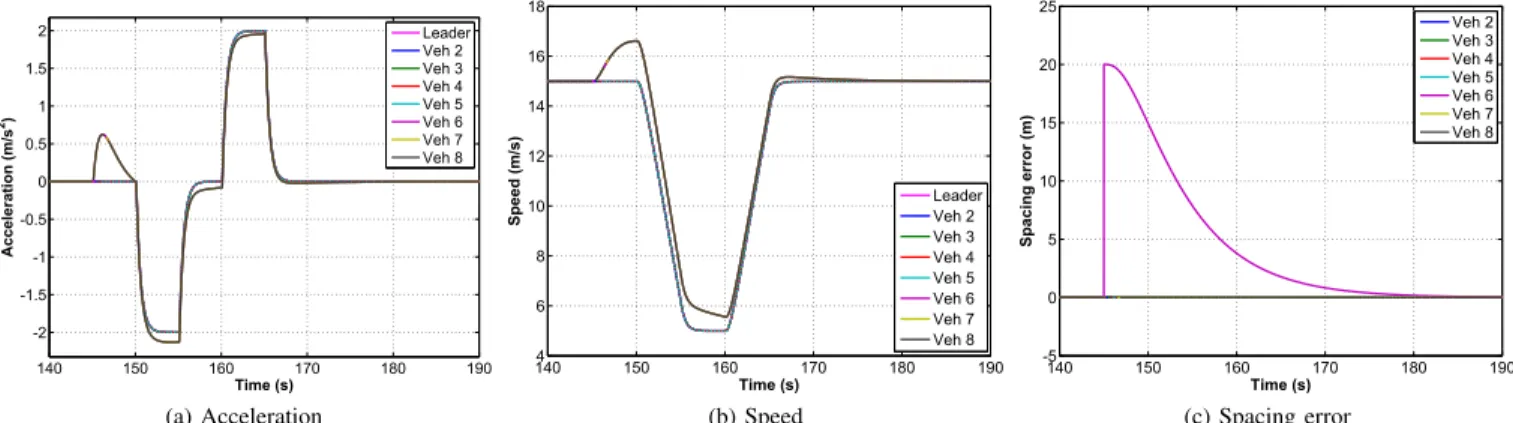
Fig. 16 depicts the platoon’s behavior when five leading vehicles exit the main track. It is shown that the sixth vehicle, becoming the leader at 145 s, accelerates to reach the position of the previous leader, while being followed by vehicles close behind. The virtual trajectories of the vehicles that left the main track are depicted in Fig. 16a, to show that the remaining vehicles perform repositioning maneuvers as expected, even
140 150 160 170 180 190 -2 -1.5 -1 -0.5 0 0.5 1 1.5 2 Time (s) A c c e le ra ti o n ( m /s 2) Leader Veh 2 Veh 3 Veh 4 Veh 5 Veh 6 Veh 7 Veh 8 (a) Acceleration 1404 150 160 170 180 190 6 8 10 12 14 16 18 Time (s) S p e e d ( m /s ) Leader Veh 2 Veh 3 Veh 4 Veh 5 Veh 6 Veh 7 Veh 8 (b) Speed 140 150 160 170 180 190 -5 0 5 10 15 20 25 Time (s) S p a c in g e rr o r (m ) Veh 2 Veh 3 Veh 4 Veh 5 Veh 6 Veh 7 Veh 8 (c) Spacing error Fig. 15. Tracking of leader’s positioning with a disturbance applied to the acceleration.
145 150 155 160 165 170 2100 2150 2200 2250 2300 2350 2400 Time (s) D is ta n c e ( m ) Leader Veh 2 Veh 3 Veh 4 Veh 5 Veh 6 Veh 7 Veh 8
(a) The virtual paths that exiting vehicles would perform are presented with dashed lines.
145 150 155 160 165 170 2100 2150 2200 2250 2300 2350 2400 Time (s) D is ta n c e ( m ) Leader Veh 2 Veh 3 Veh 4 Veh 5 Veh 6 Veh 7 Veh 8
(b) The braking maneuvers, performed off-line, are represented, with a full stop of exiting vehicles to a station.
Fig. 16. New leader reaching previous leader position.
with the application of the aforementioned disturbance on the acceleration. Fig. 16b depicts what really happens, since the vehicles that left the main track brake on a deceleration track, and will come to a full stop when reaching an off-line station. It is important to acknowledge that when more than one vehicle exit the main track, the leader and the remaining vehicles of the exiting convoy only brake after the
175 180 185 190 195 2450 2500 2550 2600 2650 2700 2750 Time (s) D is ta n c e ( m ) Leader Veh 2 Veh 3 Veh 4 Veh 5 Veh 6 Veh 7 Veh 8
Fig. 17. Followers in second, third, fifth, sixth, and seventh position exit the main track to a station. Vehicles in fourth and eighth position accelerate to close the gaps.
last vehicle’s exit maneuver is completed. As such, their speed decrease in the deceleration track does not affect the speed of the followers that continued to evolve in the main track.
Case II. Intraplatoon Positioning Management Algorithm When a follower is about to exit the platoon at the next station, it announces its intention to its followers. Some of them, in turn, may also intend to exit at the same station. As such, several scenarios are possible:
1) an isolated vehicle exits the track;
2) several vehicles exit, but their immediate platoon neigh-bors remain in the track;
3) several vehicles exit, in one or more convoys of two or more vehicles each.
An example of the third case is shown in Fig. 17, when two convoys leave the platoon: the first one consists of vehicles in second and third position; the second one, of vehicles in fifth, sixth, and seventh position. Vehicles in fourth and eighth position accelerate to close the left gaps, under the procedures of Algorithm 2.
175 180 185 190 195 2450 2500 2550 2600 2650 2700 2750 Time (s) D is ta n c e ( m ) Leader Veh 2 Veh 3 Veh 4 Veh 5 Veh 6 Veh 7 Veh 8
Fig. 18. Leader and the vehicle in second position exit, along with followers in fourth, sixth, and seventh position. Vehicle in third position, becoming the leader, performs the repositioning maneuver, while vehicles in fifth, and eighth position accelerate to close the left gaps.
TABLE VI
PARAMETERVALUESUSED FORTW COMPUTATION
Parameter Value TW= LPT + EMSG × MT + P × IV T − NV F × RT F LPT 0.9667 s EMSG 2 MT 0.0667 s P Variable (1 ≤ P ≤ 8) IVT 0.2667 s NVF Variable (0 ≤ NV F ≤ P − 1) RTF 0.1233 s
Cases I and II. Inter- and Intraplatoon Positioning Manage-ment Algorithms
Fig. 18 presents the distance profile of the platoon for the case when the first two vehicles exit the main track at the same time an isolated follower in fourth position along with a convoy of two vehicles in sixth and seventh position also exit. The vehicle in third position, becoming the new platoon leader, accelerates to occupy the position of the previous leader (under the procedures of Algorithm 1), whereas vehicles in fifth and eighth position accelerate to close the left gaps (under the procedures of Algorithm 2).
Case III. Platoon Joining Maneuvers Management Algorithm The maneuvers of vehicles departing from a station to join incomplete platoons evolving on the main track are performed cooperatively, according to the Algorithm 3. The simulation scenario includes a station with a configuration as depicted in Fig. 9, where the distance between the exit point from the main track and the entrance point to the main track is of 200 m. So, the vehicles performing the repositioning maneuvers (abiding to Algorithm 1) recover about two thirds of the gap to reach their new positions, from the exit point until the entrance point. Under this scenario, the values of the parameters of Table IV are presented in Table VI.
Fig. 19 represents the case when seven vehicles of the platoon’s front exit the main track to a station, whereas
185 190 195 200 205 210 2600 2650 2700 2750 2800 2850 2900 2950 3000 3050 3100 Time (s) D is ta n c e ( m ) Veh 1 Veh 2 Veh 3 Veh 4 Veh 5 Veh 6 Veh 7 Veh 8
Fig. 19. Seven vehicles exiting and seven vehicles joining a platoon at a station, with the new leader performing the repositioning maneuver.
185 190 195 200 205 210 215 220 0 2 4 6 8 10 12 14 16 18 Time (s) S p e e d ( m /s ) Veh 1 Veh 2 Veh 3 Veh 4 Veh 5 Veh 6 Veh 7 Veh 8
Fig. 20. Speed patterns of the seven exiting vehicles, and the new seven vehicles joining the platoon, while the eighth vehicle, becoming the new leader, performs the repositioning maneuver.
seven vehicles enter the track from the same station. The repositioning maneuver performed by the eighth vehicle that remained in the track, under the procedures of Algorithm 1, allows all seven entering vehicles to join the platoon safely, under the procedures of Algorithm 3, solving the problem presented in Fig. 8 of Section V. These algorithms ensure plenty of space available to safely perform the joining ma-neuver, without slowing down the platoons following behind. The joining maneuvers are performed cooperatively with the vehicles in the main track, using sensors and IVC. Fig. 20 shows the speed patterns of the exiting and joining maneuvers presented in Fig. 19. The eighth vehicle of the first platoon, becoming the new leader, temporarily increases its speed to perform the repositioning maneuver, while the other seven vehicles brake simultaneously in the deceleration track, until reaching a full stop. The seven vehicles of the entering platoon
185 190 195 200 205 210 2600 2650 2700 2750 2800 2850 2900 2950 3000 3050 3100 Time (s) D is ta n c e ( m ) Veh 1 Veh 2 Veh 3 Veh 4 Veh 5 Veh 6 Veh 7 Veh 8
Fig. 21. Six vehicles exit in pairs, and six vehicles join the platoon at a station, after the remaining vehicles have performed the repositioning maneuvers.
initiate their departure maneuver in the acceleration track a short period of time after the last vehicle from the exiting platoon has passed through the exit point (TW parameter’s value, computed accordingly to (9) and Table VI). The entering platoon reaches the entrance point of the main track at a speed similar to the speed of the vehicle it will join.
Fig. 21 shows another simulated scenario, where vehicles in third and sixth position perform the repositioning maneuvers after three pairs of vehicles have exited (in first, second, fourth, fifth, seventh, and eighth position). Subsequently, six vehicles join the incomplete platoon.
Several other scenarios were simulated, having all of them performed as expected.
Case IV. Extra Spacing for Secure Maneuvering Improvement Algorithm
The exiting maneuvers are performed with platoons’ vehi-cles at a distance determined by Algorithm 4, in which the spacing between exiting vehicles and vehicles that remain on the main track is increased, improving safety. Onboard track switching mechanisms may enable such track exiting maneuvers seamlessly, at the reference speed used in the simulations. Simulation studies adding the extra spacing under the procedures of Algorithm 4 were conducted, with the involved vehicles braking a few seconds before those exiting maneuvers were performed. Several timings were assessed and the value of 10 s was retained as the reference value for the beginning of the braking maneuvers, since it was considered a good compromise between timely maneuver execution and passengers’ comfort. A value of 5 s was also simulated, but the results showed that the deceleration would be approximately up to three times higher.
Concerning the braking maneuvers related to Algorithm 4, two approaches were taken:
1) Synchronous Braking Maneuvers: All vehicles involved
in braking maneuvers brake at the same time. In this approach,
TABLE VII
SUMO TRANSPORTATIONPARAMETERS
Transport Length Max. Capacity
System (m) (persons/veh)
Platoon vehicle 3 4
Bus 15 67
Light rail 68 712
the last vehicles in a platoon accumulate the deceleration of all braking vehicles when those maneuvers take place. As such, the deceleration of each platoon’s vehicle is equal or higher than each one’s preceding vehicle.
2) Asynchronous Braking Maneuvers: This approach
dis-tributes the accumulation of the deceleration values along a short period of time. The simulation results showed that this scheme could present a slight decrease of last vehicles’ deceleration, thus increasing passengers’ comfort.
Fig. 22 shows the platoon’s profiles of the acceleration, speed, and spacing error, when the braking maneuvers are performed asynchronously, before vehicles in first, second, fourth, fifth, and eighth position exit the main track.
VIII. SIMULATION OF ACOMPLETEPLATOONINGSYSTEM
To assess if the data of parameter C (capacity) of Table I were realistic, a new complete simulation scenario setup was implemented in SUMO traffic simulator, using the new features added as described in [10], and further modifications to provide cooperative behavior of evolving vehicles. The communications and information exchange among vehicles use the algorithms reported in [4]. This simulation setup allowed to confirm the data values of SUMO presented in Table I, as well as the analysis presented in Section III. Furthermore, with the simulation setup depicted in Fig. 23, it was possible to perform throughout simulations under very high demand, stressing the traffic system to its full capacity.
A. Scenario Definition and Traffic Demand
To evaluate the impact of the constant spacing CAV pla-toons’ model on traffic flow improvement, the platooning system was implemented in SUMO traffic simulator, with the following scenario definition:
• the SUMO parameters are presented in Table VII;
• the scenario consists of a dedicated track 3965 m long
with ten off-line stations, as shown in Fig. 23;
• the simulation of buses used the configuration of previous item, with a track consisting of a conventional lane; • the light rail simulation also used the same configuration,
with the stations defined over the main track;
• the maximum number of vehicles of each platoon is eight;
• the track can accommodate as much as 65 platoons for a
total of 520 vehicles, if all platoons are complete; • constant intraplatoon vehicles’ spacing of 1 m is used; • constant interplatoon leaders’ spacing of 61 m is used;
• at a constant speed of 15.25 m/s, a platoon leader passes
by some determined point every 4 seconds; • followers abide by the control law (5);
185 190 195 200 205 210 215 220 225 -0.4 -0.2 0 0.2 0.4 0.6 0.8 Time (s) A c c e le ra ti o n ( m /s 2) Leader Veh 2 Veh 3 Veh 4 Veh 5 Veh 6 Veh 7 Veh 8 (a) Acceleration 185 190 195 200 205 210 215 220 225 13.5 14 14.5 15 15.5 16 16.5 17 17.5 Time (s) S p e e d ( m /s ) Leader Veh 2 Veh 3 Veh 4 Veh 5 Veh 6 Veh 7 Veh 8 (b) Speed 185 190 195 200 205 210 215 220 225 -4 -2 0 2 4 6 8 10 12 Time (s) S p a c in g e rr o r (m ) Veh 2 Veh 3 Veh 4 Veh 5 Veh 6 Veh 7 Veh 8 (c) Spacing error Fig. 22. Braking maneuvers performed asynchronously, before vehicles in first, second, fourth, fifth, and eighth position exit the main track.
A
B
Fig. 23. SUMO complete scenario setup of platoons of driverless vehicles with off-line stations. In the zoomed view we can observe occupied vehicles evolving on the main track (in yellow) as well as free vehicles (in green) going to stations with more demand.
• the passengers’ demand is higher than the capacity of the
system;
• the passengers’ demand is mainly distributed
asymmetri-cally from station A to station B (see Fig. 23), although the remaining stations are also used by passengers to enter or leave the transportation system;
• the main stations can accommodate at least 150 vehicles;
• several departure rates of bus and light rail are performed and the results are compared with those obtained with platoons of up to eight automated vehicles each;
• the transportation system of CAV platooning uses a
one-minute stop at each station;
• the bus and light rail transportation systems use a twenty-second stop at each station;
• the reallocation of empty vehicles to stations where they
are most needed is performed.
A speed value of 15.25 m/s was used in SUMO, instead of the 15 m/s used in Matlab/Simulink simulations. This choice was made to solve computation accuracy issues of SUMO.
The entrance maneuvers of vehicles from stations to the main track are performed cooperatively in SUMO, using E1-type loop detectors deployed along predetermined points in the track (yellow rectangles in Fig. 23). Vehicles about
to enter receive information from those sensors related with platoon dimension (how many vehicles may enter behind it) and its positioning (when to begin to accelerate in the acceleration track, in order to reach the main track just behind that platoon, at a speed almost equal to the platoon’s one). The final stations’ shape will be similar to the scheme presented in Fig. 9 of Section VII (the off-line part, where vehicles stop for passengers to exit and enter, is not drawn to scale).
The simulations were performed separately. To ensure that the CAV would not be in advantage, it was decided that each platoon’s vehicle would transport only one passenger each, whereas bus and light rail systems were used at their full capacity. Moreover, the stop time at each station was defined as 20 s for the bus and light rail systems, whereas a stop time of 60 s was used for the case of platoons. As such, the bus and light rail systems are in advantage with respect to the capacity measured on passengers transported per hour.
B. SUMO Simulation Results
Table VIII presents the attained results, through simulations, for the three modes of transportation, in what concerns persons per hour and travel time. These results were obtained under the assumption that passengers’ demand is high enough to
TABLE VIII
COMPARISON OF THENUMBER OFTRANSPORTEDPERSONS PERHOUR
(P/H)AND THETRAVELTIME,FORTHREETYPES OFTRANSPORTATION.
Transport Frequency Maximum Travel time
capacity (from A to B) Platoons 4 s 7 200 p/h 158 s Bus 3 min 1 340 p/h 305 s 2 min 2 010 p/h 1 min 4 020 p/h
Light rail 10 min 4 272 p/h 413 s
6 min 7 120 p/h
maintain the transit systems operating at their maximum capacity. The results suggest that the CAV platooning performs better in both capacity and travel time metrics. Even at its minimum vehicle occupancy, of one passenger per vehicle, the capacity would be of 7 200 passengers per hour. Moreover, if we were to consider a more realistic scenario of an average of 1.5 passengers per vehicle for the platooning case, a value of 10 800 passengers per hour would be possible to attain. Furthermore, the platooning system could transport 28 800 passengers per hour at its maximum capacity. The results of both bus and light rail systems already consider their full capacity. One parameter that could be used to improve their capacity could be the departure rate of vehicles, by lowering the used time intervals. However, we already considered lower values than those found in the real world. As such, lowering those values even further could lead to unrealistic results and insecure modes of operation of such transportation systems. Additionally, the passengers’ waiting time, which is not considered in the present simulations, would lead to higher complete journey times than the travel times presented in Table VIII. In fact, since the capacity of the bus and light rail transit systems is lower than that of the platooning system, which in turn is also lower than maximum passenger demand used in the simulation, greater queues of persons waiting for the next bus or train would form at the stations. Therefore, the advantage of the platooning system would be expected to be higher, in the case of complete journey times comparison.
Another value that is worth mentioning is the number of vehicles needed to maintain the platooning simulation at its maximum capacity: about 750 vehicles, considering a one-minute stop at origin or destination stations. This value was obtained performing the aforementioned empty vehicle management, by reallocating empty vehicles to stations where they were most needed (presented in green color in Fig. 23). In Section III, we have seen that higher traffic capacity was theoretically achievable with the use of platooning. The presented simulations allowed to confirm that a significant traffic flow improvement is possible, as shown in Fig. 24.
IX. CONCLUSION
In this paper we present novel algorithms to maintain a constant spacing between platoons’ leaders using repositioning strategies, as well as to allow joining maneuvers of vehicles departing from stations to join incomplete platoons coop-eratively, and to increase intervehicle spacing to undertake
0 50 100 150 0 20 40 60 80 100 120 0 1000 2000 3000 4000 5000 6000 7000 8000 Density (veh/km) Velocity (km/h) Flow (veh/h)
Fig. 24. 3D diagram of Traffic Flow for conventional vehicles and platooning of automated vehicles (k-q-u diagram).
exiting maneuvers safely. The aforementioned algorithms were tested through a new agent-based model for platoons of CAV implemented in Matlab/Simulink, which incorporates the model presented in [4] featuring new algorithms to mitigate the effects of communication delays over platoons’ string stability. The four proposed algorithms work together aiming to ensure the efficient operation of a hierarchical multilayered ATMS when managing a platoon-based traffic system. The novel platoon leaders’ repositioning strategies proved to be effective on ensuring high traffic capacity and congestion avoidance. The joining maneuvers’ algorithm ensured that vehicles enter the main track cooperatively and safely. The exiting maneuvers’ algorithm improved safety.
To assess the usefulness of the proposed algorithms and to validate them, a novel simulation engine for platoons of CAV was implemented in the SUMO traffic simulator, using a modified version of SUMO to operate with a new car following model that we had previously developed [10]. Therefore, this simulator presents novel key features enabling the study of constant spacing platooning systems. Further modifications were conducted on SUMO, to provide cooperative behavior of evolving vehicles, and a new simulation scenario defined. The simulation results of the platooning system using the proposed algorithms proved that high traffic capacity values are achieved, and congestion is avoided. A comparison of the simulation results of the platooning system with those of bus and light rail systems showed an advantage of the proposed system toward these conventional transit systems. Thus, a platoon-based system using the rules proposed in this paper may be a viable alternative to mass transit systems in urban areas. The results also seem to suggest that it is possible to envisage the practical implementation of a similar system in the midterm.
Future work will address the study of highway scenarios with the application of the presented algorithms to ramp me-tering and its comparative analysis with conventional systems, as well as the improvement of communication reliability using