http://dx.doi.org/10.1590/0104-530X1442-14
Resumo: Este artigo aborda um estudo de caso em uma indústria de bebidas relativo ao Problema de Roteamento de Veículos Assimétrico com Frota Heterogênea Limitada (PRVAFHL). O objetivo é deinir as rotas dos veículos de modo a reduzir os custos de distribuição. O PRVAFHL pertence à classe NP-difícil, isto é, sua resolução por meio de métodos exatos é uma tarefa extremamente árdua. Problemas desta natureza são geralmente tratados na prática de forma heurística. Dentre as diversas abordagens existentes, optou-se por realizar uma adaptação de uma heurística da literatura que se mostrou eiciente, sendo capaz de gerar soluções de qualidade elevada em um tempo de execução aceitável. Experimentos computacionais foram realizados em um conjunto de 7 instâncias obtidas junto à empresa em questão. Os resultados obtidos mostram que houve uma redução considerável no número de veículos utilizados e na distância total percorrida em relação às soluções adotadas pela empresa.
Palavras-chave: Otimização; Indústria de bebidas; Iterated Local Search; Logística.
Abstract: This article deals with a case study in a beverage industry concerning the Asymmetric Vehicle Routing Problem with Heterogeneous Limited Fleet (AVRPHLF). The objective of the present paper is to deine the vehicle routes so as to reduce distribution costs. The AVRPHLF belongs to the NP-hard class, that is, its resolution through exact methods is an extremely hard task. In practice, problems of this nature are generally treated via heuristics. Among the various solution approaches, we decided to perform an adaptation of a heuristic from the literature that has proved to be eficient, capable of generating high-quality solutions in a reasonable execution time. Computational experiments were conducted in a set of seven instances obtained from the company in question. The results obtained show that there was a considerable reduction in the number of vehicles used and in the total distance traveled with respect to the solutions adopted by the company.
Keywords: Optimization; Beverage industry; Iterated Local Search; Logistics.
Asymmetric vehicle routing problem with
heterogeneous limited fleet: a case study in a
beverage industry
Problema de roteamento de veículos assimétrico com frota
heterogênea limitada: um estudo de caso em uma indústria de bebidas
Raphael Harry Frederico Ribeiro Kramer1 Anand Subramanian1
Puca Huachi Vaz Penna2
1 Departamento de Engenharia de Produção, Centro de Tecnologia, Universidade Federal da Paraíba – UFPB, Campus I, Bloco G,
Cidade Universitária, CEP 58051-970, João Pessoa, PB, Brasil, e-mail: [email protected]; [email protected]
2 Instituto do Noroeste Fluminense de Educação Superior, Universidade Federal Fluminense – UFF, Rua João Jazbik, s/n,
CEP 28470-000, Santo Antônio de Pádua, RJ, Brasil, e-mail: [email protected] Received May 05, 2014 – Accepted Nov. 20, 2014
Financial support: Conselho Nacional de Desenvolvimento Cientíico e Tecnológico – CNPq (Process 471158/2012-7).
1 Introduction
The Vehicle Routing Problem (VRP) is one of the most well-known and studied logistic distribution
problems in the ield of combinatorial optimization
due to its applicability and importance, especially in the supply chain. In view of its high complexity, solving the VRP is regarded as NP-hard, that is, the
dificulty in inding the optimal solution increases
exponentially as the number of customers also increases.
In its classic form, the VRP can be deined as follows.
Let G = (V,E) be a graph where V = {v0,v1, ...,vn} is the set of vertices and E = {(vi, vj):vi, vj∈V i<j} is
the set of edges. The vertex v0 denotes the depot
where a leet of m identical vehicles with capacity Q
each customer’s demand is met. Each vehicle must
start and inish the route at the depot v0 and the sum of the demands of each route must not exceed the
vehicle capacity. Such problem is known as Capacited
Vehicle Routing Problem. A graphical representation of a VRP solution containing 3 routes is depicted in Figure 1.
When the travel cost from customer i to the customer
j is different from the cost in the opposite direction, we have the Asymmetric VRP (AVRP) which, in
contrast with the VRP, is deined over a directed
graph G = (V, A), where A = {(vi, vj):vi, vj ∈V, i ≠ j} is the set of arcs of G.
For the case in which there is a set of K types of vehicles with different Qk capacities, we have the Heterogeneous Fleet VRP (HFVRP). In this variant,
two situations can occur: when the number of vehicles of each type is known, the leet is limited; otherwise, it is unlimited. Furthermore, ixed and/or variable
costs associated with each type of vehicle may or may not be considered.
By combining the asymmetric case with a limited
leet of vehicles that have distinct capacities, we
have the Asymmetric Heterogeneous Limited Fleet Vehicle Routing Problem (AHLFVRP).
This work extends the one of Kramer et al.
(2012), which refers to a case study concerning the
AHLFVRP in a beverage industry considered to be the largest bottler of mineral water in Brazil, with various manufacturing units distributed throughout the territory. The objective of the present paper is to
deine the distribution routes and compare the results
obtained with those usually adopted by the company. As in many combinatorial optimization problems, such as packing, production scheduling, location,
work scheduling, etc, VRPs are usually solved using heuristic methods, especially when applied to real-life and large-scale cases. A heuristic can
be deined as a set of methods and rules, inspired
by intuitive processes that lead to the resolution of problems. In contrast to exact methods, which
ind the best possible solution at the expense of a
high resolution time, heuristic methods do not have this guarantee, but they are capable of generating near-optimal solutions in a relatively short amount of time. A detailed explanation of heuristics and
metaheuristics can be found in Souza (2007), Blum & Roli (2003) and Gendreau & Potvin (2010).
With a view of solving the proposed problem, we decided to use the ILS-RVND heuristic (Penna et al.,
2013), due to its lexibility, simplicity, robustness
and its good computational performance. During data collection, we made use of the Application
Programming Interface (API) of Google Maps to acquire the distance and time matrices between
customers.
The remainder of the paper is organized as follows. Initially, Section 2 presents a brief description of some related works. Section 3 characterizes the company studied as well as the particularities of the
distribution process. Section 4 describes the algorithm developed for the acquisition of the distance and time matrices. Section 5 presents the ILS-RVND
algorithm along with the procedures for generating an initial solution and for performing local search and perturbation. Section 6 contains the results obtained and a comparison with those adopted by the company.
Finally, Section 7 concludes the work.
2 Related works
The VRP was introduced by Dantzig & Ramser
(1959) in the late 1950s in order to solve a gasoline
distribution problem. In this work, the authors
presented the irst mathematical formulation and
algorithmic approach for the problem. Since then, the number of studies and works related to the topic
grew signiicantly. Some authors, such as Toth & Vigo (2002) and Golden et al. (2008), list a reasonable
number of VRP applications in various branches of activity.
Given the high complexity in solving the problem
and depending on the instance characteristics as well
as on the dificulty in generating feasible solutions, the use of computational techniques may contribute
to a reduction in the transportation costs in the order
of 5-20%, as mentioned by Toth & Vigo (2002).
Many of the real-life applications of the VRPs in food industry, solid waste, beverage, dairy and
journal distributions can be found in Golden et al. (2002). The authors demonstrate that when operations research techniques are used in distribution logistics,
they can contribute to reducing costs and increasing productivity.
Gonçalves et al. (2005) studied the mineral water
distribution problem in the city of Itu. To solve it, the
authors deined customers’ clusters after determining
medians and then performed the routing process using
the savings heuristics of Clarke & Wright (1964)
together with the nearest insertion approach and the Tabu Search metaheuristic.
The practical importance of HFVRP can be
veriied by the large variety of studies found in the literature. Tarantilis & Kiranoudis (2001), Prins (2002) and Tarantilis & Kiranoudis (2007) presented limited leet applications in dairy, furniture, food
and construction industries. Belfiore & Yoshizaki
(2009) described an unlimited leet application in
a Brazilian retailer, in which each store had time windows and certain vehicle sizes constraints, and they could be served by more than one vehicle.
Campos et al. (2006) solved a HFVRP with time
windows constraints of one of Brazil’s largest retailers by means of genetic algorithms and parallel computing. The approach employed has proved capable of reducing the costs of the solutions adopted
by the company by about 13%.
Marmion et al. (2010) proposed the first
asymmetric version of HFVRP by developing four algorithms whose main objective was to compare
the performance of two classic operators: swap
and reinsertion.
In addition to the methodology used to solve the routing problem, the way in which the information
is collected is a crucial factor to ensure the quality of the solutions. Given that the metric used to
assess the VRP solutions are mostly based on the total distance traveled by the vehicles, the precise
deinition of the location and distance between customers is an essential prerequisite to increase the reliability of the quality of the solutions. In view of this, Galvão et al. (1997) investigated the integration of routing models and Geographic Information Systems (GIS) applied to a simulated soft drinks distribution problem in Rio de Janeiro. Tarantilis & Kiranoudis (2002) proposed a decision support system (DSS) which combines GIS with heuristic
methods to solve VRPs in Athens.
Due to the aforementioned practical importance of VRPs, there are various softwares available in
the market capable of solving them. Baker (2002)
compared different softwares focusing his attention on the optimization algorithms used. More recent studies regarding prices, computational performance, algorithms used and solvable variants, among other
aspects, can be found in Partyka & Hall (2010).
3 Description of the company and its
distribution process
The manufacturing plant under analysis is located
in the state of Paraíba, Brazil, and has thousands
of customers, ranging from small retailers to large supermarket chains, spread over the Brazillian Northeast region. In addition to the bottling of mineral water, the company produces soft drinks, juices and energy drinks. The company is responsible for the distribution of the products to the customers and in order to do so, it relies on the aid of a routing software.
The leet available to perform the distribution is composed of 37 vehicles, where 36 of them
are outsourced and they have distinct capacities; whereas the remaining one is owned by the company
itself and it has a capacity of 25 tons. This leet is
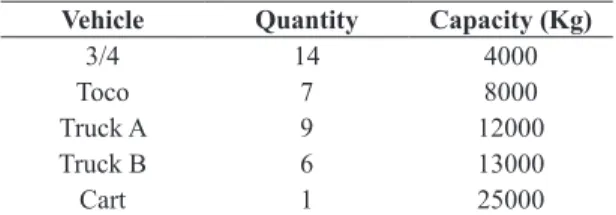
responsible for delivering customer’s orders from all over the state of Paraiba as well as from some other states of the Northeast region. Table 1 presents the characteristics of the vehicles.
The data associated with the customers orders
were restricted to region of the Greater João Pessoa (GJP), which consists of 5 cities: João Pessoa, Cabedelo, Santa Rita, Bayeux and Lucena. On average, 300 customers are served per day in this area.
Table 1. Vehicle Fleet.
Vehicle Quantity Capacity (Kg)
3/4 14 4000
Toco 7 8000
Truck A 9 12000
Truck B 6 13000
The sales orders are delivered daily to the distribution sector once they are collected by the retailers. Since nearly all vehicles are outsourced and their payment is directly proportional to both the distance traveled and the use of the vehicles, it is in the company’s interest to reduce them.
4 Obtaining the distances and travel
times between customers
The data used to solve the problem was provided by the company studied. However, while collecting such data, it was not possible to obtain the distance and travel time matrices between customers. This information belongs to the companz that developed the routing
software, which was not contacted due to inancial issues. As a result, we decided to use Google Maps
to obtain the referred data.
Google Maps is a Google service that offers a
powerful and friendly mapping technology. Among
many of its features, it allows users to ind addresses
and obtain routes between two or more locations, giving a description of the path as well as the distance and time necessary to perform it.
The Google Maps JavaScript API is a free service
and available to any free access site. However, some functions are restricted to a certain amount
and frequency of requests. For instance, when
demanding a route from one place to another, we
have a requisition. At the time that the research was conducted, this service was limited to 15000 daily requisitions. Once this limit is reached, the user’s
Internet Protocol (IP) address is temporarily blocked
for a period of 24 hours.
Assuming that 300 customers, on average, place
orders daily to the company, the distance and travel
time matrices will have 90.000 elements each, respectively. Therefore, in order to completely ill the matrices, the number of requisitions would exceed the limits established by Google, in case they were requested point by point. Nevertheless, instead of sending a route request providing the location of
2 customers at a time, we developed an algorithm that
provides a path (restricted to 25 points) as requisition. Hence, when taking a path that contains 25 points (customers), it is possible to obtain 24 distances and 24 times per requisition, making it feasible to obtain
the matrices without exceeding the service limits.
For instance, when taking a path with 5 points, A-B-C-D-E, it is possible to obtain 4 distances (d)
and 4 times (t) between customers: dAB, dBC, dCD, dDE
and tAB, tBC, tCD, tDE.
The Algorithm 1 shows the method developed to obtain the distance and time matrices between customers. The geographical coordinates of the customers were provided by the company.
5 The ILS-RVND algorithm
The proposed algorithm consists of and adaptation of the ILS-RVND heuristic presented in Penna et al.
(2013). ILS-RVND is based on the Iterated Local Search (ILS) metaheuristic (Lourenço et al., 2002) which
makes use of a Randomized Variable Neighborhood
Descent procedure (RVND) (Hansen et al., 2010) in
the Local Search phase. In order to contribute for the
diversiication of the search space, ILS-RVND employs
more than one type of procedure for generating initial solutions, as well as for performing local search and perturbation. The original ILS-RVND algorithm was adapted to take into account the particularities of the case study, such as the route duration constraints and the asymmetrical distances between customers.
The pseudocode of the ILS-RVND heuristic is illustrated in Algorithm 2. The input parameters of the algorithm are MaxIter, MaxIterILS and v, where the latter represents the total number of vehicles available. MaxIter represents the number of restarts
of the algorithm (lines 4-21) and an initial solution is
generated at each restart. After the generation of the initial solution, the main loop of the ILS algorithm is executed MaxIterILS times (lines 8-16), as an
attempt to improve the initial solution by means
of local search (line 9) and perturbation (line 14)
procedures. In case the best solution found after the ILS loop (MaxIterILS times) is better than the initial solution generated, this becomes the current solution and the algorithm is restarted from line 3.
Algorithm 1. Obtaining the distance and time matrices between customers.
1: Procedure GetMatrices() 2: i = 1;
3: j = 1; 4: while i ≤ n do 5: while j ≤ n do
6: add address of i to the path; 7: add address of j to the path; 8: if size of the path = 24 or j = n then 9: add address of i to the path; 10: sends path as a route requisition; 11: empty path;
5.1 Generation of the initial solution
The procedure for generating initial solutions makes use of two insertion criteria, more precisely,
the Modiied Cheapest Feasible Insertion Criterion (MCFIC) and the Nearest Feasible Insertion Criterion (NFIC). In addition, two insertion strategies were applied: the Sequential Insertion Strategy (SIS) and
the Parallel Insertion Strategy (PIS).
The pseudocode of the procedure for generating an initial solution is represented in Algorithm 3. Initially, the vehicles are sorted in descending order, with respect to their capacity, in such a way that each vehicle serves a route with a single customer, chosen
according to the largest demand (lines 4-8). Next, an
insertion criterion and strategy are randomly selected
(lines 9-10). An initial solution is then built, using the criterion and the strategy selected (lines 11-15).
If an infeasible solution is generated, the procedure is restarted from line 3. In the case of the AHLFVRP, an infeasible solution is obtained when the available vehicles are not capable of serving all customers or the duration of one or more routes exceed the maximum limit. If it is not possible to produce a feasible initial solution after a certain number of consecutive attempts,
Algorithm 2. ILS-RVND.
1: Procedure ILS-RVND(MaxIter, MaxIterILS, v) 2: LoadData();
3: f* ← ∞;
4: for i = 1, ..., MaxIterdo
5: s ← GenerateInitialSolution (v, MaxIter, seed); 6: s’ ← s;
7: iterILS ← 0;
8: while iterILS ≤ MaxIterILSdo 9: s ← RVND(s);
10: if f(s) <f(s’) then 11: s’ ← s; 12: iterILS← 0; 13: end if
14: s’ ← Perturb(s’, seed); 15: iterILS ← iterILS + 1; 16: end while
17: if f(s’) < f*then 18: s* ← s’; 19: f* ← f(s’); 20: end if 21: end for 22: return s*; 23: end ILS-RVND.
Algorithm 3. Generation of the Initial Solution.
1: Procedure GenerateInitialSolution(v, MaxIter, seed) 2: ConsecutiveTrials ← 0;
3: Initialize CL;
4: Let s = {s1, ..., sV} the set composed of v empty routes, sorted in descending order according to the capacity;
5: for v’ = 1, ..., v-1 do
6: sV’ ← k associated with max
k∈CL{qk};
7: Update CL; {CL ← CL – {k}}. 8: end for
9: InsertionCriterion ← MCFIC or NFIC (selected at random); 10: InsertionStrategy ← SIS or PIS (selected at random); 11: if InsertionStrategy = SIS then
12: s ← SequentialInsertion(s, v, CL, InsertionCriterion); 13: else
14: s ← ParallelInsertion(s, v, CL, InsertionCriterion); 15: end if
16: if s is infeasible then
17: ConsecutiveTrials ← ConsecutiveTrials + 1; 18: if ConsecutiveTrials = MaxIter then 19: v ← v + 1;
20: ConsecutiveTrials ← 0; 21: end if
22: Go to line 3; 23: else
24: return s; 25: end if
an extra vehicle is added in order to facilitate the process of generating a complete initial solution (this
vehicle cannot be used in the inal solution). MCFIC consists of inserting, in a given route, a
customer k belonging to the Candidate List (CL) that has the cheapest insertion cost denoted by Expression
(1), in which the irst part computes the insertion cost
of customer k between two adjacent customers i and
j, while the second one is a mechanism used to avoid the late insertion of customers located far from the depot, representing a reduction of the insertion cost as a function of the distance from the depot (back
and forth).The parameter γ can assume any value in the following set: {0.00, 0.05, 0.10, ..., 1.65, 1.70} (Subramanian et al., 2010).
(
–)
– (0 0){ ik kj ij k k | }
min c +c c γ c +c k∈CL (1)
In NFIC, one should include in the route a customer
k∈CL with the shortest distance with respect to a given customer i already inserted, as represented in Expression (2). In this case, k is always inserted after i.
{ik| }
min c k∈CL (2)
In SIS, only one route is considered for insertion at
each iteration. If MCFIC is the insertion criterion, the γ value is then chosen at random from the set already speciied. While the CL is not empty and there is at least one customer k ∈ CL that can be added to the current solution without violating any constraint, a customer is inserted in each route according to the insertion criterion selected.
As opposed to the previous case, PIS takes all routes into consideration when computing the insertion costs. Therefore, one evaluates the insertion of customer
k in every possible position of all routes. The best possible insertion, that is, the one associated with the smallest cost and that does not violate the constraints
of the problem is then performed (lines 7-12).
5.2 Local search
One of the main characteristics of the ILS-RVND metaheuristic is the ability to perform a randomized ordering of the neighborhood structures (RVND), in contrast to the usual VND approaches that employ a deterministic order, thus avoiding both the use of parameter tuning and the premature convergence to
poor-quality local optimal solutions.
The pseudocode of the RVND procedure is shown in Algorithm 4. Initially, a inter-route neighborhood structure is selected randomly from a Neighborhood List NL (line 4). Next, the best solution is determined
from the set of moves of the neighborhood selected and, in case the solution found is better than the current solution, this becomes the current solution
and then, an intra-route local search is performed
(lines 6-9). If the inter-route neighborhood search
leads to an improvement, the NL is repopulated
with all neighborhoods (line 9). In case the solution
found with the use of inter-route neighborhood is not better than the current solution, such neighborhood is removed from NL (line 12) and the same procedures
(from line 4) are repeated until the list becomes empty.
Similarly to the inter-route, the intra-route local search algorithm consists of randomly choosing a neighborhood contained in a list NL2, determining the best solution by applying moves of the neighborhood selected and, in case it is better than the current solution, it becomes the new current solution. In case of no improvement, the neighborhood is removed from NL2 and the same procedures are repeated until the list becomes empty. The NL2 list is always restarted after the inter-route neighborhood search leads to an improvement.
In both inter-route and intra-route local search procedures, only moves that do not violate the vehicle capacity and the route duration constraints are accepted.
The algorithm veriies if the move is feasible or not,
always after ascertaining the improvement in the current solution. Hence, it is possible to reduce the runtime of the algorithm.
The veriication of the vehicle capacity constraint
can be performed in a constant time by comparing the sum of the customers’ demands with the vehicle capacity of a given route. As for performing the
veriication of the route duration constraint in constant
time, one needs to keep track of the duration of each route during the whole local search procedure. Some auxiliary structures are employed by the ILS-RVND algorithm in order to yield an improvement of the computational performance. A detailed description of
these structures can be found in Penna et al. (2013).
Algorithm 4. RVND. 1: Procedure RVND(s)
2: Initialize the inter-route Neighborhood List NL; 3: while NL ≠ 0 do
4: Select a neighborhood N(Η) ∈NL at random; 5: Find the best neighbor s’ of s ∈ N(Η); 6: if f(s’) < f(s) then
7: s ← s’;
8: s ← IntraRouteSearch(s); 9: Update NL;
10: else
11: Remove N(Η) from NL; 12: end if
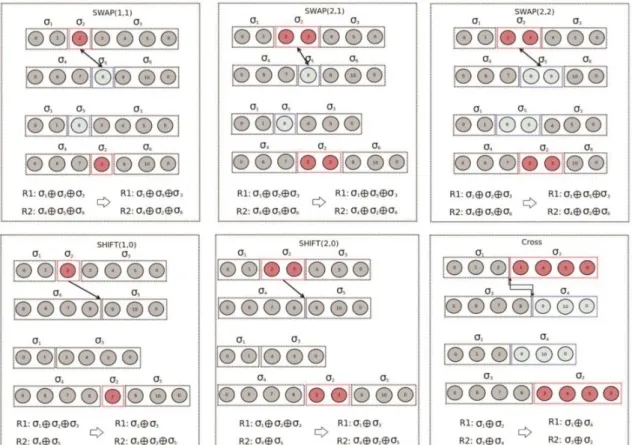
5.2.1 Inter-route neighborhood structures
In order to solve the AHLFVRP, six inter-route neighborhood structures were used. Five of them are
based on the λ-interchanges scheme (Osman, 1993), which consists of exchanging up to λ customers
between two routes; while the remaining one is based on the Cross-exchange operator (Taillard et al.,
1997), which consists of exchanging two segments of
different routes. To limit the number of possibilities,
we considered λ=2. A description of each structure
is presented as follows.
1. Shift(1,0) – One customer is moved from a route
to another one.
2. Shift(2,0) – Two customers k1 and k2 are moved from one route to another one. In this case, both arcs (k1, k2) and (k2, k1) are considered.
3. Swap(1,1) – Interchange between one customer
of a route and a customer from another route.
4. Swap(2,1) – Interchange between two adjacent
customers k1 and k2 from a route and one customer
k3, from another route. In this case, both arcs (k1,k2) and (k2,k1) are considered.
5. Swap(2,2) – Interchange between two adjacent
customers k1 and k2 from one route and two adjacent customers k3 and k4, from another route. In this situation, all the four possible combinations of the interchanging arcs formed by the two pairs of customers are considered.
6. Cross – Interchange between a segment of a
route and a segment of another route. A segment of route is determined by the set of customers located along the path between two customers. For the proposed algorithm, only the segments of route ending at the depot are considered.
A graphic illustration of the inter-route neighborhoods implemented is depicted in Figure 2, in which
σ represents the segment of route containing one or
more customers and ⊕ represents the concatenation operator between two segments of route.
5.2.2 Intra-route neighbourhood structures
This set of neighborhoods consists of rellocating customers of a same route. In this case, it is not necessary to verify the vehicles’ capacities constraints, as long as the previous solution is feasible, the exchange of positions between customers in a same route will not affect its total demand. However, since the exchange
of positions between customers will modify the path
traveled and, consequently, the time of the duration of
the route, verifying the total duration time of the route becomes necessary. Four intra-route neighborhood structures were adopted and their description is as follows.
1. Reinsertion – One customer is removed and
inserted in another position of the route.
2. Or-Opt2 – Two adjacent customers are removed
and inserted in another position of the route.
3. Or-Opt3 – Three adjacent customers are removed
and inserted in another position of the route.
4. Exchange – Permutation between two non-adjacent
customers.
A graphic illustration of the intra-route neighborhoods implemented can be observed in Figure 3.
5.3 Perturbation mechanism
According to Lourenço et al. (2002), the perturbation
mechanisms are considered to be key aspects for the high performance of the ILS metaheuristic, as well as the local search.
In contrast to the local search procedures, the perturbation mechanisms are not intended to improve the solution. They are, however, useful in performing
modiications in the current solution, as an attempt to
escape from local optima.
As in the previous procedures, two perturbations were used, and they are randomly selected by the
algorithm. Such procedures are described as follows:
1. Multiple-Swap(1,1) – Multiple Swap(1,1) moves are executed between different pairs or routes selected at random.
2. Multiple-Shift(1,1) – Multiple Shift(1,1) moves are executed randomly.
6 Computational results
In this section, we present a description of the
instances (daily orders) concerning the leet of vehicles
and the demand. Next, we compare the results achieved by ILS-RVND with those adopted by the company
in question. In this section, we present a description of the instances concerning the leet of vehicles and
the demand. We then compare the results achieved by ILS-RVND with those adopted by the company.
The proposed algorithm was coded in C++ and executed in an intel Core i5-2410M 2.3 GHz with 4 GB of RAM memory running Ubuntu Linux 10.10.
After conducting some preliminary experiments, we considered the value of parameter MaxIter to
be 10 in all instances, while we set the MaxIterILS
parameter, according to the characteristics of the instances, more precisely, as the number of customers plus the number of vehicles available. Each instance
was executed 10 times.
In spite of the 12-hour limit on the route duration adopted by the company’s software, the instances were
solved by ILS-RVND considering an 8-hour limit,
so as to be within the limits established by Brazilian labor legislation.
6.1 Instances
The quantity and the types of vehicles considered in
the instances were the same adopted by the company
when serving only the customers located in GJP
(according to the routes generated by the software).
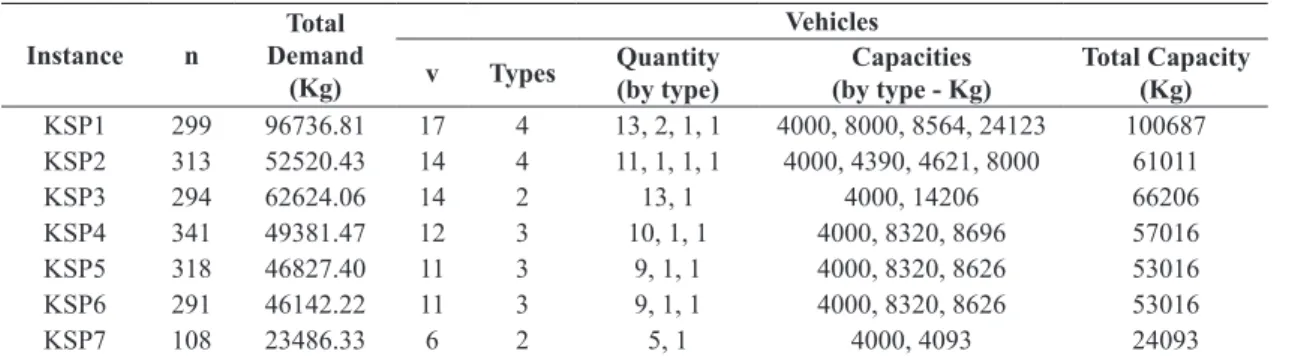
The tests were performed on a set of 7 instances, as
shown in Table 2.
Regarding the solutions generated by the company’s
software, it was veriied that occasionally some vehicles were overloaded. Such practice is required
in cases where the customer’s demand exceeds the vehicle’s capacity.
The KSP4, KSP5 E KSP6 instances refer to the
orders of a single day. Such division was done due to the existence of customers’ orders located in a region
outside GJP, so that one of the routes generated by the company’s software have customers from GJP as well as customers from another region. The KSP4 instance has all the customers. In the KSP5 instance, we removed both the customers located outside GJP
and the vehicle used in this route. As for the KSP6 instance, we disregarded all the customers of this route, including the vehicle (based on the company’s solution). Another reason for dividing this instance was to try to solve the AHLFVRP in such a way that
it would be suitable for all GJP customers without requiring a vehicle responsible for serving customers
from another region. The solutions found by ILS-RVND
for the instance KSP5 could not be compared because
the company did not have a solution available for this situation.
6.2 Comparison of results
The comparison of results was performed with respect to both the total distance traveled by the vehicles and the number of vehicles used.
The best solutions found by the ILS-RVND heuristic are shown in Table 3, as well as the averages and the
standard deviations concerning the 10 executions.
The results are expressed in terms of the distance traveled and the execution time of the algorithm.
A considerable reduction in the total distance traveled was achieved for all instances, as observed in Table 4. Such reductions can be regarded as reductions in variable costs since both fuel costs and vehicle depreciation increase with the distance traveled.
When comparing in terms of vehicles, the use of the ILS-RVND heuristic contributed to the reduction
of the number of vehicles in 3 out of 6 instances, as pointed out in Table 5. Since all vehicles used by the company are outsourced, reducing the number of vehicles leads to a reduction in the company’s
ixed costs.
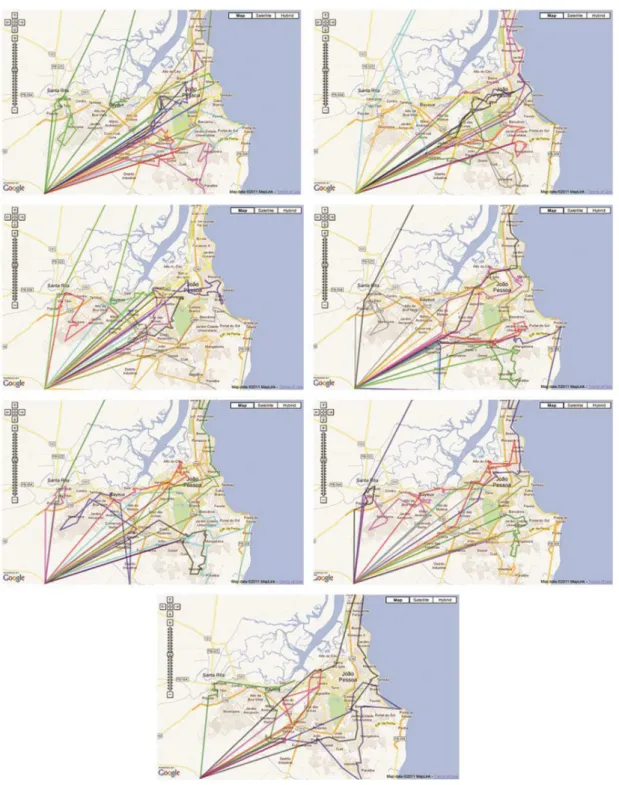
The best solutions achieved by ILS-RVND for the instances presented were illustrated with the aid of
Google Maps, as can be observed in Figure 4. Each polygon represents a route and each vertex of the polygon represents a customer (or the depot).
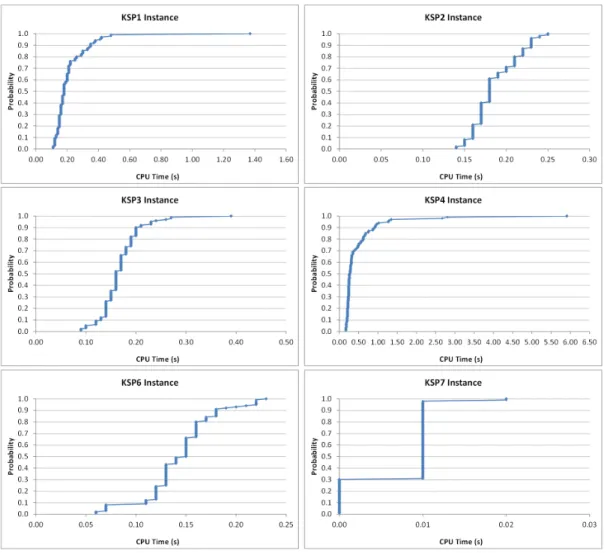
6.3 Convergence Graphs
With a view of evaluating the ILS-RVND performance and comparing it with the results obtained by the company’s routing software, we have generated
Table 2. Instances.
Instance n
Total Demand
(Kg)
Vehicles
v Types Quantity
(by type)
Capacities (by type - Kg)
Total Capacity (Kg)
KSP1 299 96736.81 17 4 13, 2, 1, 1 4000, 8000, 8564, 24123 100687
KSP2 313 52520.43 14 4 11, 1, 1, 1 4000, 4390, 4621, 8000 61011
KSP3 294 62624.06 14 2 13, 1 4000, 14206 66206
KSP4 341 49381.47 12 3 10, 1, 1 4000, 8320, 8696 57016
KSP5 318 46827.40 11 3 9, 1, 1 4000, 8320, 8626 53016
KSP6 291 46142.22 11 3 9, 1, 1 4000, 8320, 8626 53016
KSP7 108 23486.33 6 2 5, 1 4000, 4093 24093
Table 4. Comparison of results in terms of distance traveled.
Instance
Distance (Km)
Average Gap (%)
Company ILS-RVND
Best Solution
ILS-RVND Average Solution
KSP1 1519.30 1394.48 1417.30 -6.71
KSP2 1342.70 1049.56 1054.01 -21.50
KSP3 1318.90 1157.02 1165.06 -11.66
KSP4 1288.90 1158.30 1168.89 -9.31
KSP5 1082.80 856.12 861.17 -20.47
KSP6 600.20 509.33 514.16 -14.34
KSP7 1519.30 1394.48 1417.30 -6.71
Average -14.00%
Table 3. ILS-RVND Statistics.
Instance
Total Distance (Km) CPU Time (s)
Best Solution Average
Solution Std. Dev. Best Solution
Average
Solution Std. Dev.
KSP1 1394.48 1417.3 12.10 293.80 285.39 40.90
KSP2 1049.56 1054.01 2.24 360.86 335.46 31.04
KSP3 1157.02 1165.06 4.74 274.21 288.42 31.89
KSP4 1158.30 1168.89 6.79 637.06 599.74 84.05
KSP5 877.46 889.54 8.72 465.71 536.37 48.41
KSP6 856.12 861.17 3.40 277.40 318.95 33.37
Table 5. Comparison of results in terms of the vehicles used.
Instance No. of vehicles used Reduction
Company ILS-RVND
KSP1 17 17 0
KSP2 14 12 2
KSP3 14 14 0
KSP4 12 11 1
KSP6 11 10 1
KSP7 6 6 0
Figure 4. Best solutions.
convergence graphs for each instance in which the results found by the company were available.
The convergence graphs presented in Figure 5 represent the time spent by the ILS-RVND algorithm
to ind a better or equal solution to the one achieved
by the company. To this end, the ILS-RVND heuristic
was executed 100 times for each instance, but this time
using a different stopping criterion, more precisely,
of exact methods becomes prohibitive, especially
when dealing with 300-customer instances, which
is the average size considered in this work. Hence,
it was veriied that the use of heuristics revealed to be an adequate strategy to achieve the objective of
this paper, that is, to generate good solutions for the problem in a reasonably short execution time.
As expected, the ILS-RVND heuristic proposed
by Penna et al. (2013) proved to be very eficient, obtaining high quality solutions. The algorithm was tested on a set of 7 instances associated with the
daily orders of the company, in which an average
improvement of approximately 14% was achieved,
when compared with the practical solutions adopted by the company in terms of distance traveled. There was also a reduction in the number of vehicles used to serve all customers. Such results can be regarded
as possible reductions in ixed and variable costs,
since the vehicles are outsourced and the company not only pays for their daily usage but also for their operation and maintenance costs.
equal to the one reported by the company’s software.
For each execution, we stored the computational
time required until the stopping criterion is met, so that it is possible to infer the probability of equaling
or enhancing the company’s results for a given processing time.
From Figure 5, it can be observed that the maximum
time required by the ILS-RVND algorithm to obtain
the same results or to outperform the routing software was approximately 6 seconds (for an instance of
341 customers). In general, such results were achieved
in less than one second, which emphasizes the high performance of the ILS-RVND algorithm.
7 Conclusions
This article dealt with an Asymmetric Heterogeneous Limited Fleet Vehicle Routing Problem (AHLFVRP) with route duration constraints in the context of a large-scale beverage industry. Due to the high computational complexity of the problem, the use
com frota heterogênea limitada: um estudo de caso em uma indústria de bebidas. In Anais do XVI CLAIO/XLIV SBPO (pp. 2102- 2113). Rio de Janeiro: SOBRAPO. Lourenço, H. R., Martin, O. C., & Stützle, T. (2002). Iterated
local search. In F. Glover & G. A. Kochenberger (Eds.), Handbook of metaheuristics (pp. 321-353). Norwell: Kluwer Academic Publishers.
Marmion, M.-E., Humeau, J., Jourdan, L., & Dhaenens, C. (2010). Comparison of neighborhoods for the HFF-AVRP. In International Conference on Computer Systems and Applications (AICCSA) (pp. 1-7). Hammamet: IEEE. http://dx.doi.org/10.1109/AICCSA.2010.5586979. Osman, I. H. (1993). Metastrategy simulated annealing and
tabu search algorithms for the vehicle routing problem. Annals of Operations Research, 41(4), 421-451. http:// dx.doi.org/10.1007/BF02023004.
Partyka, J., & Hall, R. (2010). On the road to connectivity. ORMS Today, 37(1), 42-49.
Penna, P. H. V., Subramanian, A., & Ochi, L. S. (2013). An iterated local search heuristic for the heterogenous fleet vehicle routing problem. Journal of Heuristics, 19(2), 201-232. http://dx.doi.org/10.1007/s10732-011-9186-y. Prins, C. (2002). Efficient heuristics for the heterogeneous
fleet multitrip VRP with application to a large-scale real case. Journal of Mathematical Modelling and Algorithms, 1(2), 135-150. http://dx.doi.org/10.1023/A:1016516326823. Souza, M. J. F. (2007). Inteligência computacional para
otimização (Notas de aula). Ouro Preto: Universidade Federal de Ouro Preto.
Subramanian, A., Drummond, L. M. A., Bentes, C., Ochi, L. S., & Farias, R. (2010). A parallel heuristic for the vehicle routing problem with simultaneous pickup and delivery. Computers & Operations Research, 37(11), 1899-1911. http://dx.doi.org/10.1016/j.cor.2009.10.011. Taillard, E., Badeau, P., Gendreau, M., Guertin, F., &
Potvin, J.-Y. (1997). A tabu search heuristic for the vehicle routing problem with soft time windows. Transportation Science, 31(2), 170-186. http://dx.doi. org/10.1287/trsc.31.2.170.
Tarantilis, C., & Kiranoudis, C. (2001). A meta-heuristic algorithm for the efficient distribution of perishable foods. Journal of Food Engineering, 50(1), 1-9. http:// dx.doi.org/10.1016/S0260-8774(00)00187-4. Tarantilis, C., & Kiranoudis, C. (2002). Using a spatial
decision support system for solving the vehicle routing problem. Information & Management, 39(5), 359-375. http://dx.doi.org/10.1016/S0378-7206(01)00103-3. Tarantilis, C., & Kiranoudis, C. (2007). A flexible adaptive
memory-based algorithm for real-life transportation operations: Two case studies from dairy and construction sector. European Journal of Operational Research, 179(3), 806-822. http://dx.doi.org/10.1016/j.ejor.2005.03.059. Toth, P., & Vigo, D. (2002). The vehicle routing problem
(SIAM Monographs on Discrete Mathematics and Applications). Philadelphia: SIAM.
References
Baker, E. K. (2002). Evolution of microcomputer-based vehiclerouting software: case studies in the United States. In P. Toth & D. Vigo (Eds.), The vehicle routing problem (SIAM Monographs on Discrete Mathematics and Applications, pp. 353-361). Philadelphia: SIAM. Belfiore, P., & Yoshizaki, H. T. Y. (2009). Scatter search for
a real-life heterogeneous fleet vehicle routing problem with time windows and split deliveries in Brazil. European Journal of Operational Research, 199(3), 750-758. http://dx.doi.org/10.1016/j.ejor.2008.08.003. Blum, C., & Roli, A. (2003). Metaheuristics in combinatorial
optimization: overview and conceptual comparison. ACM Computing Surveys, 35(3), 268-308. http://dx.doi. org/10.1145/937503.937505.
Campos, G. G., Yoshizaki, H. T. Y., & Belfiore, P. P. (2006). Algoritmos genéticos e computação paralela para problemas de roteirização de veículos com janelas de tempo e entregas fracionadas. Gestão & Produção, 13(2), 271-281. http://dx.doi.org/10.1590/S0104-530X2006000200009.
Clarke, G., & Wright, J. W. (1964). Scheduling of vehicles from a central depot to a number of delivery points. Operations Research, 12(4), 568-581. http://dx.doi. org/10.1287/opre.12.4.568.
Dantzig, G. B., & Ramser, J. H. (1959). The truck dispatching problem. Management Science, 6(1), 80-91. http:// dx.doi.org/10.1287/mnsc.6.1.80.
Galvão, R. D., Barros Neto, J. F., Ferreira Filho, V. J. M., & Henriques, H. B. S. (1997). Roteamento de veículos com base em sistemas de informação geográfica. Gestão & Produção, 4(2), 159-174.
Gendreau, M., & Potvin, J.-Y. (2010). Handbook of metaheuristics. 2 ed. Berlin: Springer. 648 p.
Golden, B. L., Assad, A. A., & Wasil, E. A. (2002). Routing vehicles in the real world: applications in the solid waste, beverage, food, dairy and newspaper industries. In P. Toth & D. Vigo (Eds.), The vehicle routing problem (SIAM Monographs on Discrete Mathematics and Applications, pp. 245-286). Philadelphia: SIAM. Golden, B., Raghavan, S., & Wasil, E. (2008). The vehicle
routing problem: latest advances and new challenges. New York: Springer.
Gonçalves, S. M., & Steiner, M. T. A., & Zamboni, V. S. (2005). Uma metodologia para o problema de roteamento de veículos - um estudo de caso para a distribuição de água mineral. In Anais do XXXVII SBPO (pp. 1413-1423). Gramado: SOBRAPO.
Hansen, P., Mladenović, N., & Pérez, J. A. M. (2010). Variable neighborhood search: methods and applications. Annals of Operations Research, 175(1), 367-407. http:// dx.doi.org/10.1007/s10479-009-0657-6.