Vol.61, no.spe: e18000031, 2018 http://dx.doi.org/10.1590/1678-4324-smart-2018000031
ISSN 1678-4324 Online Edition
BRAZILIAN ARCHIVES OF BIOLOGY AND TECHNOLOGY
A N I N T E R N A T I O N A L J O U R N A L
Analysis of the Impacts of the Electrification of the Vehicle
Fleet in the Electric Power System in Curitiba
Rossetto, Matheus Brati
1*; Lourenço, Elizete Maria
2 .1Institutos LACTEC, Curitiba, Brasil; 2Universidade Federal do Paraná, Curitiba, Brasil.
ABSTRACT
The Market share of electrical vehicles has been rising in the past few years and tends to rise even more. According to the International Energy Agency, an increase of 50% in the number of electrical vehicles is expected. Whilst that increase is beneficial from a greenhouse gases emissions drop point of view, that rise could, on the other hand,
represent a major increase in the electrical power consumption. Besides, other problems such as harmonics and overloads could emerge from the massive connection of electrical vehicles to the electrical grid. Therefore, it is necessary to perform studies and simulations in order to estimate those problems and to mitigate the problems related to the inevitable expansion of the electric vehicle fleet in the near future. The present work intends to run simulations so as to identify the main effects of the electrification of the vehicular fleet in the city of Curitiba, as well as understand how the provision of ancillary services through the electrical vehicles can help in the process.
Keywords: Electric Vehicles, Distributed Generation, Vehicle-to-Grid, Ancillary Services, Smart Cities, MatPower
INTRODUCTION
Getting around is a fundamental part of human civilization and the movement of ideas, goods and people is one of the main sources of energy consumption. In this way, it is natural that with the pressures for lower greenhouse gas emissions, cleaner transport alternatives are sought. Therefore, a large increase in the number of electric vehicles is
expected by 20501, as illustrated in Figure 1. Currently, the global fleet of electric
vehicles is estimated at around 10 million1.
Figure 1. Predicted growth in sales of electric vehicles1
It is estimated that the transportation sector will account for 10% of total electricity consumption by 2050 due to the increase in the number of electric vehicles (EVs) and
hybrid plug-in electric vehicles (PHEVs)1.
In Brazil, although sales of electric vehicles are not yet significant, mainly due to high tariffs (mainly IPVA and import taxes) and high prices, growth in future sales is expected. According to Marisa Monteiro, a consultant for the Brazilian Association of Electric Vehicles (ABVE), it is expected that up to 50,000 EVs will be sold in the country by 2026. It is necessary, therefore, that the impacts of this new demand be studied and quantified to guarantee the stability of the electric power systems.
An important concept to be presented is the Vehicle to Grid or V2G (Vehicle to the Network) power flow. It was first addressed by Kempton in 1972. It consists of the temporary supply of energy stored in the battery of the electric vehicles to the electric grid.
This idea is intrinsically linked to that of smart-grids, where bidirectional power flows are made possible through communication between the various equipment of the system and through intelligent meters1.
Within the notion of V2G, there is yet a very important concept: Virtual Power Plants (VPPs). It is the strategy of treating a group of electric vehicles as a single energy-generating unit, which makes control simpler and less costly than if each car were
individually treated2.
to the generation and distribution of electricity2. In addition, the use of the V2G strategy
can help to mitigate problems related to intermittent renewable energy sources2.
One of the most important recharge strategies is the one that aims to make the demand curve more uniform using two loading strategies: peak-shaving, which consists of supplying energy to the network at times of peak demand and the valley-filling
strategy, which consists of recharging the vehicles when the system's demand is low2.
Figure 2. Standardization of the Load Profile
These strategies result in a more uniform demand profile, as shown in Figure 2. This strategy has many advantages, such as loss reduction and the possibility of using
less oversized equipment in the network3. Often, it is necessary to use transformers and
other equipment to withstand the peak of demand, even if this peak is happening only in a few periods of the day. The V2G strategy can help mitigate this problem.
There are several levels of voltage and current that can be used to recharge the batteries of electric vehicles. According to the United States National Energy Council standard,
three levels may be used3:
• Level 1: Slow Charging, using conventional 120V sockets with capacity from 10 to
20A, totaling a maximum of 2.4 kW of power;
• Level 2: Fast Charging, with 220V sockets and up to 20A, with maximum power of 3.3kW;
• Level 3: Ultrafast load, special outlets with different voltage levels, which enable
power outputs greater than 20 kW.
Level 1 and 2 charging can, with some care, be carried out in common household outlets, with Level 3 being intended for specific recharging sites, such as public
recharging stations3. It is necessary, however, that, for any of the aforementioned
recharging methods, protective equipment is used in order to prevent vehicles from accidentally energizing the distribution lines in the event of a supply interruption by the utility company.
Also, this work intends to evaluate the impacts of the fleet substitution, through simulation of the gradual replacement of percentages of the fleet by hybrid electric vehicles. Power flow analysis will be done considering the electrical system of the region of Curitiba. It is also intended to analyze the importance of ancillary services, such as voltage regulation and how these services can stimulate the mass adoption of EVs and help in mitigating the associated problems.
In this way, the article aims to simulate the additional load represented by the electric vehicles, firstly without the use of any mitigation strategy, such as programmed recharge and provision of ancillary services and afterwards, it is intended to simulate how they change the result and if they can help with this process.
MATERIALS AND METHODS
First, based on the market for electric vehicles and the characteristics of drivers in Brazil and in the world, the vehicle model to be used as the base for calculations was defined. Then, considering data on the battery of the chosen vehicle, also taking into account restrictions considering the maintenance of the battery life, the demand, recharge time and other electrical characteristics of each vehicle were estimated. After that, considering the number of vehicles in each neighborhood of the city of Curitiba and which bus of the electric system would be affected by this amount of vehicles, taking into account the period of the day in question, the additional load was estimated in the electric system. Finally, simulations were carried out in order to determine the impact of the vehicles on the load curve of the system during the day and in the power flow in the moments of peak demand.
Data Collection
In this article, the vehicle used in the simulations will be the Toyota Prius Hybrid Plug-in, model 2016, whose characteristics are summarized in Table 1.
Table 1. Features of the Toyota Prius5
Battery Capacity 8.8 kWh
Range 25 mi (40km)
Max. Recharge Load 3.3 kW
The data of the electric system were obtained through COPEL (the local electric utility), provided by employees or obtained through the company's official website. Data such as the Curitiba region geoelectric map, as well as the load levels for each of the 113 substations and 166 transmission and distribution lines of the electric system were used in the simulations.
Through the “Nosso Bairro” project, carried out by the city’s planning institute (IPPUC), it was possible to have access to several characteristics and relevant socioeconomic data about each neighborhood of Curitiba. The city has, according to data from the institute, about one million and two hundred thousand vehicles, with 70% of them, about 850 thousand, being cars and small vehicles. This amount represents that
there are 1.4 inhabitants for each vehicle3.
According to the city’s traffic department (Detran), in 2009, the city had only 6 pure
electric vehicles and 1 hybrid6. In the year 2014, the numbers were, respectively, 31
pure electric and 44 hybrids, a growth of 971.4% 6. Such growth corroborates the
Scenarios Considered For The Simulation
In general, we can summarize the scenarios considered for the simulation as follows:
• Charging without control, occurring in the period of greatest arrival of the vehicles in their residences, which coincides with the period of heavy load of the power system;
• Controlled charging, carried out during the light load period, with ancillary services
during the heavy load period.
The load levels are defined by COPEL, as periods of the day in which there is more or less demanded load of the system. The simulations were made considering the winter season, because during this period the effect of overlapping the peak of residential demand with the peak caused by electric vehicles is more relevant due to the absence of daylight saving time. In this season, the light load period is defined between 00:00 and 06:00 a.m. and the heavy load period between 06:00 and 10:00 p.m.
Each scenario was estimated considering different percentages of replacement of the
current fleet of vehicles by EVs. Similar to that, proposed by Osorio3, the percentage of
15, 30 and 50% was proposed for the replacement of the fleet. In addition, as mentioned by the author, it was assumed that the batteries will have constant demand for energy throughout the charging period.
Estimate of Additional Load Caused By Electric Vehicles - Recharging
Under Heavy Load
Firstly, the percentage of charge remaining in the vehicles' batteries when they are connected to the network has been defined. Considering that the daily average commute
distance of the inhabitants of Curitiba is 13.7 km2, which represents about 40% of the
Prius autonomy, it was assumed that the vehicles will arrive in the residences with 60% of charge. Thus, if recharging takes place as soon as the vehicles arrive, there will be about 3.5 kWh of energy to be charged per vehicle. Level 1 charging was assumed. In this way, charging this amount of energy will take about three hours. In addition, each vehicle will represent a demand of 1.2 kW.
The recharge time data are important because it enables the simulation of an important phenomenon: the superposition of vehicle loads. Considering that the EVs arrive home at different times and that they take considerable time to load, the demand due to the EVs connected at a certain time may overlap with the demand of those arriving at the next hour, for example. The distribution considered for this paper is shown in Figure 3.
Figure 3. Percentage Distribution of Vehicles Arriving on the Residences – Heavy Load Period 0%
5% 10% 15% 20% 25% 30% 35%
Estimate of Additional Load Caused by Electric Vehicles - Recharging
Under Light Load
In this scenario, it is considered that the vehicles will arrive and will be connected to the network following the same distribution proposed in Figure 3.
However, in this case, instead of representing a load, the vehicles represent an available power to be used in case of need. It was also assumed that vehicles will provide ancillary services until their batteries discharge to 40% of their capacity.
Thus, in this case, the batteries will now have to be charged from 40 to 100% of the charge, which will take about 5 hours.
It was assumed that the recharges will begin at 10 o'clock (p.m.) with percentages of vehicles being connected every hour shown in Figure 4.
Figure 4. Percentage Distribution of Vehicles Starting to Recharge At Each Hour
Simulation
Using the data and some necessary assumptions, simulations were made to analyze the impact of electric vehicles in Curitiba.
Given the additional load values in each situation, these were added to or subtracted from the original load curve, as discussed in the previous sections.
In addition, using the power curves and the calculated data, the most critical point of the system demand is determined in order to perform the power flow simulations (MatLab's MatPower module was used for this purpose). In this case, instead of considering the total vehicle fleet, the additional load represented by the number of vehicles in each neighborhood is added to the demanded power of each system bus.
The results are presented below.
RESULTS
Analysis of Load Curves - Recharge under Heavy Load
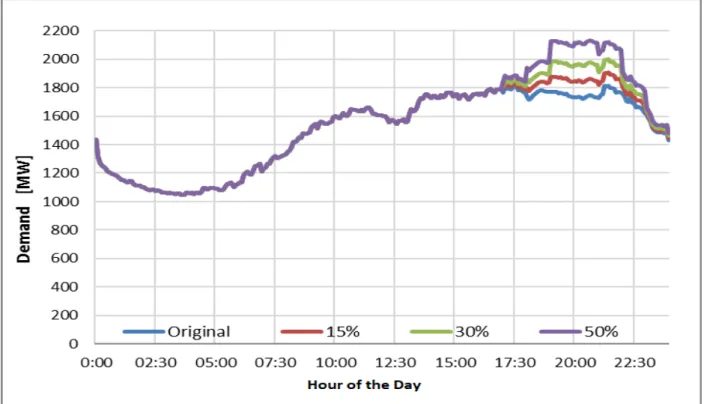
The results for recharging in the heavy load period, considering the different market penetration scenarios of electric vehicles are shown in Figure 5.
0% 5% 10% 15% 20% 25% 30% 35%
Figure 5. Load Curve for Heavy Load
In this case, the largest increase in demand is around 350 MW, representing a peak increase of more than 22% A considerable percentage, which can be problematic for the electrical system, since the entire infrastructure, from generation to cable transmission capacity and power transformers need to be revised to ensure service in the new scenario.
Analysis of Load Curves - Recharge Under Light Load
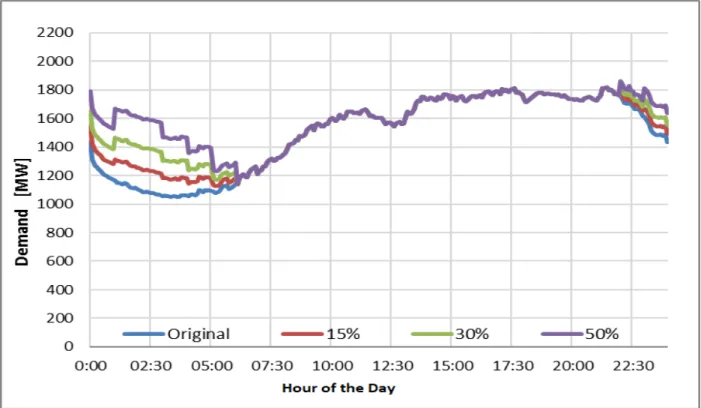
Figure 6. Load Curve for Light Load
It can be noticed that, in this case, there is a considerable demand caused by the electric vehicles in the period of light load, especially in the period around 00:00 hours, when there is the greatest overlap of vehicles.
However, observing the graph, it is possible to see that the demand, despite increasing significantly in relation to the original curve, is still lower than at the peak, in the heavy load. In this way, such a demand can be supplied by the system without major problems. However, a scheduling in the initial connection of the vehicles can make the load curve flatter and, therefore, avoid possible difficulties in the initial hours, seeking to fill the valley in a more uniform way, without the occurrence of the peaks shown in the figure. Such an option is feasible in practice through intelligent aggregators, but for simulation purposes the worst case is chosen, where there is a large overlap of vehicle loads.
Analysis of the Results of Power Flow Tests
Table 2. Results Summary - Heavy Load
Table 3, on the other hand, shows that the recharge of the vehicle batteries, if carried out in the light load period, presents significantly better voltage and loss values than the case where the recharge takes place during peak periods. This is evident when comparing Table 2 and Table 3.
Table 3. Results Summary - Light Load
Table 4 shows a summary of the voltage in bus 2352 (Guaricana), the most critical bar of Curitiba, i.e., with greater undervoltage in case of operation in heavy load (considering now that the vehicles provide reactive power to the system).
It is possible to notice that the use of electric vehicles, more specifically of the energy stored in their batteries, is enough to supply ancillary services. Even for 15% fleet replacement, it is already possible to manipulate the voltage considerably. An increase of about 3% is perceived, which is able to raise the bus voltage above the value of 0.92
p.u. According to Mwasilu2, the value of 0.90 p.u., although not ideal, is considered
acceptable in many cases.
Table 4. Voltage Profile – Bus 2352
DISCUSSION
As shown by the results, it is possible to effectively use the available energy in vehicles to improve the system voltage profile. Although not enough to solve all problems, this possibility is a good way to reduce the necessary costs to ensure proper operation of the electric power system.
In addition, additional more traditional strategies for improving the voltage profile can be adopted by the system utility, such as regulators, capacitor banks, and transformers switches, among others. For simulation purposes it was decided to consider only electric vehicles as voltage regulators, in order to obtain the worst possible scenario. In a real scenario, electric vehicles would be used in conjunction with these traditional methods, but would allow for reductions in the costs of the regulation process.
Case Highest Overvoltage (p.u.) Highest Undervoltage (p.u.) Losses (MW)
Original (Heavy Load) 1,060 0,894 1,99
Original (Light Load) 1,062 0,922 1,17
15% EVs 1,060 0,920 1,15
30% EVs 1,060 0,919 1,16
50% EVs 1,062 0,907 1,16
Case Highest Overvoltage (p.u.) Highest Undervoltage (p.u.) Losses (MW)
Original (Heavy) 1,060 0,894 1,99
15% 1,060 0,888 2,39
30% 1,060 0,883 2,88
50% 1,062 0,874 3,51
Case Voltage on Bus 2352 (p.u.)
Original (Heavy) 0,894
15% 0,924
30% 0,933
CONCLUSION
Regarding the problems caused by increased demand, it has become clear that such difficulties can be effectively mitigated by allocating such additional load at times that typically have lower energy demand. Although the operation of the system, considering 50% insertion of electric vehicles in the market is not ideal, the voltage and loss parameters are still better than those presented in the heavy load without considering the inclusion of the vehicles. Therefore, charging under light load is the best option. It is therefore necessary that there are tariff incentives in order to stimulate recharge at these times.
As for the ancillary services, the EVs presented great potential. The results showed that it is possible to use the vehicles as auxiliary methods in the voltage regulation. Concerning frequency regulation, despite many repeated battery operations (charge and discharge cycles) may reduce their lifespan, the availability of additional power from the vehicles allows the system to operate with greater slack, increasing system reliability and preventing possible frequency fluctuations.
In addition, the use of periods of the system with lower demand and the reduction of spikes (peak-shaving and valley-filling) allows to obtain a flat load curve, reducing losses and oversizing of equipment.
It is also important to highlight that, although it is unlikely that the Curitiba electricity system will have to supply such significant amounts of EVs in the near future, if this were to occur, it would be feasible to operate the system, provided that the recharge was performed on the light load period.
In other words, it is probable that the growth of the fleet of electric and hybrid vehicles will not represent the percentages proposed in this work in the short term. Such expansion may take years and it is possible that improvements in this period may be done to the system. However, the present study maintains its validity and relevance as a simulation, since it makes it possible to confront pessimistic opinions regarding the mass use of electric vehicles. Also, the method can be easily applied to other cities and systems, with the necessary adjustments.
ACKNOWLEDGMENTS
I am deeply grateful to all those who have supported and assisted me throughout my academic life. In particular, I would like to thank Prof. Dr. Elizete Maria Lourenço, my professor, for all the attention, patience and time available to help me in the writing of this work, as well as suggestions and ideas, fundamental for the conclusion of the work. I would also like to thank Professors Ademar Luiz Pastro and Vilson Roiz Gonçalves Rebelo da Silva, who have given me valuable suggestions for defining the premises adopted in the simulations.
Thanks also to Professor James Alexandre Baraniuk, for the help provided in the preparation of the theoretical revision and by the incentive in choosing the theme of this work.
I also extend my sincere thanks to the COPEL engineer Jun Kitagawa, who kindly provided data on the load levels of the buses in Curitiba.
REFERENCES
1. World Energy Outlook 2015 [Internet]. IEA webstore. International Energy
Agency; [cited 2017 Nov 10]. Available from:
https://webstore.iea.org/world-energy-outlook-2015
2. Mwasilu F, Justo JJ, Kim E-K, Do TD, Jung J-W. Electric vehicles and smart grid
interaction: A review on vehicle to grid and renewable energy sources integration.
Renewable and Sustainable Energy Reviews. 2014;34:501–16.
3. Tan KM, Ramachandaramurthy VK, Yong JY. Integration of electric vehicles in
smart grid: A review on vehicle to grid technologies and optimization techniques.
Renewable and Sustainable Energy Reviews. 2016;53:720–32., 53, pp.720-732.
4. Osorio VG. Carregamento ótimo de veículos elétricos considerando as restrições
das redes de distribuição de média tensão [thesis]. 2013.
5. 2018 Toyota Prius Prime Plug-In Hybrid | Let's imagine the new possible.
[Internet]. Toyota. [cited 2017 Nov 10]. Available from: http://www.toyota.com/priusprime
6. Paraná tem 10% da frota nacional de carros elétricos [Internet]. Bem Paraná.
[cited 2018 Oct 9]. Available from:
https://www.bemparana.com.br/noticia/parana-tem-10-da-frota-nacional-de-eletricos -
Received: December 21, 2017; Accepted: August 01, 2018