Research Article
Erkan Yalç
ın, Cem Kösemeci, Paula Correia, Ezgi Karademir, Manuela Ferreira,
So
fia G. Florença*, Raquel P. F. Guiné
Evaluation of consumer habits and knowledge
about dietary
fibre and fibre-rich products in
Turkish population
https://doi.org/10.1515/opag-2020-0042 received April 27, 2020; accepted May 22, 2020
Abstract: This study investigated the Turkish consumers’ knowledge about dietary fibres and purchasing beha-viours about fibre rich foods and also their attitudes towards food labelling with specific emphasis on dietary fibre. The survey consisted of a longitudinal study undertaken on a sample of 293 participants. For the analysis of the data, basic descriptive statistics was used, complemented with statistical tests (U-Mann Whitney [UMW] for comparisons between two groups and Kruskal–Wallis [KW] test for comparisons between three or more groups). Finally, a tree classification analysis was done to evaluate the relative importance of each of the possible influential variables on knowledge: age group, level of education, gender or living environment. The results revealed that both the level of knowledge about dietaryfibre and foods and also the level of knowledge about dietary fibre and health effects were considered high for the general population. The classification analysis revealed that gender was the major discriminant for knowledge about dietary fibre and foods, while the most important discriminant for knowledge about dietary fibre and health effects was age. The importance of this study resided in the highlight of the pivotal factors that
influence people’s knowledge about dietary fibre sources and the health benefits of its ingestion.
Keywords: Turkish consumers, dietary fibre, consump-tion habits, labelling, survey
1 Introduction
A healthy lifestyle comprises, together with other aspects, the consumption of required quantity of fruits, vegetables and whole cereals, which are known to be rich in dietary fibre, besides other important nutrients (Redgwell and Fischer 2005). Dietary fibres (DFs) are defined as complex carbohydrates, non-starch polysac-charides(NSP) or structural carbohydrates, which do not suffer digestion in the small intestine, thus reaching intact the large intestine where they suffer fermentation (partially or completely). The physiologic effects of DFs are linked to these fermenting properties and include metabolism and disease regulation(Brennan 2005).
The consumption of DF is associated with the reduction of plasma and low-density lipoprotein (LDL) cholesterol, as well as controlling glycaemic and insulin response(Conlon and Bird 2014). Furthermore, DFs also have proven to increase stool bulk, facilitating the intestinal transit and reducing the exposure of the intestinal mucosa to dietary carcinogens(Tungland and Meyer 2002). Other physiological effects include the prevention of obesity, coronary heart diseases, gastro -intestinal disorders or colon cancer (Charalampopoulos et al. 2002).
According to the World Health Organization(WHO), the daily recommended intake of DF for an average adult is 25 g per day for a healthy diet(Szűcs et al. 2016). The claim of “source of fibre” can be used only if the minimum amount of DF is 3% (w/w) (or equivalent to 1.5 g per 100 kcal), whereas if the amount is more than 6%, then the claim“high in fibre” can be used (EU 2011).
Erkan Yalçın, Cem Kösemeci, Ezgi Karademir: Department of Food Engineering, Faculty of Engineering & Architecture, Abantİzzet Baysal University, BAİBÜ Gölköy Yerleşkesi, 14030 Merkez, Bolu, Turkey
Paula Correia, Raquel P. F. Guiné: CERNAS-IPV Research Centre, Polytechnic Institute of Viseu, Campus Politécnico, Repeses, 3504-510 Viseu, Portugal
Manuela Ferreira: UICISA:E-IPV Research Centre, Polytechnic Institute of Viseu, Campus Politécnico, Repeses, 3504-510 Viseu, Portugal
* Corresponding author: Sofia G. Florença, FCNAUP - Faculty of Food Sciences and Nutrition, University of Porto, Rua Dr. Roberto Frias, 4200-465 Porto, Portugal, e-mail: sofi[email protected]
Open Access. © 2020 Erkan Yalçın et al., published by De Gruyter. This work is licensed under the Creative Commons Attribution 4.0 Public License.
A survey study was conducted for evaluating the consumer’s awareness about DF in 10 different countries (Guiné et al. 2016a). They found that the consumption of fibre-rich foods was low and far from the recommended levels. In addition, the consumers do not consider food labelling and nutritional information while purchasing, and consumers’ knowledge about DF was generally not satisfactory. The degree of knowledge about DF was also studied considering the influence of different factors such as gender, level of education, living environment and country. They observed some differences between genders, levels of education, living environments and countries, and the highest level of knowledge was seen in the female participants, those owing a university degree and those living in urban zones. It was also indicated that Turkey was in the third place among the best informed countries(Guiné et al. 2016b). Szűcs et al. (2016) also conducted a survey research on 713 con-sumers from Hungary and Romania, and the results indicated that the level of knowledge about DF was inadequate, and Internet appeared as a frequent source of information to promote the consumption of DF.
There is a gap in the information regarding how Turkish people perceive DF, what are their attitudes about it, both from the perspective of consumption and also buying, and what is their degree of knowledge about facts related with DF. Hence, the objective of this study is to learn the Turkish consumers’ knowledge about DF and purchasing behaviours forfibre-rich foods and to find out their attitudes towards food labelling regarding DF. Furthermore, the effects of gender, age, level of education and living environment on their experiences about DF andfibre-rich foods were investi-gated in 293 adults from different cities located in different geographical regions of Turkey.
2 Materials and methods
2.1 Instrument
The instrument in this study was a questionnaire of self -report response, designed to collect information on knowledge about DF. This measuring instrument consists of several sections aimed at obtaining information about different topics. The questionnaire was developed, tested and validated by the competent authorities(The Nacional Centre for Human Studies). The questions present in different sections of the instrument are as follows:
Section A. Demographics: Age/gender/education/ living environment/nearest city.
Section B. Consuming habits (open questions):
How many meals that include vegetables and/or salads do you have in a week? How many pieces of fruit do you eat per week? How often do you eat outside from home per week? How many times a week do you eat fast food? How many times a week do you eat whole grains (whole-wheat bread, whole-wheat pasta)?
Section C. Food labelling (Scale: 1 = never, 2 = rarely, 3= sometimes, 4 = many times, 5 = always): When buying a food product, I usually consult the label information. On the label, I usually consult the nutri -tional information. In the nutri-tional label of any food, I usually check how much fibre it possesses. The amount offibres is a factor to be taken into account in the choice of similar foods. If I buy a food product where the packaging refers to “high fibre” or “high in fibre,” I check the label for the amount offibre it has.
Section D. Dietary fibres and foods (Scale: 1 = strongly disagree, 2 = disagree, 3 = neither agree nor disagree, 4= agree, 5 = strongly agree): Only plant foods havefibre. According to the World Health Organization, the average adult should eat 25 g offibre per day. Dietary fibres are classified into soluble and insoluble. Dietary fibres have calories, and so they provide energy to the organism when ingested. Legumes (peas and beans.), cereals and fruits are foods that are very rich in dietary fibre.
Section E. Dietary fibres and health (Scale: 1 = strongly disagree, 2 = disagree, 3 = neither agree nor disagree, 4 = agree, 5 = strongly agree): Eating dietary fibres in appropriate amounts can prevent and/or treat diseases. Fibres can prevent and/or treat cardiovascular diseases. Fibres can prevent and/or treat cholesterol. Fibres can prevent and/or treat bowel cancer. Fibres can prevent and/or treat obesity. Fibres can prevent and/or treat breast cancer. Fibres can prevent and/or treat constipation. Fibres can prevent and/or treat diabetes.
2.2 Data collection
The participation in the survey was voluntary, and the participants, adults only, were enquired by direct inter -view after verbal informed consent. The participants were chosen in an attempt to represent different sectors of the population, including different ages, education levels, genders or living environment. The participants were recruited by convenience, and the collection of the
data occurred between January and May 2017. All the questionnaires were answered without personal identi -fication to preserve the participants’ identity. The design and the application of the questionnaire followed the necessary ethical principles. Of the 300 questionnaires answered, 293 were considered as valid for the develop -ment of this study. This rejection was due to incomplete questionnaires that are not useful to be included in the study.
2.3 Statistical analysis
For the analysis of the data, basic descriptive statistics was used, complemented with nonparametric tests for the assessment of differences between the quantitative vari-ables among groups. U-Mann Whitney (UMW) was used for comparisons between two groups, and Kruskal–Wallis (KW) was used for comparisons between three or more groups. The non-parametric tests were used instead of the corresponding parametric tests(ANOVA or T-test) due to the lack of homogeneity between the groups.
The level of knowledge was grouped into two variables (knowledge about dietary fibres and foods [KDFF] and knowledge about dietary fibres and health effects (KDFHE), and these were subjected to a tree classification analysis for evaluation of the relative importance of each of the possible influential variables: age group, level of education, gender or living environ -ment. The analysis followed the Classification and Regression Trees(CRT) algorithm with cross validation, and the minimum number of cases considered for parent or child nodes was 20 and 10, respectively. The software SPSS from IBM Inc.(version 22) was used to perform the data analysis, with a level of significance of 5%.
2.4 Sample characterization
This study included 293 participants residing in Turkey, of which 48.5% were female and 51.5% were male. The age varied between 18 and 71 years, with average of 34.8 ± 12.7 years. The average age of the female participants was lower than that of the male participants(31.0 ± 11.0 and 38.4± 13.1 years, respectively). The variable age was classi-fied into the following categories: young adults, 18–30 years, accounting for 43.0%; average adults, 31–50 years, representing 45.1%; senior adults, 51–65 years, corre-sponding to 10.6%; elderly, 66 or older, representing 1.4%.
The participants were from different cities of Turkey, the majority being from Ankara, 27%, followed by Bolu, 15%, and then Isparta, 10%, while 48% from other cities. Regarding the living environment, only 8.5% resided in rural environments.
The majority of the participants had a high level of education(87.0% with a university degree), while 10.6% had competed secondary school and just a minor portion (2.4%) had the lowest level of education (primary school). The proportion of women participants with university degree was higher than that of men with the same level of education (91.5% vs 82.8%), and so the sample of enquired women was slightly more educated than men.
3 Results and discussion
3.1 Consuming habits
Social and demographic characteristics are potential determinants of food acceptance(Verbeke, 2005). Thus, the study of the eating habits could be related with several intrinsic factors of the respondents, such as age, gender, level of education and living environment.
The average numbers of occurrences by week, considering the eating habits of the participants, were presented in Table 1. Generally, during the week, there were some participants who did not eat vegetables, fruits, whole grains or fast food, and never eat outside
home (minimum value of 0). The consumption of
vegetables and fruits presented maximum values for fruits (40) and vegetables (30), followed by the whole grains (21), with a total average of 10.6, 7.6 and 4.0, respectively. The results also indicated that Turkish participants eat vegetables and fruits in average of 7.6 and 10.6 times a week, meaning once a day for fruits and vegetables, which was quite few. These values and tendencies were in agreement with the results found by Guiné et al. (2016a). The recommended consumption portions are 3.5–6.5 cups of fruits and vegetables per day for adults, depending on several factors such as age, gender and level of physical activity (USDHHS/USDA 2015, 2010), but the results from our samples are way below these recommendations. On the other hand, according to Nepal et al. (2011), people of higher socioeconomic classes had healthier and nutritionally more balanced diets, with high consumption of fruits and vegetables, than those of lower socioeconomic classes.
However, in our study, only the education factor was considered, and the results suggested no significant differences in the consumption of fruits and vegetables according to the level of education. Furthermore, diets rich in DF certainly consist of fruit and vegetables, and they also include other bioactive components such as vitamins, minerals and phenolic compounds that improve the human health benefits (Ajila and Rao 2013). Although this kind of information would be expected to increase consumption of fruits and vegetables in more educated people, our results did not confirm that assumption. Moreover, the tendency for whole grains consumption was similar for all the tested variables, with no statistically significant differences, and the total average was four portions a week, which was a low nutritional intake. Although in our work no differences were found for the consumption of whole grains between women and men, it was reported by other authors that in Poland women were more willing to eat whole grain products than men (Jeżewska-Zychowic and Królak 2015), and these differences might be due to cultural or social differences between the countries involved. According to a survey elaborated by Nielsen(2005), only 38% of the
Europeans regularly consumed whole grain products and high-fibre products (Nielsen 2005). Also, about 29% of them believed that high-fibre products offered additional
health benefits as they claimed, and 12% of them
mentioned that those products were very expensive (Nielsen 2005). These results indicate that also in Europe the consumption of whole grain products is low, like it was verified for the Turkish participating in the present survey.
The consumption of vegetables and fruits generally increased with age. It was obvious that consumption of whole grains was the only parameter that was indepen -dent of the participant’s age (p ≤ 0.05), meaning that all participants consumed similar amounts of whole grain foods compared to other foods, where the age influenced the consumption habits. Furthermore, the young indivi -duals preferred to eat more often fast food meals compared to the elderly group that did not prefer to eat any.
Both genders consumed fruits more frequently followed by vegetables; however, the males substantially preferred to eat more quantity of fruits. Some researchers found that women consumed more fruits than men
Table 1: Eating habits of the participants(average number of occurrences/week)
Vegetables Fruits Whole grains Meals out of home Fast food meals
Minimum value 0 0 0 0 0
Maximum value 30 40 21 14 12
Variables Mean± SDa Mean± SDa Mean± SDa Mean± SDa Mean± SDa Ageb Young adults 6.7± 4.5 9.8± 7.3 3.7± 4.0 3.1± 2.7 2.3± 2.3 Average adults 8.6± 5.7 10.6± 6.6 4.4± 3.8 1.6± 1.8 1.0± 1.4 Senior adults 7.3± 4.3 13.5± 8.6 3.9± 3.2 1.1± 1.7 0.5± 1.0 Elderly 11.25± 7.9 14.0± 10.8 4.3± 3.0 0.8± 1.5 0.0± 0.0 KW test, p-valuec 0.025 0.048 0.245 0.019 0.000 Gender Female 8.0± 5.2 9.5± 6.4 3.8± 3.4 2.3± 2.3 1.8± 2.3 Male 6.5± 5.1 11.6± 7.9 4.2± 4.2 2.3± 2.4 1.2± 1.6 UMW test, p-valued
0.112 0.019 0.291 0.053 0.019 Level of education Primary 7.6± 7.1 9.6± 3.2 2.6± 2.5 0.7± 1.1 0.0± 0.0 Secondary 7.3± 5.8 10.0± 5.4 3.5± 2.9 1.5± 2.2 1.0± 1.7 University 7.7± 5.1 10.7± 7.6 4.1± 3.9 2.3± 2.4 1.5± 2.0 KW test, p-valuec 0.323 0.944 0.591 0.002 0.001 Living environment Rural 7.5± 4.8 13.3± 8.5 4.4± 4.3 1.3± 1.4 1.1± 1.4 Urban 7.7± 5.2 10.3± 7.1 4.0± 3.8 2.3± 2.4 1.5± 2.0 UMW test, p-valued
0.444 0.025 0.361 0.029 0.131
Total 7.6± 5.2 10.6± 7.2 4.0± 3.8 2.2± 2.4 1.5± 2.0
aMean
± standard deviation.bYoung adults: 18
–30 years; average adults: 31–50 years, senior adults: 51–65 years; elderly: ≥66 years.cKW
(Azagba and Sharaf 2011, Nepal et al. 2011, Emanuel et al. 2012). Moreover, the participants preferred to eat out of home in average of 2.2 times a week, meaning a low incidence, and the women consumed fast food meals slightly more times than males. In fact, according to
Guiné et al. (2016a), men eat out of home more
frequently than women in a number of countries. Regarding consumption of fast food meals, in our study, women tend to eat fast food more frequently than men, and these results are contradictory with those from Driskell et al. (2006), according to which a lower
percentage of women (58%) when compared to men
(84%) consumed fast food for lunch at least once a week. These discrepancies could be explained by cultural and educational habits. According to several authors, a significant part of eating behaviour were based on habits, yielding evidence that it was the most powerful predictor of eating behaviour(van’t Riet et al. 2011).
The results presented in Table 1 also show that individuals with university level preferred to eat more often out of home(2.3 times a week) and had a higher number of fast food meals (average of 1.5 occurrences per week).
It was observed that the living environment did not influence the majority of the eating habits of the participants. However, the results showed that people living in urban areas preferred to eat out of home more frequently, when compared with people living in rural areas, probably due to the higher number of restaurants in the cities. According to the study accomplished by Guiné et al.(2016a), it was reported that Turkish people preferred to eat less out of home when compared with the people from other countries, such as Italy, Hungary and Latvia, but not more than people from Macedonia and Romania who just preferred to eat out of home once a week.
3.2 Attitudes regarding food labelling
Packaging labels, which are a key source for consumers, provides useful information about nutritional content and safety of foods. They play an important role in consumer protection (Rimpeekool et al. 2015). Further-more, manufacturers and retailers should provide easy -to-understand and clear nutritional information to consumers for their health(Nielsen 2015) because food labelling has a prominent role for communication between the producer and retailer on one hand and the purchaser and consumer on the other hand(WHO 2007).
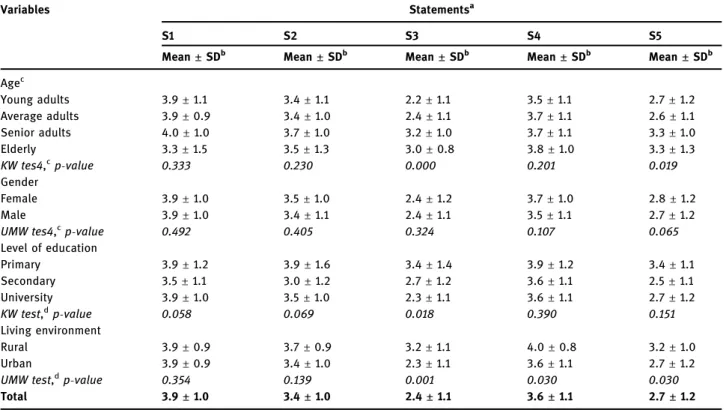
Table 2 shows that the Turkish consumers read the labels while purchasing their food, since the obtained score(3.9) was close to 4.0 (many times). These results are in accordance with a survey undertaken in 2004 by Nielsen Global Health & Wellness in different countries, which showed that 75% of the participants carefully read packaging labels(Nielsen 2005). In this study, the participants mildly considered the nutritional informa -tion and the quantity of fibre in chosen food, with average scores of 3.4 and 3.6, respectively. The respondents rarely confirmed the fibre content men-tioned in the label when the packages announce “fibre-rich” food (2.7). However, people older than 51 years tended to check more often thefibre content of the food products, even if the package announces “fibre rich” (3.3). It was also determined that the amount of fibre was taken into account by people from rural areas when they had to choose similar products(3.2). This could be explained by a desire of rural societies to maintain and practice a healthy diet in daily life. It was reported that people having healthy diets considered the amount of fibres present while making food choices, and they also revealed a responsible attitude of verifying any claims advertised in the label (Guiné et al. 2014). It was also reported that the participants living in urban areas tended to pay more attention to food labels(Guiné et al.
2016a). Same authors indicated that the Turkish
participants presented the highest interest for food labelling, when compared to other countries, such as Macedonia. In our study, the differences between the genders were not statistically significant for all aspects investigated, including nutrition information and amount of DF. These results prove that the attitudes towards food labelling are relatively similar among the different sectors of the Turkish population, indicating that other factors not investigated might determine food labelling attitudes. The nature of the guidance onfibre provided by manufacturers’ use of front-of-package references on food in Canadian supermarkets was evaluated by Sacco et al. (2013). They reported that front-of-package references to fibre were found on 6% of all foods; high-fibre foods mostly had no front-of-package references to thefibre. They also indicated that consumers may be faced with challenges in seeking out healthful sources of fibre, given the complexity of existing front-of-package nutrition-related marketing and limited references to fibre in some categories. Their work suggested that current nutrition-related marketing cannot replace nutrition education (Sacco et al. 2013).
3.3 Knowledge about dietary
fibres and
variety of foods
The knowledge about DF and food(KDFF) sources was assessed through questions in group D entitled as Dietary Fibres & Foods as shown previously. This group comprised five questions classified from 1 = strongly disagree to 5 = strongly agree. To measure the overall knowledge, a new variable was created, KDFF, corre -sponding to the sum of the scores for all questions, thus varying on a scale from 5 to 25, in which the middle of the scale, 15, corresponded to no opinion(neither agree nor disagree). Hence, this variable was established as corresponding to categories of knowledge as follows: 5–9 = very low knowledge; 10–14 = low knowledge; 15 = no opinion; 16–20 = high knowledge; 21–25 = very high knowledge.
The statistical results considering the measure of the general degree of KDFF were presented in Table 3. In general, the Turkish respondents showed a high KDFF sources, with a total value of 17.5. It was likely detected
that there were no significant differences among
age, gender, level of education and living environment
(p > 0.05). Moreover, the results obtained for the level of KDFF showed that only 1.4% of the participants had a very low level of knowledge, 10.4% revealed a low knowledge, 10.0% had no opinion, while the majority, 65.7%, had a high level of knowledge and 12.5% had a very high knowledge. These results were in accordance with the studies carried out on Portuguese(Guiné et al. 2014) and Hungarian (Szűcs et al. 2016) populations. In addition, in a general overview, in a study accomplished in different countries, the results showed that the participants revealed on average a positive but still low global level of knowledge about DF(Guiné et al. 2016b). A total of 12.5% participants showed a very high KDFF (aged between 21 and 25 years), and these were characterized by being mostly average adults (61.1%, aged between 31 and 50 years), with a university degree (91.7%), residing in urban areas (86.1%) and equally
distributed between genders (50.0% for each). As
another outcome of the study, there were participants with a very low KDFF(between 5 and 9), corresponding to only 1.4% of participants: 75% men and 25% woman, 50% were young adults and the other 50% were average adults, 25% had secondary education level compared to
Table 2: Habits towards labelling
Variables Statementsa
S1 S2 S3 S4 S5
Mean± SDb Mean± SDb Mean± SDb Mean± SDb Mean± SDb Agec Young adults 3.9± 1.1 3.4± 1.1 2.2± 1.1 3.5± 1.1 2.7± 1.2 Average adults 3.9± 0.9 3.4± 1.0 2.4± 1.1 3.7± 1.1 2.6± 1.1 Senior adults 4.0± 1.0 3.7± 1.0 3.2± 1.0 3.7± 1.1 3.3± 1.0 Elderly 3.3± 1.5 3.5± 1.3 3.0± 0.8 3.8± 1.0 3.3± 1.3 KW tes4,c p-value 0.333 0.230 0.000 0.201 0.019 Gender Female 3.9± 1.0 3.5± 1.0 2.4± 1.2 3.7± 1.0 2.8± 1.2 Male 3.9± 1.0 3.4± 1.1 2.4± 1.1 3.5± 1.1 2.7± 1.2 UMW tes4,c p-value 0.492 0.405 0.324 0.107 0.065 Level of education Primary 3.9± 1.2 3.9± 1.6 3.4± 1.4 3.9± 1.2 3.4± 1.1 Secondary 3.5± 1.1 3.0± 1.2 2.7± 1.2 3.6± 1.1 2.5± 1.1 University 3.9± 1.0 3.5± 1.0 2.3± 1.1 3.6± 1.1 2.7± 1.2 KW test,dp-value 0.058 0.069 0.018 0.390 0.151 Living environment Rural 3.9± 0.9 3.7± 0.9 3.2± 1.1 4.0± 0.8 3.2± 1.0 Urban 3.9± 0.9 3.4± 1.0 2.3± 1.1 3.6± 1.1 2.7± 1.2
UMW test,dp-value 0.354 0.139 0.001 0.030 0.030
Total 3.9± 1.0 3.4± 1.0 2.4± 1.1 3.6± 1.1 2.7± 1.2
a
S1: When I buy a food, I always see the label; S2: On the label, I see the nutritional information; S3: I check thefibre content of the food; S4: The quantity offibre conditions my food choices; S5: When I see “fibre rich” on the package I confirm the fibre content.bMean
± standard deviation(scale: 1 = never, 2 = rarely, 3 = sometimes, 4 = many times, 5 = always)cYoung adults: 18–30 years; average adults: 31–50 years, senior adults: 51–65 years; elderly: ≥66 years.dStatistical tests: KW
75% who had a university degree and all lived in urban areas. The participants with no opinion represented 10.0% and were mostly young adults (62.1%), with a university degree(72.4%), living in urban environments (96.6%) and of the male gender (62.1%).
3.4 KDFHEs
The KDFHEs was assessed through questions in group E entitled as Dietary Fibres & Health as shown previously. This group contained eight questions evaluated from 1= strongly disagree to 5= strongly agree. To measure the overall knowledge, another variable called KDFHE was created. KDFHE was the sum of the scores for all questions, and thus, it varied on a scale from 8 to 40, in which the middle of the scale was 24 that corresponded to no opinion (neither agree nor disagree). Consequently, this variable was established as corresponding to cate -gories of knowledge in the following scale: 8–15 = very low knowledge; 16–23 = low knowledge; 24 = no opinion; 25–32 = high knowledge; 33–40 = very high knowledge.
The overall perception was that the responders presented high KDFHE score(30.6, Table 3). The living environment did not significantly influence the KDFHE (p > 0.05). Persons having secondary education level exhibited the lowest level of KDFHE score(27.5) compared to the ones with primary and university education levels(33.2 and 31.0, respectively). Thus, it can be seen that a high level of education was not strictly connected with KDFHE. The statistical results also revealed that the elderly persons presented high KDFHE score(32.0), and the female group exhibited better perception of the importance of consumption of DF for their health(31.4 score). Thesefindings can be supported with the results of a study reporting that women were significantly better informed about the nutritive value of foods than men(Chourdakis et al. 2010). It was also concluded that in spite of the Portuguese people presenting a general conscience about the benefits associated with an adequate fibre intake, there was a difference between genders, like women being more informed than men(Guiné et al. 2014). This study shows that Turkish men and young population could also be educated about adequatefibre intake because DF plays an important role in their daily diet for preventing the risks of certain diseases.
It was further noticed that regarding the level of KDFHE, only 0.7% of the participants revealed a very low level of knowledge, 3.1% revealed a low knowledge, 6.3% had no opinion and 59.1% had a high level of knowledge and 30.8% had a very high knowledge. These results proved that people were apparently aware of the benefits of DF for their
well-being. Moreover, the number of participants having high or very high KDFHE scores(over 25) was 257, and those were principally young adults (44.0%) or average adults (45.9%), having university degree (89.5%), living in urban environments (91.4%) and almost equally distributed be-tween genders(50.6% for female and 49.4% for male).
3.5 Classi
fication of predicting factors
a
ffecting knowledge
The two variables accounting for knowledge (KDFF and KDFHE) were subject to a tree classification analysis by
Table 3: Measurement of the General Level of Knowledge
Variable KDFFa KDFHEb
Mean± SDc Mean
± SDd
Age
Young adults(18–30 years) 17.2± 2.7 29.9± 4.3 Average adults(31–50 years) 17.9± 2.9 31.7± 4.9 Senior adults(51–65 years) 17.1± 2.5 29.5± 4.8 Elderly(≥66 years) 19.3± 2.5 32.0± 8.0 KW test,e p-value 0.062 0.002 Gender Female 17.8± 2.5 31.4± 4.3 Male 17.3± 3.0 30.0± 5.1 UMW test,e p-value 0.055 0.009 Level of education Primary 18.2± 2.2 33.2± 4.8 Secondary 17.0± 2.2 27.5± 5.3 University 17.6± 2.8 31.0± 4.5 KW test,e p-value 0.100 0.003 Living environment Rural 18.3± 2.8 29.5± 4.5 Urban 17.5± 2.8 30.8± 4.8 UMW test,e p-value 0.132 0.070 Total 17.5± 2.9 30.6± 4.7 Level of knowledgef,g Very low 1.4% 0.7% Low 10.4% 3.1% No opinion 10.0% 6.3% High 65.7% 59.1% Very high 12.5% 30.8% Total 100.0% 100.0%
aKDFF: knowledge about dietaryfibre and foods.bKDFHE: knowl
-edge about dietary fibre and health effects. cMean
± standard deviation; scale from 5 to 25.dMean± standard deviation; scale
from 8 to 40. eStatistical tests: KW = Kruskal–Wallis, UMW = U-Mann–Whitney.fClasses of knowledge for variable KDFF: very low
(5–9 points), Low (10–14 points), no opinion (15 points), high (16–20 points), very high (21–25 points).gClasses of knowledge for
variable KDFHE: very low (8–15 points), low (16–23 points), no opinion(24 points), high (25–32 points), very high (33–40 points).
CRT algorithm, which searched for all possible variables and all possible values to find the best split—the question that splits the data into two parts with maximum homogeneity (see Figures 1 and 2). Figure 1
shows that that the best predictor for KDFF was gender, followed by living environment for the women or education for the men. This classification tree had an estimated risk of 0.343 with standard error of 0.028 for
resubstitution, and for cross-validation, the values were 0.346 and 0.028, respectively, for risk estimate and standard error. For the men having university degree,
the next predictor was living environment, and the age group had only prediction importance for the men having university degree and living in urban areas.
Figure 1 shows that 65.7% of the participants were in the high category; 72.3% of the females (48.8% of the population) were in the high knowledge category; and 74.6% of the females living in urban area (45% of the females) were in the high knowledge category. The
males (51.2% of the population) having secondary
education and lower level (9.0%) had a high category with the population rate of 53.8%; 90% of the males living in rural areas and having university degree were in the high category. Furthermore, 62.5% of the men living in urban areas belonging to the age groups >1 (older than 30 years) were in the high category in terms of KDFF variable.
The analysed results in terms of KDFHE variable were presented in Figure 2. This classification tree had an estimated risk of 0.399 with standard error of 0.029 for resubstitution, and for cross-validation, the values were 0.437 and 0.029, respectively, for risk estimate and standard error. The best predictor was age group that differentiated the young adults from the other age groups. For the young adults, the next predictor was gender, while for the other age groups, age differentiation continued in the subsequent level, and the gender was a predictor only for average adults. This variable was not significantly influenced by the living environment. The participants(59.1% of the population) were in the high category of KDFHE variable. This was stickily related with the age factor. Indeed, 70.1% of the young females were in the high category of KDFHE variable when compared with 63.8% of the young males. However, when the age of participants was more than 30 years(>1.0), 60.6% of the participants older than 51 years(>2.0) were in the high category and 48.3% of the females with age group of≤2 (average adults) were in very high category of KDFHE, while 35.2% of the males were in very high category in terms of KDFHE variable(see Figure 2).
4 Conclusions
This study showed that in the Turkish participants, the consumption of vegetables, fruits and whole grains was way below the recommended levels. This alerts for the need of better nutritional information to stimulate the people to consume healthier foods in the recommended quantities. However, eating habits of Turkish participants verified that they tended to eat out of home few times or have fast food with a low incidence. It could be potentially an indicator of their tendency for eating high-quality meals. The results further showed that Turkish participants tended to pay some
attention to food labelling in relation to aspects, like consulting to the label, reading the nutritional information or the amounts of DF, which determine their purchasing choices. However, they were not careful to verify the amount of DF in foods that were marketed asfibre-rich products. The level of knowledge about DF and variety of foods was high in the general population, as well as the level of knowledge about the benefits of an adequate consumption of fibre for health. Finally, the classification analysis revealed that gender was the major discriminant for the KDFFs, while the most important discriminant for the knowledge about the health benefits of DF was age.
The importance of an adequate diet to maintain health is well described in many scientific reports, and DFs are fundamental to a healthy life style. Thus, the findings of this study are essential to promote and implement interventions that effectively contribute to a better knowledge about the important role of DF and therefore to healthier eating habits.
Acknowledgments: This work was funded by National Funds through the FCT– Foundation for Science and Technology, I.P., within the scope of the project Refª UIDB/00681/2020. Furthermore, we would like to thank the CERNAS Research Centre and the Polytechnic Institute of Viseu for their support. This work was prepared in the ambit of the multinational project from CI&DETS Research Centre (IPV – Viseu, Portugal) with reference PROJ/CI&DETS/2014/0001.
Conflict of interest: The authors declare no conflict of interest.
References
[1] Ajila CM, Rao UJSP. Mango peel dietary fibre: composition and associated bound phenolics. J Funct Foods. 2013;5:444–50. doi: 10.1016/j.jff.2012.11.017.
[2] Azagba S, Sharaf MF. Disparities in the frequency of fruit and vegetable consumption by socio-demographic and lifestyle characteristics in Canada. Nutr J. 2011;10:118. doi: 10.1186/ 1475-2891-10-118.
[3] Brennan CS. Dietary fibre, glycaemic response, and diabetes. Mol Nutr Food Res. 2005;49:560–70. doi: 10.1002/
mnfr.200500025.
[4] Charalampopoulos D, Wang R, Pandiella SS, Webb C. Application of cereals and cereal components in functional foods: a review. Int J Food Microbiol Notermans Spec Issue. 2002;79:131–41. doi: 10.1016/S0168-1605(02)00187-3. [5] Chourdakis M, Tzellos T, Papazisis G, Toulis K, Kouvelas D.
medical students in northern Greece. Appetite. 2010;55:722–5. doi: 10.1016/j.appet.2010.08.013.
[6] Conlon MA, Bird AR. The impact of diet and lifestyle on gut microbiota and human health. Nutrients. 2014;7:17–44. doi: 10.3390/nu7010017.
[7] Driskell JA, Meckna BR, Scales NE. Differences exist in the eating habits of university men and women at fast-food restaurants. Nutr Res. 2006;26:524–30. doi: 10.1016/ j.nutres.2006.09.003.
[8] Emanuel AS, McCully SN, Gallagher KM, Updegraff JA. Theory of planned behavior explains gender difference in fruit and vegetable consumption. Appetite. 2012;59:693–7. doi: 10.1016/j.appet.2012.08.007.
[9] EU. REGULATION (EU) No 1169/2011 of the European Parliament and of the Council of 25 October 2011. Official J Eur Union. 2011;L304:18–63.
[10] Guiné R, Martinho C, Barroca MJ, Viseu C. Knowledge and attitudes regarding dietaryfibres: a consumer survey in Portuguese population. J Basic Appl Res Int. 2014;1:1–12. [11] Guiné RPF, Duarte J, Ferreira M, Correia P, Leal M, Rumbak I,
et al. Attitudes towards dietaryfibre on a multicultural basis: a fibre study framework. Curr Nutr Food Sci. 2016a;12:132–41. doi: 10.2174/157340131202160412171430.
[12] Guiné RPF, Ferreira M, Correia P, Duarte J, Leal M, Rumbak I, et al. Knowledge about dietaryfibre: a fibre study framework. Int J Food Sci Nutr. 2016b;67:707–14. doi: 10.1080/ 09637486.2016.1191443.
[13] Jeżewska-Zychowic M, Królak M. Do consumers' attitudes towardsfood technologies and motives of food choice influence willigness to eat cereal products fortified with fibre? Polish J Food Nutr Sci. 2015;65:281–91. doi: 10.2478/pjfns-2013-0014.
[14] Nepal VP, Mgbere O, Banerjee D, Arafat RR. Disparities in fruits and vegetables consumption in houston, Texas: implications for health promotion. J Prim Care Community Health. 2011;2:142–7. doi: 10.1177/2150131911399446. [15] Nielsen, Functional Food & Organics. A global ACNielsen
online survey on consumer behaviour & attitudes. Australia: ACNielsen Company; 2005.
[16] Nielsen NV. We are what we eat: healthy eating trends around the world. New York, USA: The Nielsen Company; 2015. [17] Redgwell RJ, Fischer M. Dietary fiber as a versatile food
component: an industrial perspective. Mol Nutr Food Res. 2005;49:521–35. doi: 10.1002/mnfr.200500028.
[18] Rimpeekool W, Seubsman S, Banwell C, Kirk M,
Yiengprugsawan V, Sleigh A. Food and nutrition labelling in Thailand: a long march from subsistence producers to international traders. Food Policy. 2015;56:59–66. doi: 10.1016/j.foodpol.2015.07.011.
[19] Sacco JE, Sumanac D, Tarasuk V. Front-of-package references tofiber on foods in canadian supermarkets highlight the need for increased nutrition knowledge among consumers. J Nutr Educ Behav. 2013;45:518–24. doi: 10.1016/ j.jneb.2013.02.003.
[20] Szűcs V, Fazakas Z, Tarcea M, Guiné R. Consumers knowledge about dietaryfibre – results of a survey questionnaire in Hungary and Romania. Acta Alimentaria. 2016;45:469–76. doi: 10.1556/066.2016.45.4.2.
[21] Tungland BC, Meyer D. Nondigestible oligo- and polysac-charides(dietary fiber): their physiology and role in human health and food. Comprehens Rev Food Sci Food Safety. 2002;1:90–109. doi: 10.1111/j.1541-4337.2002.tb00009.x. [22] USDHHS/USDA. Dietary Guidelines for Americans 2010, 7th
ed. USA: U.S. Dep. of Health and Human Services & U. S. Dep. Agriculture; 2010.
[23] USDHHS/USDA. Dietary Guidelines for Americans 2015–2020, 8th ed. USA: US Dep. of Health and Human Services & U. S. Dep. Agriculture; 2015.
[24] van’t Riet J, Sijtsema SJ, Dagevos H, De Bruijn GJ. The importance of habits in eating behaviour. An overview and recommendations for future research. Appetite. 2011;57: 585–96. doi: 10.1016/j.appet.2011.07.010.
[25] Verbeke W. Consumer acceptance of functional foods: socio-demographic, cognitive and attitudinal determinants. Food Qual Prefer. 2005;16:45–57. doi: 10.1016/
j.foodqual.2004.01.001.
[26] WHO. Codex Alimentarius: Food Labelling, 5th ed. Rome, Italy: World Health Organization; 2007.