A Work Project, presented as part of the requirements for the Award of a Masters Degree in Finance from the NOVA – School of Business and Economics.
The Impact of Large-Scale Mortgage Backed Security Purchases
Maria Inês Rocha Abecasis 470
A project carried out on the Financial Markets major under the supervision of: Professor André C. Silva
2 Abstract
I analyze the impact that large-scale Mortgage Backed Securities (MBS) purchases carried by the Federal Reserve in response to the financial crisis had in the economy and find that they were able to enhance confidence in financial markets and influence MBS pricing. Default probabilities of financial companies fell 33 basis points, which can be explained by the lower quantity of MBS in their balance sheets and the increased value of the MBS remaining in their asset side. The default risk premium of MBS decreased 66 basis points, which represents 22% of the reduction in MBS yields in the period analyzed.
3 I. Introduction
In this project I analyze the impact that the large-scale Mortgage Backed Securities (MBS) purchases, also known as Quantitative Easing, had on the economy. More specifically, my objective is to analyze two channels for this impact that are directly related to the type of asset purchased by the Federal Reserve. These channels, on which I focus my analysis, are the impact of Quantitative Easing on MBS pricing and on the capability of Quantitative Easing to restore confidence on financial markets.
Since confidence in financial markets was low due to the financial crisis, default risk of companies operating in this sector increased. The poor quality of some MBS also increased concerns over the value of financial companies. Through the purchases of MBS, which increased the value of MBS and removed part of the MBS from the asset side of the investors, the Federal Reserve reduced default risk of companies operating in the financial sector. Following an event study approach, and estimating default probabilities for a large sample of companies, I find that Quantitative Easing improved conditions in financial markets, decreasing three year default probabilities by 37 bps.
To study the impact of Quantitative Easing on MBS pricing, I remove the effects of variations in prepayment and default risks. The first is analyzed based on Bloomberg Mortgage Market insights and default risk is measured with the spread between Fannie Mae debt and U.S. Treasury securities. I find that purchases of MBS contribute through a default risk premium channel to a reduction of 66 bps in MBS yields. Evidence in support of the existence of a prepayment risk premium channel is also found.
The Work Project is structured as follows: section II states the research that has been done to analyze the impacts of MBS purchases; section III presents the methodology that I propose to follow; section IV analyzes the data and section V concludes.
4 II. Literature review
Disruptions in MBS markets contributed to the severity of the financial crisis. On a report developed by the U.S. Senate Permanent Subcommittee on Investigations (2011), high risk mortgage lending is one of the factors causing the crisis. Brunnermeier (2009) explains how losses on mortgages markets amplified into the financial crisis, suggesting that funding (ability to borrow, using assets as collateral) and market liquidity (ability to sell those assets) were worsening, due to loss spirals on MBS portfolios. Brunnermeier (2009) further suggests that maturity mismatch between assets and liabilities, with several banks recurring to short term funding, amplified the negative outcomes of the crisis to companies, which were not able to refinance their short-term liabilities.
In 2008 the Federal Reserve announced it would purchase agency MBS, in order to reduce “the cost and increase the availability of credit to the purchase of houses (…) and foster improved conditions in financial markets”1
. Several studies analyze the effect of these purchases. Krishnamurthy et al. (2011) study various channels through which the purchases affected long term interest rates and find evidence of the existence of a prepayment risk premium channel and a default risk channel. Their prepayment risk premium channel is based on a previous study by Gabaix et al. (2007), who found that the premium required for prepayment risk depends on the total risk borne by mortgage investors. Since purchases of MBS represented a large fraction of the total market for MBS, they were able to change the marginal investor and thus reduce prepayment risk.
Woodford (2012) questions the methodology used by Krishnamurthy et al. (2011), suggesting that the assumptions of, on one hand, market efficiency, needed to support an event-study approach, and of the existence of a segmented market, on the other hand,
1 http://www.federalreserve.gov/newsevents/press/monetary/20081125b.htm accessed on November 2,
5 needed to sustain the prepayment risk premium channel, are not compatible, arguing that MBS purchases only affected its yields due to disruptions in financial markets.
Stroebel et al. (2012) find little evidence of an impact of MBS purchases on yields. They estimate several regressions to quantify this impact and using the methodology that they considered more appropriate to account both for default and prepayment risk, MBS purchases caused a reduction of 8 bps in yields. The largest impact (-30 bps) is found when the effect on yields is assumed to be priced with the existence of the MBS purchase program, but, in this case, there is no evidence for a size effect of the program.
Mishkin (2011) provides evidence that shocks in the financial sector compromise the ability to fund productive investment opportunities, leading to downturns in the economy and suggests that monetary policy was able to control the negative effect of the financial crisis on the business cycle, reducing the severity of the recession.
III. Methodology
I study two channels through which MBS purchases may have affected the economy. I argue that the Federal Reserve was (i) able to reduce MBS default risk premium by 66 bps (22% of the total reduction in MBS yields from November 2008 to November 2009) and (ii) lower the default risk of financial companies by 33 bps, while default probabilities increased 9 bps in the period analyzed.
Following an event study approach, I study one day changes in the variables analyzed. The dates considered refer to the Federal Reserve’s initial announcement of its intent to purchase MBS, and subsequent FOMC statements2 where additional
2 The dates analyzed are November 25, 2008; December 16, 2008; January 28, 2009; March 18, 2009;
August 12, 2009; September 23, 2009 and November 4, 2009. These events are also considered in other studies (Krishnamurthy et al. study the first four dates and Gagnon et al. also include these dates on their baseline), which makes the results more comparable. I exclude the date of December 1st, 2008 (included in both studies) from the analysis, due to the fact that it was a Monday, which increases the window of analysis from one day to a weekend, and may introduce other events influencing the variables.
6 information concerning MBS purchases was provided. Even though this approach measures changes in expectations, measuring the actual impact in the economy is difficult because the economy experienced a great turbulence and even if the actions had a positive impact, it might not have been sufficiently large to offset other negative factors affecting the economy. Even so, I complement the analysis by considering larger time horizons. This is particularly important in assessing the impact of purchases in MBS prices. In fact, as Woodford (2012) refers, quantifying the impact of Federal Reserve measures as the cumulative movements in event days is consistent with the efficient market hypothesis, but not with the thesis that purchases affected prices through an increase in demand, which should not occur in an efficient market.
a. MBS pricing
I analyze changes in factors that affect MBS pricing, in order to assess whether the purchases played a relevant role in yields on event dates. Using a multifactor model to estimate MBS yields, the required return on a MBS can be estimated as follows:
Where,
is the yield to maturity on a MBS. is the risk free rate in the economy.
is the risk premium required for bearing the risk linked with .
is a factor affecting MBS pricing. The risk on MBS arises from two sources: prepayment risk ( ) and default risk ( ).
I expect MBS purchases to have a greater impact on longer term MBS, given that, until November 2009, 30 year MBS represented 96.8% of total MBS net purchases by the Federal Reserve. Therefore, I focus the analysis on these securities. I consider the
7 yields on MBS securities of each one of the three main issuers: Ginnie Mae, Freedie Mac and Fannie Mae and for each coupon3, I consider the average yield of the three.
MBS pricing depends on prepayments, which reduce their value to investors, as they reduce the interest that investors expect to receive, and they may not be able to reinvest the principal at the same rate, especially because prepayments usually occur when interest rates are low. In fact, Schwartz and Torous (1989), found that mortgage values were very sensitive to prepayment assumptions. Regressing variation in MBS yields on constant prepayment rates4 (CPR), evidence on support of this was also found: MBS value falls when prepayment rates increase. I analyze changes in prepayments through Conventional MBS monthly Prepayment Commentaries from Bloomberg Mortgage Market Insight. Given that for prepayment risk to affect MBS yields on a specific date what matters are surprise changes, I assess whether those changes occurred on the event dates. I analyze each month separately and when prepayments are higher than the ones predicted by analysts, I expect yields to rise on that month, due to prepayment risk; and vice versa. This channel has two possible ways of affecting prices, in particular:
Decreasing risk premiums: risk premiums may have increased beyond their normal levels, due to the financial crisis. Federal Reserve announcements, by reducing concerns over the MBS market, may have decreased the risk premiums back to their normal levels. This effect is compatible with the efficient market hypothesis and therefore expected to be priced in the event days.
Demand side effects: MBS purchases were designed to be large relative to the size of the market. This can lead to a price effect that can be explained through a
3
The MBS are the ones purchased by the Fed: 30 year MBS with coupons of 4.5; 5; 5.5; 6 and 6.5 (this sample includes almost all coupons purchased by the Fed until March 2009, except the 4 coupon 30 year MBS, to which data on Bloomberg was only available starting on the mid of December, 2008).
8 marginal pricing approach, as the marginal investor in the MBS market will expectedly change as the purchases are made. Gabaix et al. (2007) find that the prepayment risk premium on MBS depends on the quantity of risk held by investors and Krishnamurthy et al. (2011) suggest that MBS purchases reduced the prepayment risk held by investors and thus reduced the required risk premium. These effects may only be totally priced as the MBS are actually purchased, as they result from an increase in demand and should not occur in an efficient market. Therefore, and acknowledging that other factors may have affected MBS yields, I also analyze changes in yields over the entire period.
Default risk for Agency MBS results from the combination of defaults on underlying mortgages and the issuers not being able to fulfill their obligations (Stroebel et al., 2012). To measure default risk I adopt the measures suggested in Stroebel et al. (2012): the spreads between Fannie Mae bonds and U.S. Treasury securities and between Fannie Mae subordinated debt and U.S. Treasury securities5. Even though they suggest that using bonds to measure default risk may not be accurate, due to the Federal Reserve commitment to buy Agency bonds; I only found a statistically significant relationship between the spreads and MBS yields when using bonds. Furthermore, if I use 2009 data to estimate the impact of default risk on yields, the coefficients achieved using subordinated debt have signals contrary to the ones that would be expected. Therefore, I use both spreads to measure default risk changes and take into account that using bonds may overestimate decreases in default risk, as the purchases of Agency debt may reduce their yields. In my analysis, I consider the values of default risk impact
5
In particular, I consider, U.S Treasury bonds with 5 years to maturity (Bloomberg ticker: USGG5YR Index) and Fannie Mae subordinated debt maturing in 2013 (Bloomberg ticker: FNMA 4.625 10/01/2013 Corp and FNMA 4.625 10/09/2013 Corp). The spread between 5 year Fannie Mae bonds and U.S. Treasury securities is the FNMGVN5 Index.
9 on yields achieved using bonds more accurate, but in order to compare variations among event dates I use the values achieved with subordinated debt (see Table 3, in Appendix for the outputs of the regressions).
b. Default risk channel
Prior to the subprime crisis, the MBS market was one that represented an important income source for many of the companies which ignited the financial crisis: companies supported increasingly riskier loans, in order to increase their profits, introducing a great amount of risk into mortgage markets. In 2007, the subprime mortgage crisis irrupted, which was one of the factors leading to the financial crisis and contributing to the collapse of many companies.
On the FOMC statement announcing the purchases of MBS, one of the stated objectives of the program was to “foster improved conditions in financial markets”6
. The poor quality of some MBS issued and held by financial companies, which were deteriorating in value, was increasing concerns over the asset value of some financial companies. By purchasing MBS, the Federal Reserve might have been able to restore the confidence on financial markets: removing these assets from the investors’ Balance Sheet and increasing the value of the MBS remaining on the asset side of companies.
Therefore, the default risk channel will be relevant if the purchases were able to decrease default probabilities, and thus facilitate the return to a more functional market. I estimate the direct impact of Quantitative Easing on financial markets, by measuring default risk of companies operating in this sector. The companies being analyzed are all the companies operating in the financial sector that are included in the S&P1500 index for which information is available concerning credit ratings, prices and value of
6 http://www.federalreserve.gov/newsevents/press/monetary/20081125b.htm accessed on November 2,
10 liabilities7. The sample has a total of 134 companies. In the analysis, variations in probabilities of default are divided by the credit ratings of the companies. If the credit rating of a company changed during the months in study, the relevant credit rating is the one prevailing in the end of November 2009. Using panel data analysis, with the daily logarithms of the market capitalization of each financial firm, I also analyze the movements in the value of firms on event dates.
By restoring the confidence on financial markets, MBS purchases may have reduced the severity of the contraction. To test this, I complement the analysis studying variations in default risk of a broader set of companies. The companies analyzed are the ones in the S&P500 index that operate in sectors of the economy which I estimate to have greater sensitivities to market moves, measured by the beta. In particular the sectors considered are: information technology (β=1.25), materials (β=1.19) and energy (β=1.11). The sample has a total of 81 companies.
i. Measuring changes in default risk
The probability of default of each company is estimated assuming that returns of the asset value of the firm follow a normal distribution with ̂ and . A firm will default if the growth rate of its assets is smaller than the relative distance that the asset value of the firm is from its default point. This model is similar to the one used by Moody’s KMV Company in its estimates of default probability (Crosbie et al., 2003). The probability of default can then be estimated through the following expression:
( )
Where,
7 Credit ratings are S&P Long Term Credit Ratings from Compustat and were accessed through Wharton
11 is the probability of default of a given company;
is the cumulative normal distribution function; is the actual return of the asset value at time T;
is the asset value of the firm at time 0, which I assume to be equal to the sum of the market capitalization and the book value of debt;
are the liabilities payable at time T, known at time 0.
If we standardize the previous expression, the probability of default will be:
(
̂ √ )
Where,
̂ is the estimated volatility of the asset value of the firm, computed using five years of monthly data on stock prices;
is the time interval considered; is the expected return.
Assuming normality of the returns of a given company may not be very accurate. In fact, even though returns of large portfolios may present a distribution close to normal, the same does not apply for individual stocks. Another problem lies on the positive probabilities that get assigned to negative asset prices. Nonetheless, normality of returns is compatible with modern portfolio theory and is commonly used (for instance, the Black-Scholes model, used to price derivatives, assumes normality of the returns).
1. Time horizon
a. Short term default probability (1 year, 12 months)
As most financial companies did not have data on their current liabilities available, the short term default point is estimated as a ratio of total liabilities. In particular, I
12 consider two ratios: ¼ and ½. The bigger ratio is used to account for the fact that many companies operating in the financial sector were being financed with short term maturity instruments, which might have been difficult to refinance. On the short term, I assume that the asset value of the firm is not expected to grow. Therefore, .
b. Long term default probability (3 years, 36 months)
I assume long term liabilities to be half of the value of total liabilities. The is estimated using the CAPM, the risk free rate of the economy (3 month U.S. government bill8), the beta of the company, estimated with 5 years of monthly data, and the market premium, based on Fama and French (2002) estimates. The is given by:
ii. The yield curve as a leading indicator
The impact of Federal Reserve measures in the business cycle is also assessed following a model proposed by Estrella and Turbin (2006), who argue that the yield curve has a predictive power in what concerns future economic activity and propose the following equation to measure the probability of a recession 12 months ahead:
Where,
is the cumulative normal distribution function;
and are parameters of the regression. Estimates are available at the New York Federal Reserve website9 and are equal to -0.53 and -0.63, respectively;
is the spread between the 10 year T-bond and 3 month T-bill rates;
We have to take into account that long-term interest rates on treasuries may have been affected by MBS purchases. Even though most of the MBS purchased had
8 Source: Bloomberg (Ticker: USGG3M Index)
13 maturities of 30 years, while the long term rate considered has a maturity of 10 years, Krishnamurthy et al. (2011) suggest that duration of 30 year MBS is around 7 years. They argue that by reducing the market of long-term assets available to investors, MBS purchases may make some investors turn to other long-term assets, driving their prices up and lowering their yields, which might affect the estimates of the probability of a recession using the yield curve. However, given that this effect results from a decrease in the market for long term assets, it should only be priced as the purchases are actually made and not on event dates.
Given that the Federal Reserve announced on March its intention to purchase longer term Treasury Securities, I will only use this measure until the January event date.
IV. Impact of MBS purchases a. MBS pricing
i. Prepayment risk changes10
November: Even though prepayment rates fell, these changes were already projected to occur, and no surprise factor is present. However, 30 year 5s registered smaller prepayment rates than what analysts predicted, which may have contributed to decrease their yields. Therefore, changes in these MBS are not considered in November analysis. Even so yields fell in all the coupons analyzed with an average decrease of 39 bps. December: During this month, 30 year 6.5s prepayments remained unchanged or declined, due to difficulties in refinancing. Therefore, reductions in yields for these MBS may not be driven by lower risk premiums. Decreases on other MBS yields cannot be explained by lower prepayment expectations, given that prepayments increased during this month, as they were predicted to. However, analysts may have changed their
14 models11, to account for greater difficulties in refinancing mortgages and the consequent decrease in prepayment rates. This led estimates of 1 month CPR to fall for all coupons. However, changes in models do not seem to be playing a major role in the date analyzed, given that decreases in yields of higher coupon bonds, which suffered greater decreases in prepayment rates, are smaller than for other MBS. If I exclude MBS with 6.5 coupons from the analysis, yields fell on average 23 bps on 30 year MBS.
January: Prepayment rates increased significantly during January and were projected to increase further in the following month. In particular, unexpected significant increases in prepayments of newly originated mortgages may have contributed to an increase in yields. The combination of these factors may have counterbalanced the effect of reductions in risk premiums. The smaller increase in yields of 6.5 30 year MBS suggests that prepayment risk was the major source of variation on this date, given that higher coupon MBS were experiencing greater difficulties in refinancing and consequently lower prepayment rates. Thus, I exclude this date from the analysis.
March: Even though yields on all coupons fell, lower risk premiums cannot explain all declines: lower yields on 4.5 MBS may reflect the decline in prepayment rates of these bonds, when they were expected to increase. For other maturities, the decline in yields cannot be explained by changes in prepayment risk, which decreased less than anticipated by analysts during this month (it was expected to decrease 20-25% and decreased 1-2%). Hence, the decrease in MBS yields with coupons greater than 4.5 was driven by factors other than prepayment risk, leading to a decrease of 23 bps.
August: During this month, prepayment rates fell more than analysts had predicted. If this decrease was affecting MBS yields on the event dates, yields would have fallen,
11 Bloomberg, for instance announced on December 11, 2008 that it would update its prepayment model,
15 especially for lower coupon bonds. However, as yields increased for almost all MBS, prepayment risk factors do not seem to have played an important role on this event date. MBS yields increased on average by 3 bps.
September: Yields on all coupons fell slightly, except for MBS with 6.5 coupons, which increased 7 bps. Given that prepayment rates for lower coupon bonds decreased more than what analysts expected, prepayment risk changes may have affected yields on the day considered. Therefore, I do not include the September event date on the analysis. October12: Prepayment rates increased and were predicted to continue to rise. On the event date, yields decreased, suggesting that other factors influenced MBS yields. Even so, the variation in yields is very small, with yields decreasing on average by 1 bps. Over the entire period
Between November 2008 and March 2009, yields on 30 year MBS fell by 209 bps. If I exclude from the analysis 30 year MBS with 6.5 coupons, which prepayment risk decreased, due to greater difficulties in refinancing these type of mortgages and which purchases in November 2009 only represented 0.3% of total 30 year MBS net purchases by the Federal Reserve; 30 year MBS yields fell, on average, 229 bps. It is important to refer that this effect cannot be explained by lower prepayments, since prepayment rates actually increased between November 2008 and March 2009: CPR for 5s, 5.5s and 6s 30 year FNMA mortgages increased from 3.4%, 4.2% and 6.1% to 18.3%, 26.5% and 26.2%, respectively. Furthermore, higher coupon MBS yields fell less than those of lower coupon, which is consistent with the greater proportion of MBS with lower yields purchased by the Federal Reserve during this period (4, 4.5 and 5 MBS represented 81.4% of the net purchases of 30 year MBS by the Federal Reserve until March).
12 The November FOMC statement occurs on the beginning of the month, and therefore I assume that
16 The effect of the Federal Reserve posterior announcements on yields was minor, with variations in yields not exceeding 3 bps on event dates. Even though yields still fell 71 bps further until November 2009, this decrease may have been driven by lower prepayment rates: in fact, CPR for 5s 30 year FNMA mortgages decreased to 14% (relative to 18.3% in March 2009).
ii. Default risk changes
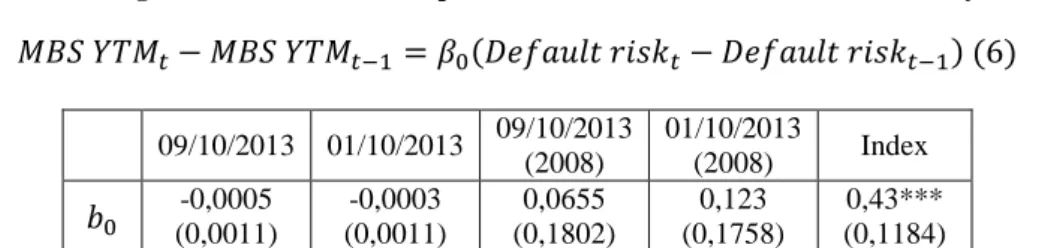
Default risk decreased on most of the event dates considered, which may have also contributed to lower MBS yields. The estimated regressions on the impact of default risk variations on the variation of MBS present, however, very small , suggesting that variations in default risk alone are not able to explain variations in yields (see Table 3, in Appendix). I adopt as measures of default risk the spread estimated using Fannie Mae bonds and the subordinated debt maturing on October 1, 2013, which presents a lower p-value than the regression estimated using the other subordinated debt. Based on the estimated regression, variations in MBS driven by default risk changes can be estimated, and the results are shown in the following section.
iii. Impact on MBS pricing
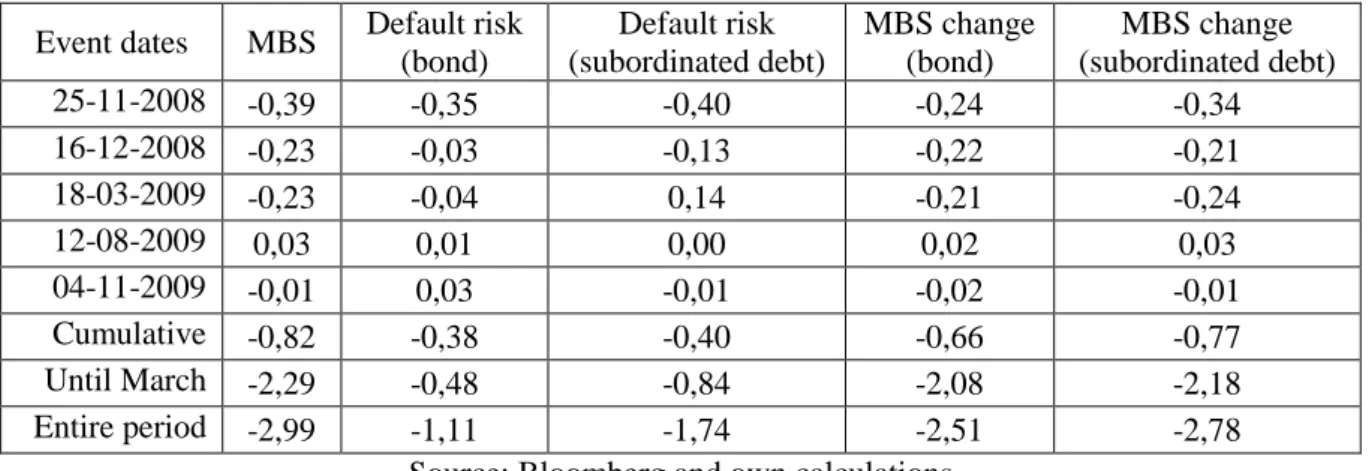
Table 1 summarizes the variation in MBS yields after accounting for the effect of prepayment and default risk changes. The second column incorporates the analysis on prepayment risk, showing the variation in MBS yields that were not influenced by prepayment risk variations, based on the analysis developed previously. The following two columns show the variations in default risk, measured as the spread of Fannie Mae corporate bonds and subordinated debt, respectively, with U.S. Government securities. The last two columns present the variations in yields after removing the effect of default risk changes, based on the equation estimated in Table 3, in Appendix.
17
Table 1: Variation in MBS yields on event dates
Event dates MBS Default risk (bond) Default risk (subordinated debt) MBS change (bond) MBS change (subordinated debt) 25-11-2008 -0,39 -0,35 -0,40 -0,24 -0,34 16-12-2008 -0,23 -0,03 -0,13 -0,22 -0,21 18-03-2009 -0,23 -0,04 0,14 -0,21 -0,24 12-08-2009 0,03 0,01 0,00 0,02 0,03 04-11-2009 -0,01 0,03 -0,01 -0,02 -0,01 Cumulative -0,82 -0,38 -0,40 -0,66 -0,77 Until March -2,29 -0,48 -0,84 -2,08 -2,18 Entire period -2,99 -1,11 -1,74 -2,51 -2,78
Source: Bloomberg and own calculations
Quantitative Easing was able to reduce MBS yields by 66 bps. This impact accounts for 22% of the variation in MBS yields during this period. The greatest decreases in MBS yields occurred on the first announcement days. Given that the subprime crisis that affected MBS was driven by loans with high risk of default, I believe that the default risk premium was the one decreasing the most on event dates. The prepayment risk premium channel, which, according to Gabaix et al (2007), depends on the total risk held by investors in MBS, is harder to quantify. By looking at Table 1, the decrease in MBS that cannot be explained by the default risk premium channel is of 85 bps and other factors may have affected MBS during this period. However, it has to be taken into consideration that prepayment risk actually increased in the period in analysis, especially until March 2009, and lower prepayment risk premiums might have contributed to counterbalance its effect on yields.
I confirm Stroebel et al. (2012) proposition that a decrease in default risk affected MBS yields. However, not all the decrease can be explained by lower default risk: even after accounting for the impact of default risk, yields still fell on event dates. The estimate of a 66 bps decrease in yields is above their 8 bps and 30 bps estimates. Evidence in support of the importance of the size of the purchases is also found. In fact,
18 the major decreases in MBS yields occurred when the Federal Reserve announced the MBS purchase program and when it increased the planned purchases. On the event dates following March only minor changes occurred on yields, which can be explained by the inexistence of changes on the quantity of planned MBS purchases.
Relative to Krishnamurthy et al. (2011), I add the effect of variations in default risk on MBS yields and suggest that default risk premium channel was the one affecting MBS yields on event dates, rather than the prepayment risk premium channel. Even though a prepayment risk premium channel can also have occurred, the actual impact of that channel is harder to quantify, because it should only be totally priced as the actual purchases are made. Furthermore, their estimates of MBS yields variations on event dates are greater than the values I found: considering the same event dates MBS yields fell by 125 bps, which is higher than the 94 bps decrease estimated here. This difference might be driven in part by different coupons of MBS considered in the samples.
b. Default risk channel
i. Default risk companies
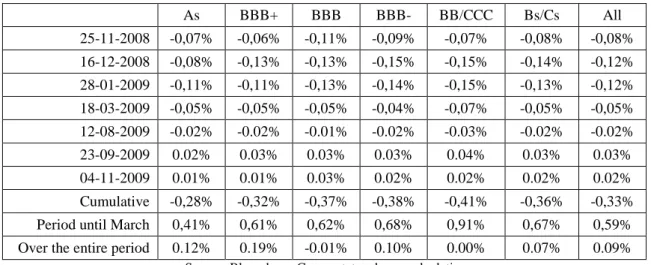
By looking at Table 5, Table 6 and Table 7 (in Appendix), which present variations in the default probabilities of companies operating in the financial sector , divided by their credit ratings, we can observe that MBS purchases were able to reduce their default risk, with the greatest reductions occurring until March 2009. The decrease was greater for lower rated companies, which is consistent with a recovery of the confidence in the financial sector hypothesis – companies that were worse to begin with, suffered more from the loss of confidence in this sector. The fact that most of the decrease occurs until March is also suggestive of the importance of the MBS purchases, given that during this period default probabilities actually increased by 59 bps.
19 Companies with lower ratings were the ones experiencing the major decreases on default probabilities, which fell 41 bps on a three year horizon. The decreases become smaller as the ratings increase. Over one year the default probabilities do not change significantly, with the cumulative decreases not exceeding 7 bps. However, accounting for the large amount of short term funding that some companies relied upon, increases the impact of Quantitative Easing on the short term default risk in 15 bps and in 25 bps for lower rated companies, that see their default probabilities falling by 32 bps.
The decrease in default probabilities on event days was not present over the entire period, when default probabilities actually increased. This suggests that MBS purchases were able to contain part of the loss of confidence in the financial sector, even though not totally countering it. We also have to take into consideration that probabilities of default of some companies may have increased due to fundamental reasons.
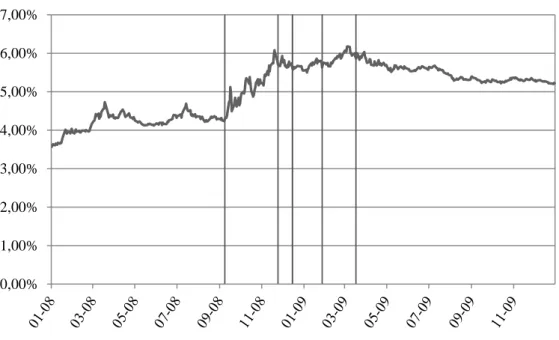
By looking at Figure 1, we can observe that default probabilities had been increasing since the beginning of 2008, with an acceleration in the rate of increase starting on September 2008 (first vertical line). When the Federal Reserve announced its intention to purchase MBS (second vertical line), probabilities of default decreased and kept decreasing until January, falling 34 bps. Default probabilities then increased and the January FOMC statement (fourth vertical line) was not able to contain this increase. The fifth vertical line indicates the FOMC statement in which the Federal Reserve announced its intention to increase the quantity of MBS purchased. From there onwards, default probabilities kept decreasing until the rest of the year. Even though Quantitative Easing cannot explain all the decreases in default probabilities, because other policies were taken during this period, it may have played an important role on the long term stabilization of default probabilities in the financial sector.
20
Figure 1: Average 3 year default probabilities
Source: Bloomberg and own calculations
Quantitative Easing was able to contain the effect of the financial crisis on the rest of the economy, with default risks of companies with high systemic risk falling on all event dates (see Table 8, in Appendix). These findings are aligned with Krishnamurthy et al. (2011), who show that default risk and default risk premia decreased and that the decreases were greater for lower rated companies. However, they do not study the specific impact on the financial sector, where MBS purchases are expected to have a direct impact.
Using panel data analysis (see Table 9, in Appendix, for the outputs of the regression), I find statistically significant increases of 4.2% in the value of firms on event dates, while the coefficient for the other dates reflects a negative trend in the market capitalization of firms, which falls on average 0.1%. The impact of the announcements increases if I consider the event dates until March 2009, with the market value of firms increasing by approximately 7.8% in each event date, suggesting that most of the effect on financial markets of MBS purchases were priced until March.
0,00% 1,00% 2,00% 3,00% 4,00% 5,00% 6,00% 7,00%
21 Given that starting on March no increases in the quantity of MBS purchased by the Federal Reserve were announced, this finding seems aligned with market efficiency.
ii. Probability of a recession
Table 2: Changes in the probability of a recession
1 day change 2 day change
25-11-2008 0,31% 0,41%
16-12-2008 0,73% 1,11%
28-01-2009 -0,27% -0,64%
Cumulative 0,77% 0,88%
Source: Bloomberg and own calculations
The probability of a recession increased in the first two event dates. This increase does not appear to be related with fluctuations in the trading of government bonds, as 2 day changes confirm the evidence found through the one day window. One possible interpretation for the contradicting results obtained by studying the yield curve and the default risk of companies can be that, even though the length of the recession may have increased – measured by the probability of a recession in one year –, the severity of the recession decreased, with default probabilities falling in the event dates analyzed.
V. Conclusions
Quantitative Easing, through large-scale MBS purchases, was able to improve confidence in financial markets and to lower the default risk premium on MBS. Most of this impact seems to occur until March 2009.
The impact on default risk was estimated through a model for the default probability of a company, assuming that returns follow a normal distribution. The largest impact occurred for default probabilities over a three year horizon, which decreased 41 bps for companies with lower ratings. Accounting for refinancing constraints and the fact that many companies operating in the financial sector financed themselves with short term funding, increases the impact of MBS purchases on one year default probabilities in 15
22 bps. These estimates are likely to undervalue the true impact of Quantitative Easing on the default risk, as the model used does not account for covariance between default probabilities. The importance of MBS purchases on default risk of financial companies becomes even more patent when observing that default probabilities increased during the period analyzed. Until March, when most of the impact on default risk occurs, default risk increased 59 bps, while on event dates it decreased 37 bps.
To estimate the impact of purchases on MBS pricing, I analyze variations in CPR to assess whether they were affecting yields on event dates and quantify, through a regression, the variance in yields attributable to default risk. I find that purchases were able to reduce MBS yields in 11.2 bps. Because disturbances on mortgage markets were caused by high risk lending, I attribute this reduction to a lower default risk premium.
References
Brunnermeier , Markus K. 2009. “Deciphering the Liquidity and Credit Crunch
2007-2008”. Journal of Economic Perspectives, 23 (1): 77-100.
Crosbie, Peter and Jeff Bohn. 2003. “Modelling Default Risk”. Moody’s KMV,
December 13.
Estrella, Arturo and Mary R. Trubin. 2006. “The Yield Curve as a leading indicator:
some practical issues”. Current Issues in Economics and Finance, Federal Reserve
Bank of New York, 12 (5).
Fama, Eugene F. and Kenneth R. French. 2002. “The Equity Premium”. The Journal
of Finance, 58 (2) : 637-659.
Gagnon, Joseph; Raskin, Matthew; Remache, Julie and Brian Sack. 2011. “The
Financial Market Effects of the Federal Reserve’s Large-Scale Asset Purchases”.
23
Mishkin, Frederic. 2011. “Monetary Policy Strategy: Lessons from the Crisis”. NBER
Working Paper Series 16755.
Krishnamurthy, Arvind and Annette Vissing-Jorgensen. 2011. “The Effects of
Quantitative Easing on Long-term Interest Rates”. Brookings Papers on Economic
Activity, 215-288.
Schwartz, Eduardo S. and Walter N. Tourous. 1989. “Prepayment and the Valuation
of Mortgage-Backed Securities”. The Journal of Finance, 44 (2): 375-392.
Stroebel, Johannes C and John B. Taylor. 2012. “Estimated impact of the Fed’s
Mortgage-Backed Securities Purchase Program”. International Journal of Central
Banking, 8 (2): 1-42.
U.S. Senate Permanent Subcommittee on Investigations. 2011. “Wall Street and the
financial crisis: anatomy of a financial collapse”.
Woodford, Michael. 2012. “Methods of Policy Accommodation at the Interest-rate
lower bound”. Paper presented at the Changing Policy Landscape Federal Reserve Bank of Kansas Symposium, Jackson Hole, WY.
Appendixes
Table 3: Regression on the relationship between measures on default risk and MBS yields
09/10/2013 01/10/2013 09/10/2013 (2008) 01/10/2013 (2008) Index -0,0005 (0,0011) -0,0003 (0,0011) 0,0655 (0,1802) 0,123 (0,1758) 0,43*** (0,1184)
*** indicates significance at the 1% significance level; the date indicates the maturity of the subordinated debt considered as measure of default risk
24
Table 4: Variations in MBS yields on event dates
Coupons 4,5 5 5,5 6 6,5 Average 25-11-2008 -0,93 -0,46 -0,31 -0,19 -0,13 -0,40 16-12-2008 -0,38 -0,24 -0,17 -0,12 -0,11 -0,20 18-03-2009 -0,39 -0,30 -0,23 -0,15 -0,12 -0,24 12-08-2009 0,03 0,01 0,07 0,00 0,02 0,03 23-09-2009 -0,01 -0,02 -0,03 -0,01 0,07 0,00 04-11-2009 0,01 0,00 -0,02 -0,02 -0,01 -0,01 Cumulative -1,67 -1,00 -0,68 -0,48 -0,28 -0,82 Period until March -3,24 -2,48 -1,94 -1,48 -1,32 -2,29 Over the entire period -3,40 -2,97 -3,00 -2,59 -2,39 -2,99
Source: Bloomberg and own calculations
Table 5: Default risk variations on event days (3 year default probabilities) (Companies operating in the financial sector) As BBB+ BBB BBB- BB/CCC Bs/Cs All 25-11-2008 -0,07% -0,06% -0,11% -0,09% -0,07% -0,08% -0,08% 16-12-2008 -0,08% -0,13% -0,13% -0,15% -0,15% -0,14% -0,12% 28-01-2009 -0,11% -0,11% -0,13% -0,14% -0,15% -0,13% -0,12% 18-03-2009 -0,05% -0,05% -0,05% -0,04% -0,07% -0,05% -0,05% 12-08-2009 -0.02% -0.02% -0.01% -0.02% -0.03% -0.02% -0.02% 23-09-2009 0.02% 0.03% 0.03% 0.03% 0.04% 0.03% 0.03% 04-11-2009 0.01% 0.01% 0.03% 0.02% 0.02% 0.02% 0.02% Cumulative -0,28% -0,32% -0,37% -0,38% -0,41% -0,36% -0,33% Period until March 0,41% 0,61% 0,62% 0,68% 0,91% 0,67% 0,59% Over the entire period 0.12% 0.19% -0.01% 0.10% 0.00% 0.07% 0.09%
Source: Bloomberg, Compustat and own calculations
Table 6: Default risk variations on event dates (1 year default probabilities) (Companies operating in the financial sector) (d=1/4 total liabilities)
As BBB+ BBB BBB- BB/CCC Bs/Cs All 25-11-2008 0,00% 0,00% 0,00% 0,00% 0,00% 0,00% 0,00% 16-12-2008 -0,01% -0,01% -0,01% -0,02% -0,03% -0,01% -0,01% 28-01-2009 -0,01% 0,00% -0,01% -0,01% -0,02% -0,01% -0,01% 18-03-2009 -0,01% -0,01% -0,01% -0,01% -0,02% -0,01% -0,01% 12-08-2009 0.00% 0.00% 0.00% 0.00% -0.01% 0.00% 0.00% 23-09-2009 0.00% 0.02% 0.00% 0.00% 0.01% 0.00% 0.00% 04-11-2009 0.00% 0.00% 0.00% 0.00% 0.00% 0.00% 0.00% Cumulative -0,02% 0.00% -0,03% -0,04% -0,07% -0,03% -0,03% Period until March 0,01% 0,02% 0,03% 0,06% 0,14% 0,05% 0,04% Over the entire period -0.02% -0.04% -0.04% 0.01% -0.08% -0.04% -0.03%
25
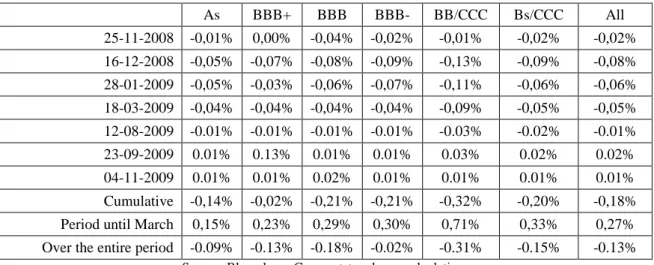
Table 7: Default risk variations on event dates (1 year default probabilities) (Companies operating in the financial sector) (d=1/2 total liabilities)
As BBB+ BBB BBB- BB/CCC Bs/CCC All 25-11-2008 -0,01% 0,00% -0,04% -0,02% -0,01% -0,02% -0,02% 16-12-2008 -0,05% -0,07% -0,08% -0,09% -0,13% -0,09% -0,08% 28-01-2009 -0,05% -0,03% -0,06% -0,07% -0,11% -0,06% -0,06% 18-03-2009 -0,04% -0,04% -0,04% -0,04% -0,09% -0,05% -0,05% 12-08-2009 -0.01% -0.01% -0.01% -0.01% -0.03% -0.02% -0.01% 23-09-2009 0.01% 0.13% 0.01% 0.01% 0.03% 0.02% 0.02% 04-11-2009 0.01% 0.01% 0.02% 0.01% 0.01% 0.01% 0.01% Cumulative -0,14% -0,02% -0,21% -0,21% -0,32% -0,20% -0,18% Period until March 0,15% 0,23% 0,29% 0,30% 0,71% 0,33% 0,27% Over the entire period -0.09% -0.13% -0.18% -0.02% -0.31% -0.15% -0.13%
Source: Bloomberg, Compustat and own calculations
Table 8: Default risk variations on event dates (3 year default probabilities) (Companies operating in sectors with high systemic risk)
Source: Bloomberg, Compustat and own calculations
Table 9: Regression on the first differences of market capitalization of financial firms
Where, in the event dates.
Until March All event dates Constant -0,0015*** (0,0002) -0,0014*** (0,002) Event date 0,0784*** (0,0024) 0,0423*** (0,0019) *** indicates significance at the 1% significance level
Source: Bloomberg and own calculations
3 year As Bs BB/B All 25-11-2008 -0,04% -0,10% -0,11% -0,08% 16-12-2008 -0,06% -0,17% -0,17% -0,12% 28-01-2009 -0,09% -0,16% -0,21% -0,13% 18-03-2009 -0,02% -0,06% -0,09% -0,04% 12-08-2009 -0.02% -0.04% -0.06% -0.03% 23-09-2009 0.01% 0.04% 0.05% 0.03% 04-11-2009 0.00% -0.01% 0.00% -0.01% Cumulative -0,22% -0,50% -0,60% -0,38% Period until March 0,13% 0,13% 0,26% 0,13% Over the entire period -0.37% -1.09% -1.48% -0.80%