DOCUMENTO CONFIDENCIAL. UTILIZAR APENAS PARA PROPÓSITOS DA AVALIAÇÃO (apagar caso não se aplique)
Development and optimization of aqueous phase
CO chemisorption technique
Master’s dissertation
ofMaria João Enes da Silva
Faculty of Science and Technology
Catalytic Processes and Material Research Group
Supervisors: Dr. S. Agarwal
Prof. Dr. ir. L. Lefferts
Departamento de Engenharia Química
Acknowledgments
This master thesis is the final project of the process and products engineering master programme at the University of Porto, Portugal. The elaboration of the dissertation was done at the University of Twente, Netherlands, within the Catalytic Process and Materials group in the department of science and technology at Twente.
I would like to thank all those who helped me in the development of this thesis. I am forever grateful to my supervisor Shilpa Agarwal for her total, unconditional availability to sort me out. To Leon Lefferts, thank you, for welcoming me into this reseach group and for all the stimulating and helpful pointers. My hearfelt thank you to Bert Geerdink, for helping me sort out the million hiccups and always being available. To Pengyu Xiu for allowing me to use his catalyst and helped me understanding the catalyst synthesis. To Rolf Postma for standing by me through thick and thin. Also, I would like to thank all the CPM group for the pleasant environment.
Last but not the least, to my family, specially my mother Teresa Enes, and my friends which were always present in my life.
Resumo
Esta dissertação tem como foco a caracterização de catalisadores heterogéneos de modo a determinar a dispersão. O desenvolvimento de catalisadores inteligentes para reações em estado aquoso fez com que se desenvolvesse novas técnicas para a caracterização do catalisador de modo a determinar a área de superfície do catalisador acessível no estado aquoso.
O monóxido de carbono, que é o gás usado para a adsorção química, é dissolvido em água e adsorvido pelo catalisador num reator. O CO vai reagir com uma solução de CuCl em que um espectrofotómetro de ultravioleta – visível é usado para quantificar a quantidade de CO adsorvido no catalisador. De modo a ser feita a caracterização do catalisador, primeiro é feita a otimização da instalação e da análise de dados.
Finalmente, dois catalisadores são usados para calcular a dispersão. O primeiro é um catalisador constituído por paládio suportado em gama alumina, sendo a dispersão obtida de 66% usando partículas de tamanhos entre 125 – 250 µm. Este valor é comparado com o valor obtido na fase gasosa, que foi de 70%. Por isso, é possível calcular a dispersão de um catalisador usando esta técnica. Contudo, é necessário melhorar a técnica com outro tipo de catalisadores, uma vez que com um catalisador com domínios hidrofóbico e hidrofílico foi difícil a interação do catalisador com a fase líquida.
Palavras Chave (Tema): Dispersão, adsorção química, fase aquosa, monóxido de carbono, UV-Vis espectro
Abstract
This dissertation focus on the characterization of the heterogeneous catalyst to determine the catalyst dispersion. Development of the tailored catalyst for aqueous reactions motivate to develop new characterization techniques to determine the available active surface area of a catalyst in aqueous phase. Therefore, the goal of this research is to develop and optimize a technique for carbon monoxide chemisorption in aqueous phase.
CO saturated in water is adsorbed in a packed bed reactor. Then will react with a solution of CuCl and the Uv-vis spectrometer will quantify the CO quantity. Setup and data analysis optimization will be done to do the catalyst characterization.
Finally, two catalysts will be measured. The dispersion of palladium on gamma alumina was calculated which with the particle size of 125 – 250 µm was 66%. Comparing with the gas phase chemisorption of the same catalyst was 70%. Therefore, this technique is possible to calculate the dispersion, but it is necessary improvements for the performance with other types of catalyst, since with the hydrophobic/ hydrophilic catalyst the difficult interaction of the catalyst with the liquid phase.
Declaration
I hereby declare, on my word of honour, that this work is original and that all non-original contributions were properly referenced with source identification.
Porto, 15/09/2017
i
Índex
1 Introduction ... 1
1.1 Presentation of the work ... 1
1.2 Contributions of the work ... 2
1.3 Outline ... 2
2 Context and State of Art... 3
2.1 Catalysis ... 3
2.1.1 Heterogeneous catalysis ...3
2.2 Catalyst characterization ... 4
2.2.1 Catalyst dispersion ...5
2.2.2 Dispersion calculation ...5
2.3 Turnover Frequency (TOF) ... 6
2.3.1 Structure-sensitive reactions ...6
2.4 Specific sites preference ... 7
2.5 Tailored catalyst ... 8
2.5.1 Nitrite hydrogenation ...9
2.6 TOFAQUEOUS vs TOFGAS ... 11
2.7 Research purpose - Technique ... 11
3 Materials and Method ... 13
3.1 Setup equipment ... 13
3.1.1 Reactor... 14
3.1.2 Debubbler ... 15
3.1.3 Detector Uv-vis Spectrometer ... 15
3.2 Materials ... 16
3.2.1 Colouring agent: ... 16
3.2.2 Catalysts ... 16
3.3 Methods ... 17
ii
3.3.2 Setup procedure ... 17
3.3.3 Uv-vis data ... 18
4 Results and Discussion ... 21
4.1 Setup development and optimization ... 21
4.1.1 Setup complications ... 22 4.1.2 Improvements... 24 4.2 CuCl solution ... 25 4.2.1 Solution preparation ... 25 4.2.2 CuCl signal ... 26 4.2.3 CuCl stability ... 27
4.3 Interaction between CuCl solution and CO... 28
4.3.1 CuCl and CO interaction overtime ... 28
4.3.2 Calibration curve ... 29
4.4 Catalyst characterization ... 30
4.5 Data analysis ... 31
4.5.1 Catalyst A ... 31
4.5.2 Noise errors ... 34
4.5.3 Catalyst dispersion with hydrophobic/hydrophilic part ... 37
5 Conclusion ... 39
5.1 Future work ... 40
5.1.1 Setup design ... 40
5.1.2 CuCl reaction with CO ... 41
5.1.3 Reactor design ... 41
5.1.4 Pre-treatment ... 41
5.1.5 Improve interaction of the catalyst with the liquid phase ... 42
5.1.6 HPLC ... 42
5.1.7 Gas bubbles formation with hydrophobic domain ... 42
Appendix 1 Catalyst synthesis and pre-treatment ... 47
Appendix 2 CO dissolution in water ... 48
iii
Appendix 4 Catalyst A ... 50
Appendix 5 Gas pulse chemisorption ... 52
Appendix 6 Catalyst B ... 53
iv
Notation and Glossary
A Absorbance
b Length cm
c concentration M
є Absorvity coefficient M-1cm-1
MW Molecular mass g mol-1
SF Stoichoimetric factor
List of acronyms
CPM Catalytic Process and Material CNF Carbon Nano-Fibers
CO2 Carbon dioxide
CO Carbon monoxide
CuCl Copper chloride
FOTS perfluotonated-octyltrichlorosilane
He Helium
HCl Hydrogen chloride
M metal
NaOH Sodium hydroxide O2 0xygen
Pd Palladium PVA Plyvinyl alcohol PVP Polyvinylpyrrolidone
TPR Temperature Programmed Reduction TPO Temperature Programmed Oxidation TOF Turnover Frequency
XRD X-Ray Diffraction XRF X-Ray Flourescence
1
1 Introduction
The most common approach for the characterization of heterogeneous catalysts is gas chemisorption to determine the active metal surface area of the catalyst. The reason for measuring the number of available metal atoms in a catalyst is to allow the reaction rate to be normalized by the amount of the active component and consequently, turnover frequency can be calculated.
Nowadays, instead of a metal supported on a support material, there has been a lot of research into the development of tailored catalysts. Catalysts which organic or inorganic materials are bond into the metal site. The estimations of available active surface area for tailored catalyst based on techniques, such as TEM, which requires the assumption that the entire surface of the metal particles is available for adsorption can be misleading. Also, measuring the active metal for CO chemisorption in the gas phase to determine TOF of the catalyst for the aqueous phase reactions can give misleading results. The reason is that the materials bond into the metal surface can have different behaviours in gas or liquid phase, consequently, the TOF measured in the gas phase can lead to misleading results.
1.1 Presentation of the work
Therefore, the goal of this research is to develop and optimize a valid carbon monoxide chemisorption technique in aqueous phase to determine the available active surface area of a catalyst. The technique will use carbon monoxide dissolved in water and the CO adsorbed at the catalyst surface will be quantified using a UV-Vis spectrometer. Furthermore, a CuCl solution is used to react with CO in water to obtain an absorption spectrum.
First step is the setup optimization, for instance to check the stable flow rates and how the equipment works. Also, CuCl solution stability, how to prepare the solution and how is the interaction between CuCl/CO. Moreover, the catalyst characterization and data analysis. In order to calculate the dispersion, the amount of catalyst and percentage of CO used should be optimized. Finally, two catalysts are characterized, one with only metal loading, palladium on gamma alumina, and another one with hydrophilic and hydrophobic domains.
2
1.2 Contributions of the work
The development of this technique is to be able to calculate the dispersion of tailored catalyst which can have different behaviour in liquid and gas phase. Thus, the main goal of this project is to optimize and develop a validated technique to calculate the dispersion of a catalyst in aqueous phase, instead of the common used (gas phase).
1.3 Outline
This dissertation is divided in five Chapters. In the first chapter, the main objectives and the steps done to develop this work are introduced. The second chapter is dedicated to the state of the art of techniques for the catalyst characterization, with special focus on the improvements done in the setup and the calculation of the active sites on the metal loading. In chapter three, the materials selected for the preparation of catalyst and solutions are described, as well as a brief explanation of the equipment and the experimental procedure. In chapter four, the most important results are presented and discussed. In the chapter five, the conclusion and recommended future work are presented.
3
2 Context and State of Art
2.1 Catalysis
A catalyst is a substance that can accelerate certain chemical reactions by forming bonds with the reacting molecules without being consumed itself in the reaction (kinetic phenomenon) [1]. By use of catalyst a reaction can be operated at milder conditions, greatly reducing the operating costs, increasing the product selectivity, significantly reducing not only the amount of produced waste but also the need for elaborate separation steps later in the process [2].
Catalysts can be categorised in two main categories, biological (e.g. enzymes) or non-biological (e.g. organic and inorganic materials). The first one is usually termed enzymatic catalysis, whereas non-biological are categorized as either homogenous or heterogenous catalysis. In homogeneous catalysis, the catalyst and substrates are in the same phase, typically liquid phase. In heterogeneous catalysis, the catalyst is in a different phase from the reactants, generally a solid.
2.1.1 Heterogeneous catalysis
A reaction in heterogeneous catalysis generally consists of chemical adsorption of the reactants from a fluid phase onto a solid surface, surface reaction of adsorbed species, and desorption of products into the fluid phase making the active sites on the surface available for the next catalytic cycle [3]. Figure 1 illustrates the sequence for the catalytic oxidations of carbon monoxide on a noble metal such as platinum; the function of the catalyst is to provide an energetically favourable pathway for the desired reaction, in which the activation barriers of all intermediate steps are low compared to the activation energy of the gas reaction. In this case, the key role of the catalyst is to dissociate the O2 molecule and CO is
adsorbed on the surface. Next, the adsorbed CO reacts with O on the surface to form CO2,
4
Figure 1 - Schematic representation of the oxidation of carbon monoxide on a metal catalyst: CO+½ 02 → CO2 [1]
2.2 Catalyst characterization
Catalyst characterization is used to study the physicochemical properties of a catalyst (e.g. structure, morphology, composition, texture) in the bulk and the surface and, also, to investigate catalyst surface reactivity (adsorption, desorption, etc) [4]. Frequently used techniques include x-ray based analysis methods, such as XRF to determine the concentration of various elements (support, active metals and impurities), XRD to determine the crystal structures. Transient thermal techniques such as Temperature Programmed Reduction (TPR) or Temperature Programmed Oxidation (TPO) can be used to determine the behaviour of the catalyst under various conditions when put under thermal stress. Total surface area, as well as pore size distribution can be measured by nitrogen adsorption isotherms, using the BET technique. Distribution of the metal particle size can be determined using Transmission Electron Microscopy (TEM) [2].
A technique used to determine the dispersion of active phase of the catalyst is chemisorption. In this technique a probe molecule, generally hydrogen, ammonia or carbon monoxide, is chemically bonded specifically to the active surface of the catalyst. Because most chemical reactions are performed at elevated temperatures in the gas phase, the most common approach to determine dispersion of heterogeneous catalysts is using gas chemisorption technique. The probe molecule should have a negligible interaction with the support material, but bond strongly with the active sites. It is generally assumed that one
5
surface atom will take up one probe molecule. Although hydrogen dispersion can be calculated assuming one molecule of hydrogen adsorbs on two active metal sites, because of dissociative adsorption. By calculating the difference between the quantity of probe molecules sent to the sample and those left over, together with the mass of catalyst used during the test and the metal loading on the catalyst, the dispersion can be calculated.
2.2.1 Catalyst dispersion
Many reactions are catalyzed by block metals; because of the partially filled d-orbital of these metals, they are able to stabilise the intermediates of many reactions. Unfortunately, many of these metals are rare and costly, for this reason it is important that the metal is used as efficiently as possible. For this reason, the active metal is dispersed on a cheap and generally inert, porous, ceramic support with a high specific surface area, for example alumina or silica. Added benefits of a support material are highly improved mechanical, thermal as well as chemical stability of the catalyst [2].
Because catalysis is a surface phenomenon, the performance of a catalyst (activity, selectivity and stability) depends on composition and size of the nanoparticle, number of active sites on the support and the porosity.
As a rule of thumb, a catalyst should have high surface area, meaning that the active metal sites should be well dispersed across the surface of the support. Dispersion is defined as the ratio between the available active surface atoms and the total amount of active atoms present in the catalyst [equation 1], thus showing the fraction of atoms able to participate in the catalytic reaction [5].
𝑑𝑖𝑝𝑒𝑟𝑠𝑖𝑜𝑛 =
𝑛𝑢𝑚𝑏𝑒𝑟 𝑜𝑓 𝑠𝑢𝑟𝑓𝑎𝑐𝑒 𝑚𝑒𝑡𝑎𝑙 𝑎𝑡𝑜𝑚𝑠𝑡𝑜𝑡𝑎𝑙 𝑛𝑢𝑚𝑏𝑒𝑟 𝑜𝑓 𝑚𝑒𝑡𝑎𝑙 𝑎𝑡𝑜𝑚𝑠 𝑐𝑎𝑙𝑐𝑢𝑙𝑎𝑡𝑒𝑑 𝑓𝑟𝑜𝑚 𝑚𝑒𝑡𝑎𝑙 𝑙𝑜𝑎𝑑𝑖𝑛𝑔 (1)
2.2.2 Dispersion calculation
Dispersion value can be estimated with pulse chemisorption in gas phase and TPD (Temperature programmed desorption).
A Pulse chemisorption experiment consists of first pre-treating the catalyst, to clean the surface of the catalyst by either vacuum, high temperature and/or chemical cleaning (e.g. reduction or oxidation). The required pre-treatment dependent on the type of the catalyst as well as the expected reaction conditions to which the catalyst will be subjected [2]. After pre-treatment, inert gas is flowed over the sample, followed by successive small
6
pulses of probe molecules injected in the flow of inert gas by a syringe or loop at the desired temperature. [5, 6].
The other technique, temperature programmed desorption (TPD) is a desorption process where the technique measures the rate of desorption as function of time or temperature. First the surface is saturated with adsorbate, then it is rapidly heated to an elevated temperature to cause thermal desorption of all the adsorbed gas. The volume of desorbed gas is calculated [7].
2.3 Turnover Frequency (TOF)
Once the number of exposed metal atoms on the catalyst is known, the reaction rate can be normalized over the amount of active sites. This normalization is called the turnover frequency (TOF, s-1) and can be defined as: number of moles of a given product formed or
reactant consumed per mole of catalytic sites per second for the given set of reaction conditions. Using the dispersion and TOF it is possible to compare the reaction data from different catalysts for a given reaction, taking into consideration that this value is based on the number of active sites and assuming that all metal sites are equally active, it should not depend on how much metal is loaded onto the support or into the reactor [8].
2.3.1 Structure-sensitive reactions
One of the assumptions of the TOF is that reactions are generally structure-insensitive (Figure 2 (1)), but in heterogeneous reactions, turnover frequency can depend greatly on the particle size (Figure 2 (2) & (3)). The reason for this is that different metal facets, edges and step sites show different reactivity, giving a different activity per active surface atom. A difference in particle size will lead to a difference in the concentrations of different exposed facets, which can influence both activity as well as selectivity. Therefore, the assumption that all the active sites are equally active is not always true.
7
Figure 2 - three types of relationships between size of metal nanoparticles and their catalytic activity. Type 1 is structure insensitive (hydrogenation reactions). Type 2 the activity decreases when the particle size increases. Type 3 TOF increases with particle size ( CO hydrogenation) [2]
2.4 Specific sites preference
In chemisorption, chemical bonds are formed between the adsorbing molecule and the surface, consequently electrons are redistributed over orbitals of the adsorbing atom/molecule and the atoms on catalytic surface. Hence, atoms and molecules bind on specific sites on surfaces in geometries that correspond to minimum energy configuration, which can bind to single surface or group of atoms (figure 3) [2].
Figure 3 - Example of adsorption site on metals (M):CO in top, bridge or threefold hollow sites on an fcc(111) surface
Because of entropic effects a metal surface will never show a pristine crystalline structure. Defects will form, such as terraces, step-sites and vacancies (Figure 4) [9]. These different sites will have widely different coordination numbers (number of neighbouring
8
atoms) and thus a different electronic structure. This difference in electronic structure can lead to vastly different adsorption characteristics. Although these different geometries can have different bonding characteristics, for dispersion calculations it is assumed that all the adsorption sites are similar and thus one CO molecule adsorbs on one surface metal atom (CO:M 1-1) [2].
Figure 4 - Schematic representation of various defects that can be found on a metal lattice
2.5 Tailored catalyst
As stated before, traditional heterogeneous catalysts consist of a metal, or metal alloy, supported on a (generally inert) support material, resulting in a rigid structure that is supposed to remain stable under reaction conditions. In the last decade, there has been a lot of research done into the development of so called ‘smart catalysts’.
9
Most catalysts currently used in industry suffer from the difficulty to control the growth on active metal nanoparticles, leading to variations in particle size, crystal structure and distribution of the concentration of active sites throughout the support matrix. This can greatly influence both the activity and, more importantly, the selectivity of the catalyst. Because of increasing demands for more selective catalysts, much research has been put into controlling the growth and distribution of metal nanoparticles. This research has led to various methods of synthesizing nanoparticles with well-defined sizes, shapes, crystal facets, structure and composition creating more efficient and selective catalysts (figure 5) [11, 12].
To achieve monodispersed metal distribution, colloidal synthesis approach is used. Stabilizers are used in this approach to prevent agglomeration and create particles with monodispersed size and shape with significant surface area. The stabilizers are added to the metal before deposition on the support resulting in much better control over the particle size [13].
With the ongoing shift from conventional fossil fuel based resources to more bio based resources for the chemical industry, as well as more strict policies concerning drink and waste water cleaning, a large focus has been put into aqueous phase catalysis. Because of the chemical characteristics of water, aqueous phase catalysis entail many parameters generally not found in conventional gas phase catalysis. Generally, the solid catalysts like alumina, ceria etc are wettable by water. Problem of mass transfer is observed if one of the reactants is in the gas phase. As catalyst is wettable by water then gas molecule cannot easily interact with the catalyst surface. Hence the activity of the catalyst can be influenced, then wettablility becomes a considerable parameter for designing and synthesizing highly active heterogenous catalysts [14].
2.5.1 Nitrite hydrogenation
Within the CPM group at the University of Twente, a lot of research has been done into nitrate and subsequently nitrite hydrogenation, since groundwater pollution by nitrous oxides is a widespread problem across the world. Many methods have been researched, potentially the reactive reduction of nitrous oxide to nitrogen is the cheaper and more manageable option. A drawback of this process is that when hydrogen is used as reducing agent, also ammonia can form, which is a highly undesired by-product [15]. The selectivity of nitrite hydrogenation is influenced by the concentrations of the reactants which low nitrite concentration favour ammonium formation over nitrogen and the Pd particles are favourable for selectivity to nitrogen.
10
2.5.1.1 Hydrophilic/hydrophobic catalyst
One of the research tracks uses a catalyst with hydrophilic/hydrophobic domains in a slurry reactor. In a three-phase reaction [gas (hydrogen), liquid (nitrate and nitrite dissolved in water) and solid (the catalyst)] it is necessary to develop a catalyst that improves both activity and selectivity. Gas diffusion into the active part of the catalyst is one of the most notable limitation. Therefore, the research introduces a catalyst with hydrophilic/hydrophobic domains, in which the hydrophobic domain can positively influence the mass transfer of the gas to the catalyst surface [16].
2.5.1.2 Monodispersed materials nanoparticles
Another research is related with “Colloidal Nanoparticles as catalysts and catalyst precursors for nitrite hydrogenation” [13]. The catalyst used was palladium supported on carbon nano-fibers with PVA and PVP as stabilizers. Stabilizers can interact with the surface of the nanoparticles competing with reactant molecules for activity sites, hence blocking active sites. They can also influence the selectivity of catalysts in some liquid phase reactions. For example, PVP influences adsorbed species, resulting in increasing of TOF and less selectivity to ammonia [17].
Table 1 - Characterization data obtained for Pd-CNF stabilized with different percentage of PVA with same metal loading (n.d. – not determined)
As discussed before, a technique frequently used to determine particle size and, from there, the dispersion of such tailored catalysts are transmission electron microscopy (TEM) for metal particles size determination and CO chemisorption in a gas phase for the dispersion and average of metal particle size. The estimations of available active surface areas for colloidal metals based on techniques such as TEM can be misleading, when assuming that the entire surface of the metal particles is available for adsorption [18]. Table 1 shows CO chemisorption and TEM analysis of a catalyst with metal particles covered by stabilizer which show completely different values for dispersion when comparing the two techniques. Catalyst
11
with smaller particle size have higher percentage of polymer attached to the surface. Consequently, a bigger difference in calculated dispersion values between the two techniques is observed, as can be seen in table 1. This proves that the stabilizers can limit the accessibility of the active sites, due to the occlusion by the stabilizers [19]. This shows the need for a method to determine the active surface area under reaction conditions.
2.6 TOF
AQUEOUSvs TOF
GASTOF is a rate per active site; measuring the active metal for CO chemisorption in the gas phase to determine the TOF of the catalyst for aqueous phase reactions can give misleading results. Because it does not show how many active sites are available under reaction conditions. Stabilizers or other molecules on the Pd surface are likely to be influenced by the presence of water/solvent, implying that the extent of blocking Pd sites is probably different in gas and water (figure 6).
Figure 6 - Representation of the interaction of stabilizers in gas or liquid
2.7 Research purpose - Technique
The goal of this research is to develop a validated chemisorption method to determine the available active surface area in aqueous phase. The technique will work in a continuous flow and carbon monoxide will be adsorbed in the surface of the catalyst. CO will react with a CuCl solution to determine the quantity of CO adsorbed on the catalyst using UV-Vis spectroscopy.
There are other attempts for the dispersion calculation in aqueous phase. One technique uses precise and accurate differential barometric measurement of gas adsorption into liquid dispersions of colloidal metal catalysts. There are two bulbs, one containing colloidal metal stabilized with a polymer (PVP) and another one with just the polymer stabiliser, both surrounded with a solvent. When the adsorbate gas is introduced, a pressure
12
drop will occur because of the gas volume dissolved in the liquid plus the volume adsorbed on the dispersion metal particles. This way, subtracting the volume of gas obtained from the two bulbs, the quantity of gas adsorbed on the catalyst can be calculated and from there the dispersion [18].
Another technique uses CO pulses in water with colloidal metal stabilized with a polymer. The quantity of gas adsorbed on the catalyst was measured with a quadrupole mass spectrometer which is not the ideal method for the dispersion calculation however, because a mass spectrometer gives an inherently less reliable quantitative measurement [17].
Determination of the amount of adsorbed CO based on direct concentration measurements is inherently more precise and easier to use than barometric or mass spectrometry based techniques. This shows that the chemisorption technique developed for this thesis is potentially a lot more applicable.
13
3 Materials and Method
3.1 Setup equipment
Figure 7 - Setup
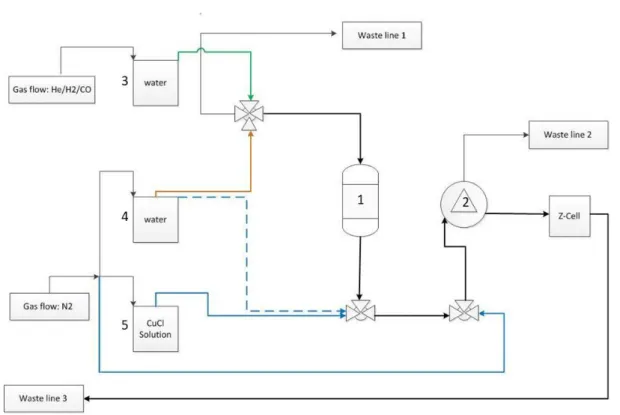
The setup for doing chemisorption measurements in aqueous phase (figure 7) consists of three saturators, one reactor (fixed bed), a mixing coil, UV-Vis spectrometer, z-cell, a debubbler, two mass flow controllers (CO and He), two pumps (one with fixed flow another with controlled flow). The system is completely made from PEEK (Poly-etheretherketone) and glass, because these materials have a negligible oxygen permeability. Furthermore all the saturators are continually flushed with inert gas (nitrogen/helium) to prevent the CO and CuCl to react with oxygen.
14
Figure 8 - PFD (Process Flow Diagram) setup representation. Number 1 is the reactor, number 2 the debubbler, number 3 saturator with He with hydrogen or CO, number 4 saturator with water and nitrogen, number 5 saturator with CuCl solution with nitrogen.
3.1.1 Reactor
In figure 9 the reactor design is shown; it is a straight tube with two sections. The first section has a diameter of 4 mm with a length of 60 mm, at the end of the section a glass fibre filter with a pore size of P2 (40-100 µm) is placed. The second section has a diameter of 0.64 mm with a length of 40 mm.
15
3.1.2 Debubbler
The design of the debubbler is represented in figure 10. It prevents gas bubbles from entering the z-cell, the separation occurs in an equilateral triangular cell with a very low mixing volume, giving a simple yet very efficient approach to separate the liquid from the gas phase. [21] Also, the volume for separation can be adjusted by changing the thickness of the packing, which is an important parameter for the separation of the gas from the liquid.
Figure 10 - Debubbler design [20]
3.1.3 Detector Uv-vis Spectrometer
A UV-Vis spectrometer (MAYA 2000 PRO, Ocean Optics) is used to quantify the CO adsorbed. The system can only detect in the range of 200-800 nm, thus a CuCl solution is needed to react with CO to form complexes which absorb within this range.
The amount of light absorbed is the difference between the incident radiation (Io) and the transmitted radiation (I). The amount of light absorbed is expressed as either transmittance or absorbance equation 2.
𝐴 = − log 𝑇 = − 𝑙𝑜𝑔 𝐼
𝐼0= є b c (2)
According to Lambert Beer´s law the absorbance is directly proportional to the concentration c; ε is the molar absorption characteristic of a given substance under a precise (wavelength, solvent and temperature) and b the sample path length [22].
16
3.2 Materials
3.2.1 Colouring agent:
Copper chloride [CuCl (Alfa Aesar, 99% purity, MW: 98.99 g/mol, highly soluble in concentrated HCl and sparingly soluble in water)], hydrochloric fuming acid [HCl (Merck, 37 V%)], MilliQ water (synergy).
3.2.2 Catalysts
3.2.2.1 Hydrophilic Catalyst:
Catalyst support used is gamma alumina powder [ ϒ - 𝐴𝑙2𝑂3 (BASF, S.A: 195 m2/g,
d:<300 µm], precursor solution used is Tetraamminepalladium(II) nitrate solution [Pd(NH3)4(NO3-)2 (Aldrich, 10 wt% in water 99.99% ρ:1.03 𝑔/𝑚𝑙]. For setup optimization work,
old Pd/Al2O3 catalyst was used. This catalyst was prepared using sodium hydroxide [NaOH (Merck)] dissolved in MilliQ water to adjust pH. The rest of the thesis this catalyst is labelled as catalyst A.
For testing the system reproducibility, we used new catalyst synthesized using ammonium hydroxide [ 𝑁𝐻40𝐻 (Alfa Aesar 50% v/v aqueous solution)] dissolved in MilliQ water to adjust the solution pH. This catalyst is labelled as catalyst B in the thesis.
3.2.2.2 Catalyst with hydrophobic and hydrophilic domains:
Hydrophilic domain: same material as explained in the previous section (3.2.2.1) catalyst B.
Hydrophobic domain: For surface modification perfluotonated-octyltrichlorosilane [FOTS (Sigma-Aldrich, 97%, MW:481.54 𝑔/𝑚𝑜𝑙, ρ:1.3 𝑔/𝑚𝑙)] dissolved in hexane solvent [𝐶6𝐻4 (Sigma-Aldrich, anhydrous, 95%)] was used.
3.2.2.3 Hydrophilic part calcination/reduction and sieve
After the synthesis (described in appendix 1), the catalyst was calcined at 673 K (heating rate 5 K/min) for 2-3 hours in air with volumetric flow of 50 ml/min to remove contaminants. Subsequently, nitrogen flow was introduced for 15 min followed by the reduction in hydrogen flow (50 ml/min) for 2-3 hours to reduce the catalyst.
After reduction, catalyst A was first pressed using a manual press (25 bar for two minutes). For catalyst B and with hydrophilic/hydrophobic domains, manual press followed by cold isostatic press (3800 bar for two minutes) was used. Then the particles are sieved in the desirable particle size.
17
3.3 Methods
3.3.1 Preparation of CuCl solution
The saturator was filled with water and flushed for one day with nitrogen, to get rid of dissolved oxygen. The CuCl solution was prepared and added to the saturator the next day. First, the powder of CuCl was added to 30 ml concentrated HCl solution. After boiling water for 45 minutes (to remove dissolved gas), the water was added to the CuCl solution. The final CuCl concentration was 2.5 mmol/l.
3.3.2 Setup procedure
For the characterization of the catalyst, CO was saturated in the aqueous phase. First CuCl is introduced into the system. Afterwards, the CO passed through the reactor/catalyst bed, the colouring agent (CuCl solution) reacts with CO and form complexes detectable by Uv-Vis spectrometer. Then the dispersion can be calculated.
3.3.2.1 Reactor with catalyst
The first step is the pre-treatment of the catalyst by flowing dissolved hydrogen at room temperature over the catalyst bed using a volumetric flow of 0.53 ml/min for one hour (for more details and calculation related to hydrogen consumption refer to appendix 1). The hydrogen flow was stopped and the flow was changed to water saturated with nitrogen. After 30 mins background UV-Vis spectrum was recorded. Next, CuCl solution was introduced, one (or two) wavelength(s) of the CuCl solution spectrum was chosen to study the absorbance of that wavelength over time. After approximately one hour the CuCl signal was observed to be stable and then CO saturated water was introduced in the system. CO will react with CuCl changing the absorbance of the signal at that wavelength.
3.3.2.2 Empty reactor
After the measurements with the catalyst, the reactor was removed from the setup and the catalyst was thoroughly removed. The clean empty reactor was put back into the setup. Using the same background as before, the same procedure as above was used, water and CuCl are flowed into the system. When the CuCl signal was stable, the water saturated with CO was introduced, to measure the blank response of the system. The reason the blank
18
response is measured afterwards is simply due to practical reasons (catalyst cannot be added to a wet reactor, and using a second reactor might influence the measurement (different flow distribution)).
3.3.3 Uv-vis data
Following the steps with empty reactor and catalyst in the reactor as explained in previous section figure 11 is obtained. The absorbance difference could be because they are not measured at the same time (external perturbations like temperature fluctuations). Although, the difference in the y-axis is very small around 0.16 vs 0.20 maximum (figure 11).
One wavelength from CuCl solution was chosen and the increase in the absorbance was due to the presence of CO in the system. Studying the change of the signal response (with empty and catalyst) over time it is possible to quantity the CO adsorbed on accessible metal sites. 0 20 40 60 80 -0.05 0.00 0.05 0.10 0.15 0.20 274 nm Abso rbance Time (min) Catalyst Blank 0.20 0.16
Figure 11 - Representation of the signal response - absorbance with wavelength 274 nm with time
3.3.3.1 Calibration curve
To calculate the CO adsorbed it is necessary to know the concentration of CO over time. Since CO concentration has a linear relation with absorbance, the maximum absorbance corresponds to the maximum CO concentration dissolved in water and the figure 12 is obtained which represents the calibration curve.
19
A two points calibration is not the best way to proceed. Although, doing a multi- point (using different concentration of CO in water) each time is impossible. Also, it is not possible to use the multi-point calibration measured on a different day because the absolute absorbance values change slightly. It was proved that CO has a linear relationship with CuCl, and hence it is assumed that 2 points calibration is valid. From the calibration curve, the slope gives the relation between absorbance and concentration.
Figure 12 - Calibration curve for of absorbance (274 nm) with respect to the CO concentration with catalyst on the reactor
3.3.3.2 Dispersion Calculations
After the calibration curve, figure 13 was obtained showing the concentration of CO over time with an empty reactor and with catalyst in the reactor. The quantity of CO adsorbed was calculated by integrating the area between the 2 response signals (grey area).
0.0000 0.0001 0.0002 0.0003 0.0004 0.0005 0.0006 -0.02 0.00 0.02 0.04 0.06 0.08 0.10 0.12 0.14 0.16 0.18 Abso rbance concentration (mol/l) 274 nm
20
Figure 13 - Representation of the concentration over time with wavelength 274 nm resulted from the figure 12 using a CO percentage of 50% (50%He)
The quantity of adsorbed CO on the catalyst was obtained using equation 3. It is calculated using the graph area (figure 13 grey area), the total flow rate (0.5 ml/min, fixed) and the measured amount of catalyst used in the experiment.
Finally, the dispersion is calculated using equation 4. With the quantity of CO adsorbed, stoichiometry factor of one, Pd metal atomic mass is 106 g/mol and the percentage of metal loading on the catalyst determined using XRF technique.
𝑄
𝑐ℎ𝑒𝑚𝑖𝑠𝑜𝑟𝑝𝑡𝑖𝑜𝑛(
𝑚𝑜𝑙 𝑔) =
𝑔𝑟𝑎𝑝ℎ 𝑎𝑟𝑒𝑎 (𝑚𝑜𝑙 𝑚𝑖𝑛/𝑙) ×𝑇𝑜𝑡𝑎𝑙 𝑓𝑙𝑜𝑤 𝑟𝑎𝑡𝑒 ( 𝐿 𝑚𝑖𝑛) 𝑚𝑎𝑠𝑠 𝑜𝑓 𝑐𝑎𝑡𝑎𝑙𝑦𝑠𝑡 (𝑔) (3)𝐷𝑖𝑠𝑝𝑒𝑟𝑠𝑖𝑜𝑛(%) =
𝑄𝑐ℎ𝑒𝑚𝑖𝑠𝑜𝑟𝑝𝑡𝑖𝑜𝑛 × 𝑆𝐹 × 𝑀𝑊 𝑆𝑢𝑝𝑝𝑜𝑟𝑡𝑒𝑑 𝑚𝑒𝑡𝑎𝑙 𝑤𝑒𝑖𝑔ℎ𝑡 (%)× 100 × 100
(4)21
4 Results and Discussion
4.1 Setup development and optimization
Schematic representation of the setup is shown in figure 8 section 3.1. In the upstream of the reactor there are two saturators, one with CO or H2 saturated in water and the other
with N2 saturated in water. Using a 4 port- 2 way valve, the flow from the saturators can be
selected to either flow to the reactor or to the waste, giving an easy switch between the water (orange line) or CO stream (green line). The continuous flow from these two sources was controlled with a fixed pump line (flow 0.53 ml/min) using a peristaltic pump.
One of the streams is directed to the reactor. After the reactor, the stream was mixed with the CuCl solution followed by inert gas bubbles (N2). The gas bubbles were added to
avoid the creation of concentration gradients and prevent back mixing in the sample lines to reduce errors (figure 14). To increase the time for the reaction between CuCl and CO, a tube rolled up into a coil was added to the system.
Figure 14 - Reactants mixing in liquid slugs [20]
The removal of the (inert) gas bubbles was done after the reaction coil using a debubbler as explained in section 3.1.2. The debubbler divides the flow in two streams. One of the streams without gas bubbles goes to the z-cell, the remaining stream was pushed together with the gas to the waste. Finally, the absorption spectrum of the flow was collected in the z-cell.
The blue lines and the waste line 3 (Figure 8) were controlled with a pump where the flow can be changed (maximum speed 0.8 ml/min). The dashed line with blue colour was used when the setup was flushed with water to collect the background UV-Vis spectrum as explained in section 3.3.3.
22
4.1.1 Setup complications
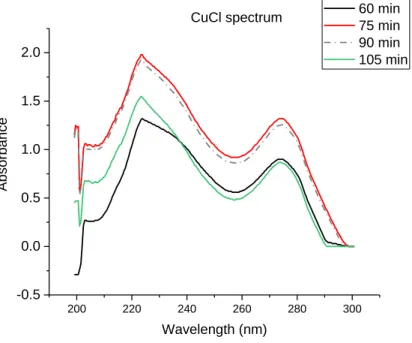
The setup is designed to work in a continuous flow. However, in the preliminary measurements the continuous flow was not observed due to the pressure built up in some parts of the setup. Consequently, the signal from the UV-Vis was unstable, changing drastically the absorbance obtained as can be seen in figure 15. The figure demonstrates the CuCl spectrum obtained over time, even after 105 min the solution was not stable due to the unstable flow in the system. Another problem was that the interaction of CuCl with CO measured was not reproducible which was due to the blockage in the reactor. Because of the unstable system, all parts of the setup were analyzed and optimized individually to understand and get reproducible response from the setup.
Figure 15 - CuCl spectrum over time clearly illustrating that the signal is unstable.
4.1.1.1 Reactor
The old reactor had a filter with pore size of P4 (10-16 μm) which could be one of the reasons why the reactor was blocking the flow as the catalyst fine particles could block the small pores. A new reactor was made with the same dimensions but a different filter, with a bigger pore size P2 (40-100 μm).
4.1.1.2 Mixing layout
After the reactor, the behaviour of the flow, continuous or irregular, depends on how the mixing is done between the different streams. The old procedure is illustrated in figure
200 220 240 260 280 300 -0.5 0.0 0.5 1.0 1.5 2.0 Absor ba nce Wavelength (nm) 60 min 75 min 90 min 105 min CuCl spectrum
23
16, first the CO/water stream is mixed with the gas phase and then the CuCl solution was introduced, which proved not the best way to achieve a continuous flow and an efficient separation of the samples.
Figure 16 - Previous representation of the mixing system flow
As a result, a sequence represented in figure 17 was chosen. First the liquid phases were mixed and later the gas bubbles were added. The way the phases are added (inlet of liquid, gas opposite and outlet pointing upwards) influences the stability of the response. This way the interaction is forced and creates better and clearer sample division.
Figure 17 - Representation of the mixing layout with the flows improvement
Having a continuous flow with this configuration makes it necessary to optimize the gas bubble flow to achieve a better mixing, the ideal flow rate was found to be 0.4 ml/min. The optimized flow rates are represented in the figure 17.
A piece of transparent tubing was added after the mixing to easily see the interaction between liquid and gas to validate that the flow is continuous. Furthermore, the tubing from the whole setup was changed to a more flexible material to improve the contact between pump and tube.
0.4 ml/min 0.5 ml/min
24
4.1.1.3 Debubbler
The debubbler is one of the most important parts of the setup and sensitive; figure 18 represents the debubbler layout. The sealer cannot be too tight otherwise it will block the flow from the tubes and the area of the triangle cut of the sealer was further optimized for better separation of the liquid and gas phase.
Figure 18 - Representation of debubbler layout
The tubbing from the debubbler waste line was replaced with a different more flexible material, because the old one had a pressure build-up resulting in the setup stopping a continuous flow over time. Also, the waste line was put to a certain height to increase the pressure in the tube to help with the separation.
The flow to the z-cell/waste line 3 (one of the streams coming from the debubbler) was further optimized to force the bubbles and the liquid to go up and improve separation, because it is the only flow that can be controlled from the debubbler (figure 8 waste line 3). The flow was decreased to 0.4 ml/min.
4.1.2 Improvements
The improvements of the system made the signal faster and stable. Although there are some recommendations, since the signal from the spectrometer is sensitive. Tubing needs to be changed regularly and the tubing material is important; also all the tubes should be unplugged from the pump to improve their lifetime. It is necessary to check every flow regularly to make sure continuous stable flow. A common reason for an unstable signal is a bad separation of the gas bubbles from the debubbler; consequently the thickness of the sealer has to be adjusted.
Figure 19 shows the absorbance with time at the wavelength 274 nm of the solution CuClCO complex. The left side shows the signal over time before fixing the system. The right side shows the signal after all the improvements of the system showing the stability of the system. From the picture, it is clear that the signal is sensitive to perturbations, like pressure and unstable flow.
25
Figure 19 - Absorbance signal over time at the wavelength 274 nm, the old signal (left plot) and signal after optimization (right plot).
4.1.2.1 Pre-treatment
Pre-treatment for the catalyst was added. Flowing hydrogen from the saturator to make sure the palladium active sites are reduced. The saturator (number 3 from the figure 14) was first saturated with hydrogen gas and treatment was performed. After pre-treatment, the same saturator was saturated with CO.
4.1.2.2 Spectrometer
It is important to choose an integration time, for which the signal is under the detectors saturation limit. Trial and error shows that an integration time of 50 ms was optimal to maintain a stable signal.
4.2 CuCl solution
Copper(I) is an unstable oxidation state of copper and will easily oxidize to copper(II), consequently it is necessary to improve the preparation of the solution and study for how long it stays stable [23].
4.2.1 Solution preparation
Previously, the solution with a concentration of 2.5 mmol/l CuCl was prepared by first adding CuCl to the water and then to HCl solution. Also, the first experiments were done
26
using old copper chloride (90% purity). The colour of the powder was green instead of a white/grey colour indicating the presence of copper (II).
From the literature, the behaviour of cuprous chloride in water solutions depends on the pH of the solution; it can form different components depending on the pH value of the solution. Solution with low pH, CuCl reacts with HCl [24, 25]. In the UV-Vis spectrum of CuCl/HCl two main peaks around 220-230 and 270-280 nm are observed [26].
Moreover, since CuCl is easily oxidized to CuCl2 it is better understanding of Cu (II)
complexes. CuO and CuCl2 can be the complexes formed in the solution [27]. Although, the
complex formation is out of the scope of this thesis. The main goal was to see if linear and reproducible correlation is observed between CuCl and CO.
Keeping this in mind and knowing the complexity of the solution with the same concentration of CuCl, changes in the preparation of the solution were made to prevent the contaminations and obtain the same signal. New Copper(I) Chloride (99% purity) was used and preserved in a glove box under N2 atmosphere to prevent the oxidation of copper(I). The
details related to preparation refer to section 3.3.1.
4.2.2 CuCl signal
First measurements were made using the old CuCl which was not preserved under nitrogen and added to the saturator with a different procedure.
27
As can be seen in figure 20, the main peaks of the CuCl solution for older and new powder is observed at different peak positions. The left side the first main peak is after 230 nm which in the right side is before 230 nm. The same happens in the second peak. Also, the relative intensity of the main peaks is different.
4.2.3 CuCl stability
Since the CuCl solution can form different complexes (between CuCl/HCl and water) it is necessary to study for how long the signal is stable and it is possible to do measurements with the same solution.
Figure 21 - CuCl spectrum collected on different days
From figure 21, it is clear that the solution is stable over time. The absolute absorbance changes over the days because of external factors. However, the peak position and the relative intensity of the peaks including the shoulder band in the range 280-290 nm remains stable with time. It must be noted that the first day of the solution preparation, the relative intensity was slightly different indicating the solution is not stable yet (different relative intensity) and hence measurements shouldn’t be performed the same day as solution preparation. 200 220 240 260 280 300 -0.5 0.0 0.5 1.0 1.5 Absor ba nce Wavelength (nm) 1st day 13th day 14th day 20th day 21st day CuCl solution
28
4.3 Interaction between CuCl solution and CO
The procedure to measure the interaction between CuCl and CO was performed like explained in section 3.3.2.2., the same empty reactor measuring the wavelength over time. The signal response was collected for different percentage of CO, as represented in figure 22. After the measurement (switching back to CuCl flow only), the changes observed on introduction of CO disappear. The CuCl spectra before and after measurements were observed to be similar.
Figure 22 - Representation of the absorbance (284 nm) with time
4.3.1 CuCl and CO interaction overtime
As discussed in previous section 4.2.3 that CuCl stability is important and the absolute absorbance changes over the days, it is important to investigate the interaction of CuCl with CO is reproducible when experiment is preformed at different days. From figure 23, it is clear the interaction is similar and reproducible.
0 20 40 60 80 100 120 140 160 180 200 220 240 260 280 300 320 0.05 0.10 0.15 0.20 0.25 0.30 0.35 0.40 0.45 0.50 0.55 Absor ba nce Time (min) 100% CO 80% CO 50% CO 30% CO 0% CO
29
Figure 23 - Interaction of CuCl solution and CO with the same CO percentage measured in different days
4.3.2 Calibration curve
Figure 24 - Comparing CuCl signal with different percentage of CO
The signal for the calibration curve was measured with 0, 30, 50, 80 and 100 %CO diluted with Helium and with a concentration of 2.5 mmol/l CuCl.
Figure 24 demonstrates a clear linear relation between CuCl signal and CO. Moreover, the introduction of CO increases the intensity of the main CuCl peaks and no shift in peak position was observed on introduction of CO. On the other hand, new shoulder band was observed around 290-300 nm with the introduction of CO.
200 220 240 260 280 300 -0.2 0.0 0.2 0.4 0.6 0.8 1.0 1.2 1.4 1.6 280 285 Abso rbance wavelength (nm) cucl 30 % co 50 % co 80 % co 100 % co 274
30
Two wavelengths were chosen for the calibration curve, to prove that independent of the wavelength chosen the interaction of CuCl with CO is linear (figure 25). A linear relation between the absorbance and CO percentage was observed with a R2 of 0.99 and the results
are reproducible as a function of CO concentration.
Figure 25 - Calibration curve of absorbance (274 and 285 nm) with respect to CO concentration
4.3.2.1 CO solubility in water
From Henry´s law it is possible to calculate the solubility of CO in water which change with different percentages of CO diluted with He [28]. The solubility of CO in water was calculated at 21ºC which is the average temperature of the laboratory and at total pressure of 1 atm (appendix 2 explanation of CO solubility with temperature).
4.4 Catalyst characterization
For an accurate calculation of the dispersion it is necessary to optimize the amount of catalyst, percentage of CO and wavelength that should be used to obtain reliable values. After the optimization two different catalysts were tested to determine the dispersion. The first one is palladium on gamma alumina to compare the dispersion with different particle sizes. The second one is a catalyst with hydrophilic (palladium in gamma alumina) and
0.0000 0.0002 0.0004 0.0006 0.0008 0.0010 0.0 0.1 0.2 0.3 0.4 Abso rbance Concentration (mol/L) Calibration Curve (285 nm)
31
hydrophobic (FOTS in gamma alumina) domains. The hydrophilic domain is the palladium (active metal sites) and he hydrophobic domain is created using FOTS (perfluoronates octyltrichlorosilane).
4.5 Data analysis
One of the wavelengths used is 274 nm which corresponds to one of the main peaks from the spectrum (CuCl/CO interaction), because it has a higher difference between CuCl response and CO and consequently a lower probability of errors in the calculations and clear interaction. The other one is 285 nm which belongs to the shoulder band and it is where CuCl solution is more stable over time (figure 22).
CO percentage and amount of catalyst must be optimized to balance time for the saturation and the integration area necessary to obtain reliable values. Decreasing the amount of catalyst the saturation time will decrease. Likewise, the percentage of CO also influences the time for the saturation of the catalyst, higher CO percentage will take less to saturate. Consequently, the integration area will decrease and hence increasing the probability of errors.
4.5.1 Catalyst A
First a catalyst with just metal (Pd) loading will be used to be able to compare the dispersion results with gas phase.
4.5.1.1 Percentage of CO vs Dispersion
The particle size used was 300-425µm. First runs were performed with 100 mg catalyst, which takes more than one hour to saturate the catalyst and hence is not possible to finalize experiment in a day. The final catalyst (Pd/γ-Al2O3) amount used was around 30 mg as it has high dispersion (> 50%). To prevent wasting the catalyst, it is recommended to have a prior knowledge (a rough estimate) of the catalyst particle size. Therefore, if the catalyst has low dispersion more catalyst should be used to increase the integration area.
32
Figure 26 - Representation of the concentration with time using wavelength 274 nm and 75% CO of Palladium on gamma alumina catalyst with 425 – 300 µm
Figure 27 and figure 28 represent the concentration profile over time using different wavelengths. A CO percentage of 75% was used, the saturation occurs fast, consequently, the response with catalyst crosses the blank response, making it difficult to see when the signal is stable (appendix 3 absorbance response). One of the reasons for using two wavelengths is to compare both responses and define where the value is considered stable, because both should stabilize at the same time.
Figure 27 - Representation of the concentration with time using wavelength 285 nm with 75% CO of Palladium on gamma alumina catalyst with 300-425 µm
0 10 20 30 40 50 60 70 80 -0.0001 0.0000 0.0001 0.0002 0.0003 0.0004 0.0005 0.0006 0.0007 0.0008 274 nm Time (min) Con centration (m ol/L) Blank Catalyst -10 0 10 20 30 40 50 60 70 80 -0.0001 0.0000 0.0001 0.0002 0.0003 0.0004 0.0005 0.0006 0.0007 0.0008 285 nm Absor ba nce Time (min) Blank Catalsyt
33
Comparing both figures 29 and 30, the integration time used for calculating the quantity of CO adsorbed was between 15 and 40 minutes (dashed black line). After these results, the percentage of CO was decreased to increase the area of integration and compare values of the dispersion between the ones calculated with 75% CO.
Figure 28 - Representation of the concentration with time using wavelength 274 nm 50% CO of Palladium on gamma alumina catalyst with 300-425 µm
Figure 29 - Representation of the concentration with time using wavelength 285 nm with 50% CO of Palladium on gamma alumina catalyst with 300-425 µm
0 20 40 60 80 -0.0001 0.0000 0.0001 0.0002 0.0003 0.0004 0.0005 0.0006 Con centration (m ol/L) Time (min) Blank Catalyst 274 nm 0 20 40 60 80 0.0000 0.0001 0.0002 0.0003 0.0004 0.0005 0.0006 Time (min) Con centration (m ol/L) Blank Catalyst 285 nm
34
Figures 28 and 29 represents the concentration profile over time when using 50% CO. The time for saturation increased and it is easier to see where the saturation time is enough. Table 2 shows all the values of the dispersion of palladium on gamma alumina with the same particle size from figures 26 to 29.
Table 2 - Dispersion in aqueous phase using different percentage of CO
Comparing different percentages of CO, the dispersion values with the wavelength 274 nm are similar. However, using the 285 nm wavelength the probability of error increases. The reason could be that at 285 nm wavelength there is a shoulder band in the spectrum, where the intensity can be strongly influenced by the main peaks and hence we can observe unstable signal and hence get inaccurate integration area for dispersion calculation.
4.5.2 Noise errors
From the figures used to calculate the dispersion, there are fluctuations on the final concentration values, which must be due to noise error in the signal. Therefore, the error between the maximum and minimum final concentrations should be considered, to know how much it influences the dispersion value. From figure 28 the saturation at lowest concentration (4.85x10⁻⁴ mol/l) and the highest (5.1x10⁻⁴ mol/l) were used for the calculations. The integral
area, and following the dispersion, were calculated. Figure 30 shows both graphs with the different assumptions for the saturation concentrations.
75 % 50 %
Pd/alumina 274 nm 285 nm 274 nm 285 nm
35
Figure 30 - Representation of the concentration with time using wavelength 274 nm with 50% CO of Palladium on gamma alumina catalyst with 300 – 425 µm
Table 3 represents the values obtained from the graphs. Comparing the value with the dispersion from the figure 30 which was 51% the maximum error percentage is 4%.
Table 3 – Error calculation
Higher concentration Lower concentration
Dispersion (%) 49 52,4
Error (%) 4.08 2.75
4.5.2.1 Catalyst dispersion with different particle size
The next step was to measure the dispersion using smaller catalyst particles size (125-250 µm) and compare it with the dispersion values obtained with bigger particle size. Figure 31 represents the concentration response with the smaller particle size. In appendix 4 there are values from different measurements.
36
Figure 31 - Representation of the concentration with time using wavelength 274 nm with 50% CO of Palladium on gamma alumina catalyst with 125 – 250 µm
In Table 3 all the dispersion values obtained with the different particle size fractions in aqueous phase and gas phase (data in appendix 5) are reported.
Table 4 - Dispersion of palladium on gamma alumina with 125-250 and 300-425 with 50 % CO in aqueous (274 nm) and gas phase
Pd/alumina particle size (µm)
Dispersion in aqueous phase (%)
Dispersion in gas phase (%)
0 - 38 70
125 - 250 66
300 - 425 51
Comparing the dispersion with different particle sizes, with bigger particle size the dispersion was less due to possible internal mass transfer limitation. Comparing the small fraction (125 - 250) with gas chemisorption analysis we observe comparable dispersion values, which is desirable since there is only metal loading in the catalyst. Results show that the setup can be a valid technique to measure the dispersion in aqueous phase. Also, in appendix 6 catalyst B values are described.
0 10 20 30 40 50 60 0.0000 0.0001 0.0002 0.0003 0.0004 0.0005 0.0006 Con centration (m ol/L) Time (min) Blank Catalyst 274 nm
37
4.5.3 Catalyst dispersion with hydrophobic/hydrophilic part
The catalyst with hydrophilic/hydrophobic sections was analysed, to see if there is a difference between gas and aqueous phase chemisorption.
4.5.3.1 50 % hydrophilic
In order to measure the dispersion of the catalyst the amount of catalyst was increased to increase the integration area. Figure 32 the concentration profile of the catalyst with a 1:1 ratio (hydrophilic/ hydrophobic) and a particle size range of 125-250 µm can be seen.
Figure 32 - The concentration profile over time using wavelength 274 nm with 50%CO of Palladium on gamma alumina catalyst with 125 – 250 µm
The value of the dispersion was 47%, which is much lower than observed for 100 % hydrophilic catalyst (66 % dispersion). One of the reasons could be inhomogeneous distribution of hydrophilic/hydrophobic part. Consequently, a large hydrophobic part can be at the surface of the catalyst next to the liquid bulk limiting the accessibility of the active metal sites in the hydrophilic part. Also, the introduction of the hydrophobic part causes difficulties in the interaction of water in the reactor. The catalyst with 50 %hydrophobic has a very weak affinity for the water, causing the catalyst to aggregate and hence creating a free path for the water to flow around the catalyst rather than through the catalyst.
10 15 20 25 30 35 40 45 0.0000 0.0001 0.0002 0.0003 0.0004 0.0005 0.0006 Conce ntr atio n ( mo l/L) Time (min) Blank Catalyst 274 nm
38
4.5.3.2 80 % hydrophilic
Figure 33 shows the interaction of the catalyst with gas phase; gas bubbles surround the catalyst. Although, it is possible by vacuum to remove the gas bubbles, there is no certainty that all the gas bubbles are removed. Consequently, the dispersion obtained may not be reliable. Hydrophobic part will always maintain gas bubbles between the catalyst and liquid phase.
Figure 33 - Catalyst interaction with gas phase – bubbles creation
To overcome the pressure build up due to the gas bubbles two approaches were applied. To decrease the packing density by using the glass beads (appendix 7) as well as to use vacuum to remove bubbles from the reactor.
The introduction of the glass beats did not help with pressure build up. A reason could be because forcing the catalyst to interact with liquid, the glass beats will separate from the catalyst (higher density) and, consequently, the distribution is no longer homogeneous anymore not helping the water to interact with catalyst. On the other hand, using the vacuum was possible to prevent the pressure to build up and force the interaction between catalyst and the liquid phase.
39
5 Conclusion
The goal of this research was to optimize and develop a valid chemisorption method to determine the available active surface area in the aqueous phase. It is possible to calculate the dispersion using this technique, although it is necessary some improvements and attention to obtain reliable values. The signal from the spectrometer is sensitive. Hence, the reason for an unstable signal was the pressure build up and, consequently, there was not a continuous flow on the system. The pressure was built up as a result of the tubbing material in the debubbler which was changed for a flexible material. Also, the separation of the gas/liquid phase on the debubbler influences the stability of the signal which should be checked regularly. Also, the way that the different flows and phases are mixed influence the stability of the flow. First, should be the CO with CuCl to be mixed then the gas bubbles. Moreover, the size of the filter porous from the reactor are important for the performance of the CO interaction with the catalyst. The size of the pores should be bigger than the particle size of the catalyst to avoid the catalyst particles to be stuck in the filter.
The copper chloride powder should be preserved under nitrogen conditions to avoid contaminations. Also, the procedure of how to prepare the solution has influence on the solution composition and consequently the spectrum obtained. Stability of the solution and CO/CuCl interaction is proved to stay steady over time.
Ideally it should be possible to calculate the dispersion with all of the wavelengths, although the wavelength chosen is 274 nm which represents the more stable response time and reproducible values. The optimized CO percentage is 50% comparing the time for the saturation and integration area.
Initial absolute absorbance using the reactor with catalyst and, afterwards, the empty reactor was not the same. The reasons could be due to external perturbations.
For the calculation of the dispersion two different catalyst were used. The first one was palladium on gamma alumina which the value of the dispersion was calculated in aqueous using two different particle sizes. In the range of 300-425 µm the dispersion was 51% and in the range 125-250 µm the dispersion was 66%. The difference between them is due to the mass transfer limitations, in the bigger particles size not all the particles size are available for adsorption. Comparing with the gas chemisorption which the result was 70%, then it is proved that it is possible to calculate the dispersion in liquid phase with just metal loading. Temperature and noise should be considered, because then influence dispersion values.