FACULDADE DE ODONTOLOGIA
Murilo Navarro de Oliveira
Análise comparativa de mensurações
utilizando microscópio óptico, microscópio
eletrônico de varredura e microtomografia
computadorizada
Comparative analysis of optical microscopy,
scanning electron microscopy and
micro-computed tomography on measurements
UBERLÂNDIA
Murilo Navarro de Oliveira
Análise comparativa de mensurações
utilizando microscópio óptico, microscópio
eletrônico de varredura e microtomografia
computadorizada
Comparative analysis of optical microscopy,
scanning electron microscopy and
micro-computed tomography on measurements
Trabalho de conclusão de curso
apresentado
a
Faculdade
de
Odontologia da UFU, como requisito
parcial para obtenção do título de
Graduado em Odontologia
Orientador: Prof. Dr. Célio Jesus do
Prado
UBERLÂNDIA
Agradecimentos
Aos meus professores, em especial a meus orientadores, Dr. Célio Jesus do Prado, Dra. Letícia Davi e Dr. Flávio Domingues das Neves pela confiança disposta a mim ao aceitar o meu pedido de ser seu orientado nesse trabalho, a consideração e dedicação durante esse tempo.
Ao meu amigo e orientador de iniciação científica Frederick, pela disposição em ajudar, pela paciência, e pelo apoio em todos os momentos, sendo fundamental para a construção desse trabalho e para minha formação acadêmica.
Aos meus pais agradeço ao apoio durante toda a jornada e por sempre me apoiarem incondicionalmente, desde as primeiras viagens, vestibular, mudança de curso, até o dia da minha formatura.
Aos projetos de extensão que participei, ao grupo NEPRO, e a minha pesquisa de iniciação científica, que foram fundamentais para minha experiência dentro da universidade.
Ao curso de odontologia, por ter me tornado uma pessoa realizada e feliz, e a Universidade Federal de Uberlândia pela oportunidade de fazer parte do curso.
SUMÁRIO
Resumo
06
Introdução
07
Matrial e métodos
08
Resultados
09
Discussão
09
Conclusão
10
Referências bibiliográficas
11
Figuras
13
Tabelas
15
Análise comparativa de mensurações utilizando microscópio óptico,
microscópio eletrônico de varredura e microtomografia computadorizada.
Comparative analysis of optical microscopy, scanning electron microscopy and
micro-computed tomography on measurements.
Frederick Khalil Karam¹; Murilo Navarro de Oliveira²; Caio César Dias
Resende³; Thiago de Almeida Prado Naves Carneiro
4; Karla Zancopé
5; Flávio
Domingues das Neves
6; Célio Jesus do Prado
71. Doutorando e mestre em Odontologia pela Universidade Federal de Uberlândia.
2. Graduando em Odontologia pela Universidade Federal de Uberlândia. 3. Doutorando e mestre em Odontologia pela Universidade Federal de
Uberlândia.
4. Pós–doutorando, doutor e mestre em odontologia pela Universidade Federal de Uberlândia.
5. Professora e pós-doutoranda em Odontologia pela Universidade Federal de Uberlândia. Área de Reabilitação Oral e prótese removível.
6. Professor pela Universidade Federal de Uberlândia. Área de Reabilitação Oral e prótese fixa.
7. Professor pela Universidade Federal de Uberlândia. Área de Reabilitação Oral e prótese fixa.
Autor de correspondência:
Prof. Dr. Flávio Domingues das Neves
Universidade Federal de Uberlândia, Faculdade de Odontologia, Departamento de oclusão, prótese fixa e materiais dentários,
Avenida Pará, 1720, Bloco 4L, Anexo A, Sala 42, Campus Umuarama. Uberlândia - Minas Gerais – Brasil, CEP. 38405-320
Abstract
Microscopic measurements are widely used in scientific research and the correct equipment to realize these evaluations could be critical to determine the study results. Regarding microscopic measurements, three of the most used methods are: Optical Microscopy (OM), Scanning Electron Microscopy (SEM.), and Micro-computed Tomography (MCT). It is important to select which is the best method for assessing diverse parameters, considering the operational characteristics of the method, the equipment efficiency, and the machinery cost. Therefore, the main objective of this study was to define which is the most useful measurement method for assessing magnitudes below 0.55mm. Ten dental implants, with known dimensions as defined by the manufacturer were randomly distributed. Two blinded observers assessed the distance between the second and the third screw vortex of the implants using the three suggested methods. The true distance was defined to be 0.6mm. The assessed distances were. 0.597±0.007 for OM, 0.578±0.017 for SEM, and 0.613±0.006 for MCT. The assessed distances were significantly different when the methods were compared (P>0.01). Despite these differences, all measurements were between the CAD system tolerance, defined to be within 0.05mm. It was possible to conclude that linear measurements below 0.55mm can be performed by any of the described methods.
1 Introduction
The application of the correct measurement method for microscopic analysis on scientific research is crucial to obtain reliable values, which will not cause distortions on investigation results.1,2 This decision will diverge according to the study objectives and
the material to be evaluated.3 Some other variables should be considered to final
decision, like operator dexterity with the equipment, apparatus disposition and machinery operation cost; however this aspects could not interfere on results trustworthiness.4,5 Before adopting any technology, the operator needs to consider the
main objective of the study and what part of the sample must be analysed.6,7 The
election of an inadequate measurement technique may lead to an excess of redundant statistics, and consequently poor time performance; or lack of necessary data, making an inconclusive study.8
Among diversified researches, Dentistry, and specifically Implant Dentistry requires micrometric examinations to define security measurements. Implant manufacturing, requires meticulous and preciseregulations.9,10 Measurements and
surface analysis at lower scales of the dental implants and their fitting components during their fabrication should be severally reliable to ensure a satisfactory piece seating and consequently, the rehabilitation biomechanical success.11,12 Therefore, the
correct methodology application during the implant manufacturing by the producer are directly connected to the therapy prosperity.13
In dispersion through the most used approaches to realize micrometric analysis are: Optical Microscope (OM), a two-dimensional evaluation method that uses a series of glass lenses to create a limited magnification, is widely used for surface quantitative mensuration.12,14 Scanning Electron Microscope (SEM), an electronic microscope that
could provide surface images with high resolution and magnification15,16 and
Micro-Computed Tomography (micro-CT), a non-destructive method that allows high-resolution tridimensional analysis, without damaging the sample.17
Therefore, the aim of this study was to evaluate the three method’s precision,
Initially, two evaluators were randomly recruited to perform the measurements of all tested methodologies. These evaluators did not know what they would evaluate and were calibrated by ruler measurements. For greater fidelity, 45 days were determined between each methodology. Ten dental implants (Titamax 3.75mm x 13mm; Neodent, Curitiba, Brazil) were selected for this study, and distance between vertex to vertex from the second to the third screw was chosen to be measured in all methods described below.
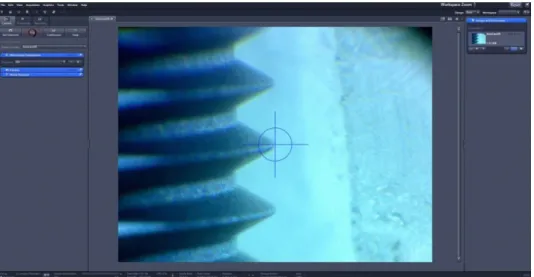
2.1 Optical Microscope (OM)
The samples were fixed in an Optical Microscope (Mitutoyo TM-500, Tokyo, Japan) to perform the implant mensuration. This is a monocular microscope with two digital micrometers and0.001 resolution. The equipment has objective lenses with 2x magnification and ocular lenses with 20x magnification, resulting in a 40x enlargement. The microscope has a holder over all the samples that allow the positioned sample to move over the X and Y-axes, during the mensuration (Fig. 1).
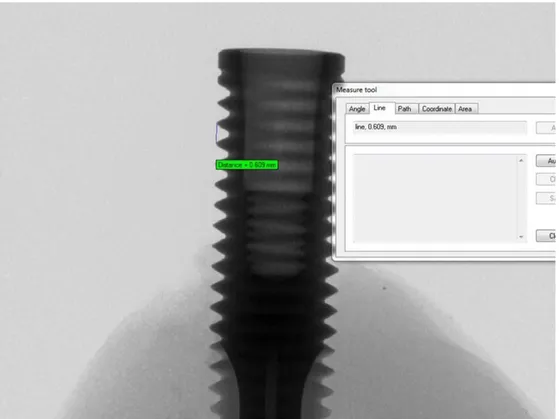
2.2 Scanning Electron Microscope (SEM)
The SEM used in this study (Hitachi, Chiyoda-ku, Tokyo, Japan) operates in different pressure conditions, controlled by a computer using the Windows operational system (LOQUIF software, Leo User Interface, Carl Zeiss, Oberkochen, Germany). Magnification of 150x was applied. The measurements were realized directly on the equipment software (Fig. 2).
2.3 Micro-computed tomography (micro-CT)
Two blinded evaluators performed all measurements, and the mean values of each sample were considered for statistical evaluation (Sigmaplot 12.0, Systat Software Inc, USA). The data were initially submitted to the variance homogeneity and
normality tests (α=0.05). To compare all groups, the Anova One Way statistical method
was applied before the Tukey Test. To compare each group with the CAD (control group), the t-test was applied.
A qualitative sequential evaluation was also applied, to define if the values were
into a confidence interval, defined by implant’ manufacturer. The control group was
considered by the CAD image of the tested implant, provided by manufacturer.
3 Results
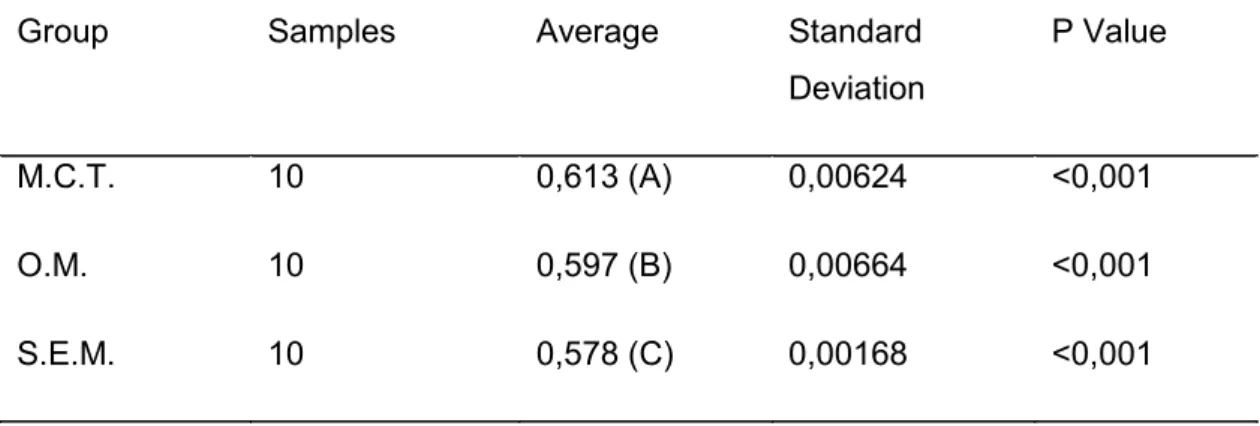
The mean values of all methodologies, between the two evaluators, are shown in Table 1. There were statistical differences between all tested methodologies. However, according to a qualitative sequential evaluation, all methodologies presented acceptable values, when comparing to the CAD (control group), according to Table 2.
4 Discussion
The null hypothesis that, there was no statistic difference between all evaluated methodologies presenting all values into a confidence interval, was reject. The results demonstrated in Table 1 prove that there is statics difference between the three tested groups. However, all values were into a fabrication tolerance, defined by manufacturer. According to a previous study, 18 the OM is the best methodology to superficially
measure the spaces. The OM demonstrates lower spatial resolutions, making it difficult the using for analysis of ultrafine deformations and strain measurements.19 It is the
cheaper technology compared to the other methods, and is easy handling equipment, which does not, requires a special training to use it. For these reason this methodology could be indicated technology to external analysis with values until 0.55mm.
The SEM is an alternative methodology that produces high-resolution images down to the nanometer scale and provides trustworthy measurement data using image analysis methods, such as digital Image correlation.16 In meantime, alerts that SEM
images are usually contaminated with distortions and drift aberrations that could disturb the accuracy of imaging and measurement.19 To analyze organic materials, such as the
to use this equipment, once the samples preparing and readout were more complicated compared with the other technologies. The machinery price would not justify the using for analysis until 0.55mm. However, for measurements below this value, some studies presents advantages to this equipment.20 As there were no tests with values under
0.55mm in this work, more details could not be discussed.
According to the literature, Micro-CT is a faster method that limits the manual error that occurs using the OM, which is an optically based measurement, being susceptible to human failures.21 Besides that, the Micro-CT technology can extract 3D
information, different of the 2D information obtained in optical measurements. The quality of Micro-CT images, and the advantages of being a non-damage technique proposing this technology utilization to quantify mistakes on techniques with less image quality.22 But is a methodology used only on in vitro studies, despites the high radiation
and the time spent on scanning, reconstruction and measurement; making this technology impracticable during the clinical routine.23 Instead the related works
affirms21, our study shows that Micro-CT method takes more scanning time than the
other methodologies, moreover, is an expensive equipment, which limits the utilization for large scale measurements. The convenience observed using microtomography is the possibility to realize internal analysis without damaging the samples.24 In this work
there was no advantage with this equipment utilization, once this technology requires specifically preparation and is an expensive machinery compared with the OM.
The statistical differences found at the present study makes it impossible to compare the three methodologies, although all measurements obtained are in the manufacturing tolerance, it could not be considered as accurate. Considering the results of this study, any methodology can be used to measure values larger than 0.55mm. So, authors should choose the methodology passed in two different parameters: first, the most familiar methodology to researcher and second, less cost and time to be done. In addition, the SEM image quality and the non-destruction of samples in Micro-CT are determinant in the results. Future studies could evaluate the influence of methodologies in smaller measurements with values below 0.55mm.
5 Conclusion
can be performed by any of the described technologies, considering that there is an error tolerance between 0.05mm more and less.
6 References
1. Chatburn RL. Evaluation of instrument error and method agreement. AANA J. 64(3), 261-268 (1996).
2. Ludbrook J. Statistical techniques for comparing measurers and methods of measurement: a critical review. Clinical and experimental pharmacology & physiology. Epub 2002;29(7):527–36. (2002).
3. Landis JB, Ventura KL, Soltis DE, Soltis PS, Oppenheimer DG. Optical Sectioning and 3D reconstructions as an alternative to scanning electron microscopy for analysis of cell shape. Appl. Plant Sci. 3:1400112. 10.3732/apps.1400112 (2015). 4. Karras DJ. Statistical methodology: II. Reliability and validity assessment in study
design, Part B. Acad. Emerg. Med. 4 (2), pp. 144–147 (1997).
5. Watson PF, Petrie A. Method agreement analysis: a review of correct methodology. Theriogenology. 73:1167–1179. (2010)
6. White SA, van den Broek NR. Methods for assessing reliability and validity for a measurement tool: a case study and critique using the WHO haemoglobin colour scale. Stat Med. 23(10):1603–1619 (2004).
7. Edwards R. Two-dimensional convolute integers for analytical instrumentation. Anal. Chem. 54:1519-1524 (1982).
8. Shaw DE, Jones HS, Moseley MJ. Analysis of method-comparison data. Ophthalmic Physiol Opt. 14(1):92-6 (1994).
9. Gaviria L, Salcido JP, Guda T, Ong JL. Current trends in dental implants. J Korean Assoc Oral Maxillofac Surg. 40:50–60. (2014).
10. Tomsia AP, Launey ME, Lee JS, Mankani MH, Wegst UGK, Saiz E.
Nanotechnology approaches for better dental implants. Int J Oral Maxillofac Implants. 26:25–49 (2011).
11. Brånemark P-I, Zarb GA, Albrektsson T. Tissue-integrated prostheses. 1st ed. Chicago: Quintessence; 352 p (1985).
12. Faria KO, Silveira-Junior CD, Silva-Neto JP, Mattos MGC, Silva MR, Neves FD. Comparison of methods to evaluate implant-abutment interface. Braz. J. Oral Sci. 12(1), 37-40 (2013).
component fit over time. J Prosthet Dent. 89: 346-51 (2003).
15. Hultin M, Komiyama A, Klinge B. Supportive therapy and the longevity of dental implants: a systematic review of the literature. Clin Oral Implants Res. 18(Suppl 3): 50-62 (2007).
16. Neves FD, Elias GA, Silva-Neto JP, Dantas LCM, Mota AS, Neto AJF. Comparison of implant-abutment interface misfits after casting and soldering procedures. J Oral Implantol. Apr;40(2):129-35 (2014).
17. Finelle G, Papadimitriou DE, Souza AB, Katebi N, Galucci GO, Araújo MG. Peri-implant soft tissue and marginal bone adaptation on Peri-implant with non-matching healing abutments: micro-CT analysis. Clin Oral Implants Res. Apr;26(4):e42-6. (2015).
18. Katsoulis J, Merickse-Stern R, Rotkina L, Zbären C, Enkling N, Blatz MB. Precision of fit of implant supported screw-retained 10-unit computer-aided-designed and computer-aided-manufactured frameworks made from zirconium dioxide and titanium: an in vitro study. Clin Oral Implants Res. 25:165-17 (2012).
19. Jin P, Li X. Correction of image drift and distortion in a scanning electron microscopy. J Microsc. Dec;260(3):268-80 (2015)
20. Groten M, Axmann D, Pröbster L, Weber H. Determination of the minimum number of marginal gap measurements required for practical in-vitro testing. J Prosthet Dent. 83(1):40-9. (2000).
21. Kline TL, Zamir M, Ritman EL. Accuracy of microvascular measurements obtained from micro-CT images. Annals Biomed. Eng. 2010;38:2851–2864 (2010).
22. Mangione F, Meleo D, Talocco M, Pecci R, Pacifici L, Bedini R. Comparative evaluation of the accuracy of linear measurements between cone beam computed tomography and 3D microtomography. Ann Ist Super Sanita. 49(3):261-5. (2013). 23. Özkan G, Kanli A, Başeren NM, Arslan U, Tatar I. Validation of micro-computed
tomography for occlusal caries detection: an in vitro study. Braz. Oral Res. 29(1), 1-7 (2015).
24. Grande NM, Plotino G, Gambarini G, Testarelli L, D’Ambrosio F, Pecci R, et al.
Present and future in the use of micro-CT scanner 3D analysis for the study of dental and root canal morphology. Ann Ist Super Sanita. 48:26–34 (2012). 25. Neves FD, Prado CJ, Prudente MS, Carneiro TA, Zancope K, Davi LR.
design/computer-aided manufacturing crowns with different Methods of virtual model acquisition. Gen Dent. May-Jun;63(3):39-42 (2015).
7 Figures
8 Tables
Group Samples Average Standard Deviation
P Value
M.C.T. 10 0,613 (A) 0,00624 <0,001
O.M. 10 0,597 (B) 0,00664 <0,001
S.E.M. 10 0,578 (C) 0,00168 <0,001
Table 1: Dental implants vertex-to-vertex average and standard deviation evaluation. Letters between parenthesis demonstrate statistical differences.
Group Minimal Value Maximal Value
Control 0,550 0,650
O.P.T.(A) 0,588 0,607
M.E.V.(A) 0,560 0,611
M.C.T.(A) 0,604 0,617