THIS
DOCUMENT
IS
NOT
AN
INVESTMENT
RECOMMENDATION
AND
SHALL
BE
USED
EXCLUSIVELY
FOR
ACADEMIC
PURPOSES
(SEE DISCLOSURES AND DISCLAIMERS AT END OF DOCUMENT)See more information at WWW.NOVASBE.PT Page 1/27
M
ASTERS IN
F
INANCE
E
QUITY
R
ESEARCH
40 60 80 100 REN PSI 20§ REN’s net profit grew 2,6% in 2012, despite the fact that REN
operates exclusively in the energy sector in Portugal, a country in a deep crisis with a decreasing energy consumption. REN’s results were possible because it operates in a regulated market with its allowed revenues for the year calculated independently of how much energy REN is transmitting.
§ The regulatory framework does not give room for REN to grow significantly in Portugal, even in a situation where the energy market recovers.
§ Future growth opportunities should come from international
operations, either through mergers and acquisitions or greenfield but
no relevant investment happened so far.
§ We value REN at €2,19 per share and our recommendation is to hold. We believe REN is a good investment proposal on the
long term considering its stable results and the good dividend yield. In our opinion REN is a low risk investment, as can be confirmed by the fact that rating agencies upgraded REN’s rating above the one from Portuguese Republic.
Company description
REN is the owner and operator of the Portuguese transmission systems of electricity and natural gas. REN has the monopoly for these activities and is regulated by ERSE. Presently REN only has operations in Portugal.
“R
ENR
EDESE
NERGÉTICASN
ACIONAIS”
C
OMPANYR
EPORT“U
TILITIES”
03
J
UNE2013
S
TUDENT:
“M
ADALENAR
ICARDO”
M
ASTER INF
INANCE;
STUDENT#496
[email protected]
Looking for opportunities
Living with the Regulation in the meanwhile
Recommendation: HOLD Vs Previous Recommendation HOLD Price Target FY12: 2.19 € Vs Previous Price Target 2,22 € Price (as of 3-Jun-13) 2,237 €
Reuters: RENE.LS, Bloomberg: RENE PL
52-week range (€) 2.40-1.91 Market Cap (€m) 1.195,626 Outstanding Shares (m) 534 Source: Bloomberg
Source: Bloomberg
(Values in € millions) 2012 2013E 2014F Operating Income 811 907 917 EBITDA 512 523 545 Net Profit 124 112 113 EPS 0,23 0,21 0,21 CAPEX 201 283 267 D&A 197 213 231 RAB 3442 3512 3549 Net Profit 124 112 113 Dividends 0,168 0,169 0,170 Source: Company Data and Nova Research Team
REN COMPANY REPORT
THIS
DOCUMENT
IS
NOT
AN
INVESTMENT
RECOMMENDATION
AND
SHALL
BE
USED
EXCLUSIVELY
FOR
ACADEMIC
PURPOSES
(SEE DISCLOSURES AND DISCLAIMERS AT END OF DOCUMENT)PAGE 2/27
Table of Contents
Company overview ... 3
Company description: ... 3
Shareholder structure ... 5
Macroeconomic Overview ... 6
Energy Market ... 7
Electricity sector in Portugal ... 8
Natural gas sector in Portugal ... 9
Portuguese Regulation ... 10
Valuation ... 13
Discount Rate ... 13
Electricity ... 14
Natural Gas ... 16
Others ... 18
Sum of the parts ... 19
Scenarios Considered ... 19
Sensitivity Analysis ... 21
Debt Analysis ... 23
Attractive Multiples ... 24
Appendix: ... 24
REN COMPANY REPORT
THIS
DOCUMENT
IS
NOT
AN
INVESTMENT
RECOMMENDATION
AND
SHALL
BE
USED
EXCLUSIVELY
FOR
ACADEMIC
PURPOSES
(SEE DISCLOSURES AND DISCLAIMERS AT END OF DOCUMENT)PAGE 3/27
REN
Electricity National Transmission Grid National Electrical System Management Gas Storage Transport Regasi8ication Others Rentelecom Consultancy and Comercial Services Enondas Figure 1 – Organizational ChartSource: Company Data
Company overview
Company description:
Redes Energéticas de Portugal – REN, is a listed Portuguese company that manages
energy transmission systems, electricity and natural gas, in Portugal. REN is one of
the few Transmission System (TSO) in Europe that integrates both electricity and natural gas infrastructures in its operations.
Until 1994 the electricity transmission activities in Portugal were performed by EDP, at the time a fully integrated electricity company. In 1994 REN was created as a result of the unbundling of the energy sector in Portugal, and in 2000 REN was separated from
the EDP group. By this time REN was only operating in the electricity business. In 2006
REN was given three concessions to operate in the natural gas sector and acquired the corresponding regulated natural gas assets from GALP Energia; the
high-pressure pipelines, the LNG terminal and the underground storage facilities.
The operations of REN are basically to assure the transmission of energy, on the account of the companies that commercialize that energy – REN receives, either electricity or natural gas at an entry point and redelivers that energy to the same company at an exit point. REN has the monopoly of its activities and therefore is
regulated. REN’s clients are EDP; GalpEnergia, Endesa, Iberdrrola, GasNatural
Fenosa and a few other smaller operators, as can be seen from the market share data shown in figure 1.1.
Since REN operates in a Regulated market, its investment plans must be subject to
the regulator’s scrutiny (ERSE- Entidade Reguladora dos Serviços Energéticos) and approved by the Ministry of the Economy. The regulator also defines the allowed
revenues for the year, which depend on the amount of regulatory asset base. For this reason the CAPEX plan is of extreme importance on REN’s value.
Despite the fact that most of the company’s activities are the management of the infrastructures’ concessions, REN also includes in its operations RENTELECOM, REN trading, and a participation of 35% in OMIP SGPS.
In the electrical power operations are included the very high voltage transmission grid, the overall management of the national electrical system (GTS – Gestor Técnico do Sistema) of which REN has the concession until 2057; and Enondas - concession for the operation of the generation of electricity from wave energy until 2055.
Source: Company Data
Figure 1.1- REN’s Clients (electricity) !"#$%&'( !)*+,-( ./+0*0&1-( 23(4+)&,-( 256#( 57#8( 489:.5( 8;<0&,(
REN COMPANY REPORT
THIS
DOCUMENT
IS
NOT
AN
INVESTMENT
RECOMMENDATION
AND
SHALL
BE
USED
EXCLUSIVELY
FOR
ACADEMIC
PURPOSES
(SEE DISCLOSURES AND DISCLAIMERS AT END OF DOCUMENT)PAGE 4/27
Highest rating on PSI 20
In the natural gas sector the company holds three different operating companies, in order to provide three different services, under three concession agreements with the Portuguese state:
• The reception, storage and regasification of the LNG (Liquified Natural Gas) at Sines Terminal through REN Atlântico;
• The transportation of Natural Gas, through REN Gasodutos, holding the concession on the Gas Transportation Grid, which is a high-pressure transmission Network.
• The storage of natural gas in a salt dome in Carriço, through REN Armazenagem;
Ren will hold these natural gas concessions until 2046.
Ren Trading was created to purchase, sale, import and export electricity as part of the management of two long-term power purchase agreements. In order to have
access to a more liberalized market of electricity, and create an auction system for electricity, a Decree-Law 172/2006 was made to promote the termination of the Power Purchase Agreements (PPAs). However there were two power stations -Turbogás and Tejo Energia, that did not approve such early termination of their PPAs. REN, through REN trading, was therefore granted the obligation to manage these PPAs until their maturity. The management of these contracts is also regulated by ERSE, which guarantees that REN Trading will not enter into losses. We assume that once the maturity of these contracts is reached REN Trading will not have any operations.
Apart from the above activities, all regulated by ERSE, REN owns RENTELECOM, which is a public telecommunications network operator, and it also has a participation
of 35% in OMIP SGPS which is to be reduced in the future to 10%. OMIP SGPS is the
Iberian Energy Derivatives Exchange MIBEL’s derivative market exchange operator. In 2012 REN has acquired a participation of 5% in “Cahora Bassa” hidro, which is its
first international venture. It has announced that it is analysing a number of
international projects, mostly in the Portuguese speaking countries related to its core
business of energy grid operator.
REN is actually the PSI20 Company with highest rating, (Ba3 according to Moody’s
and BB+ according to S&P), having a better rating than Portuguese Republic, even though it has no risk diversification in geographical terms. This is not unusual in companies that operate in regulated markets. Their betas are usually lower than 1(table 12 in appendix).
REN COMPANY REPORT
THIS
DOCUMENT
IS
NOT
AN
INVESTMENT
RECOMMENDATION
AND
SHALL
BE
USED
EXCLUSIVELY
FOR
ACADEMIC
PURPOSES
(SEE DISCLOSURES AND DISCLAIMERS AT END OF DOCUMENT)PAGE 5/27
Source: Company Data
Shareholder structure
Until 2007 REN was fully owned by the Portuguese state due to its strategic role in the energy sector of the country. In 2007, the Portuguese state started a privatization process with the IPO of 49% of REN’s shares. From this process it resulted a very dispersed shareholder structure, with only five qualified shareholders holding 5% of shares capital each.
In 2012 the Portuguese state sold another 40% of REN as a consequence of the financial programme agreed with “Troika” for the privatization of Public companies through a private placement, in which State Grid of China and Oman Oil acquired
25% and 15% of the shares, respectively.
The Portuguese state now holds a total of 11%, 10% directly through Parpública and 1% indirectly through Caixa Geral de Depósitos.
These 11% are class B shares that entitle the owner to have a vote per share even if it surpasses the legal limit of 25% (5% before privatization) of the share capital. The Portuguese state committed to sell the rest of its shares in public offering.
State Grid of China paid a premium of 40% valuing 25% of the company at 2,90€ per share, and guaranteeing the finance of €1bn. This amount was divided into 400
million to refinance REN’s financial debts, 400 to finance the capex plan, and the remaining 200 in other projects. State Grid offer also included commitments to support REN’s internationalization. REN may become a strategic service provider to State Grid in Brazil,
Oman Oil paid €2,56 per share, which corresponded to a 23% premium.
The other 49% of the shares are dispersed with only six qualified shareholders of whom none has more than 8% of the share capital.
According to the present legislation no single energy operator can have more than
10% of the capital of REN.
Since both major shareholders have medium and long-term projects for REN (from supporting internationalization process to R&D initiatives), and there is no future transaction known from the others shareholders, this capital structure is assumed
as stable, and we think that the foreseen public offering in which the Portuguese state
will further reduce its participation in REN will not change this situation.
Stable Capital Structure
REN COMPANY REPORT
THIS
DOCUMENT
IS
NOT
AN
INVESTMENT
RECOMMENDATION
AND
SHALL
BE
USED
EXCLUSIVELY
FOR
ACADEMIC
PURPOSES
(SEE DISCLOSURES AND DISCLAIMERS AT END OF DOCUMENT)PAGE 6/27
Macroeconomic Overview
In early 2010, investor’s confidence on sovereign debt of Portugal, Greece, Ireland, Italy and Spain decreased as evidenced by rising credit default swap
spreads (Figure 3).
As a result these countries saw their access to funding reduced, interest
costs on their bonds sloping upward and had to request for rescue packages. In Portugal several austerity measures and structural reforms were
implemented impacting consumption and investment levels, public expenditure and the unemployment rate. It also led to a reduction on the aggregate budget deficit from 9,8% of GDP in 2010 to 4,4% in 2011 and 6,4% in 20121 but Portugal still has to reduce it to 5,5% until the end of 2013, and to 2,5% until 2015 according to the targets set by Troika.
The European Central Bank and the Federal Reserve have been decreasing the Interest rates since 2012, which should promote investment. The Fed Funds target rate is to be kept between 0% and 0,25%2 and ECB has cut the reference rate 0,25% to 0,75% in 2012 and to 0,5% in the 8th of May3. Notwithstanding the
ability of Portuguese banks to provide credit is limited (funding costs are
pushed up by continuing tensions in sovereign debt markets and the quality of bank balance sheets and access to liquidity is impaired by the reduced availability of high-quality collateral) with consequences for the real economy. Therefore the
outlook is ominous.
Still, and despite the increase in public debt (table 1), GDP negative growth rates in 2012 (-3,2%) and the rise in the unemployment rate, Portugal has been
regaining confidence and credibility on the financial markets due to its compliance to the IMF program as observed in figure 4 given the evolution of
the bond yield and 5Y CDS spread in the last 12 months.
According to the IMF, the situation in Portugal is expected to stabilize during the second half of 2013, and to start to grow in 2014 (0,4%), driven by extra-EU members exports, increase of investment (that have already been recovering over the past months) and through private consumption.
1 Eurostat 2 http://www.federalreserve.gov/ 3 http://www.ecb.int/stats/monetary/rates/html/index.en.html Historically high CDS spreads but small record in the last 12 months
IMF expects Portugal to stabilize in 2013 4 8 16 32 64 128 256 512 1024 2048 12/05/30 12/10/30 13/03/30 Figure 4: Portugal 5Y
CDS and Gov Bond
CDS 5Y 10 Y Gov Bond Source: Bloomberg 0 200 400 600 800 1000 1200 09/01/02 10/01/02 11/01/02 Figure 3: 5Y CDS Spread Portugal SPAIN Italy Greece Source: Bloomberg
REN COMPANY REPORT
THIS
DOCUMENT
IS
NOT
AN
INVESTMENT
RECOMMENDATION
AND
SHALL
BE
USED
EXCLUSIVELY
FOR
ACADEMIC
PURPOSES
(SEE DISCLOSURES AND DISCLAIMERS AT END OF DOCUMENT)PAGE 7/27 0 20 40 60 80 100 2005 2010 2020 2030 %
Figure 5: EU Structure of Power Generation Forecast
RES Oil Gas Solids Nuclear
Table 1: Macro Economic Data4
Year GDP growth Unemployment Rate Public Debt Current Account Balance House saving ratio5 2010 1,9 10,8 94 -‐10,6 10,1 2011 -‐1,6 12,7 108,3 -‐7 9,1 2012 -‐3,2 15,8 123,6 -‐1,5 11,6 2013 -‐2,7 18,2 127,7 -‐0,9 12,8 2014 0,2 18,6 132,1 0,5 13,2
Lastly, energy consumption in Portugal was also affected. The total electricity and
natural gas consumption decreased by 2,9%, and 29%, respectively from 2011 to 2012.6
Energy Market
A country’s economic growth and energy consumption are linked. All else equal, a growing economy leads to greater energy and electricity use. It is therefore not surprising that energy consumption in Portugal has fallen during this crisis.
The energy policy in the European Countries, is very much driven by the European Commission and Parliament and their objectives are nowadays aimed at attaining: • An integrated European market, both for electricity and natural gas
• An increase in the importance of the renewables and the reduction of CO2 emissions • The security and reliability of supply of these two forms of energy
One relevant outcome of this effort, is the 2009 RES-Directive (Renewable Energy Source) that set the goal to reach 20% of the EU energy consumption from Renewable sources by 2020. The expected impact of these measures is that
there will be a greater investment in electrical grids, as opposed to the one on non-renewable sources of energy such as gas, nuclear energy or coal.
According to the Directorate-General for Energy of the European Commission the Renewable sources of energy weight in the total power Generation in EU will increase from14,3% in 2005 to 32,1% in 2030, (figure 5).
One example of the impact of this directive can be observed in Germany. Germany is leading the world both in research and technology of solar photovoltaic (PV) energy and is preparing for the announced closure of the nuclear plants in the near future. It
4 Public Debt and Current Account Balance are computed as percentage of GDP 5 Percentage of Disposable income
6
Company report (Technical data 2012)
Source: OECD Economic Outlook
Source: Directorate-General for Energy Report of “EU Energy Trends to 2030“
Decrease in Energy Consumption
REN COMPANY REPORT
THIS
DOCUMENT
IS
NOT
AN
INVESTMENT
RECOMMENDATION
AND
SHALL
BE
USED
EXCLUSIVELY
FOR
ACADEMIC
PURPOSES
(SEE DISCLOSURES AND DISCLAIMERS AT END OF DOCUMENT)PAGE 8/27 Production Transport Distribution Commercialization REN Liberalized
Market Regulated Activities
Source: ERSE
Figure 6 - Energy Market
Figure 7 –Energy Consumption
Source: Company Data
-1500 -1000 -500 0 500 1000 1500 2000 2500
Figure 8 – Network Quality
Source: Company Data
Minute s 0 2 4 6 8 10 12 14
the country with the highest solar photovoltaic (PV) capacity in the world: PV plants produced 27.9 TWh in 2012 as compared to the 19.3 TWh in 2011.
Electricity sector in Portugal
Over the last 15 years the electricity sector in Portugal has undergone a revolution – from a fully integrated monopoly operator (EDP) which developed all the activities in the value chain (production, transmission, distribution and sales), to a totally opened market where production and sales are liberalized and the transmission and distribution are regulated monopolies with the obligation of providing access to their grids in a transparent and non discriminatory manner.
Apart from this structural change in the electricity sector, in the last few years another revolution took place: the enormous growth of the renewables sources of energy, the decline of thermal production based on natural gas, the transformation of a national market into an Iberian market and, more recently, as a consequence of the crisis, the reduction in the electricity consumption.
Due to the role of REN in the electricity sector, most of these changes had a
very positive impact on REN as they caused the need for more investment of REN; more renewables mean that it is necessary to connect more production
sites to the network, and the creation of the Iberian market was only possible with a huge reinforcement of the interconnections between Portugal and Spain. Additionally the regulator has been imposing very stringent quality obligations on REN thus forcing REN to invest in the improvement of its grid reliability, which is now at a very high level:
In spite of all these changes in the electricity sector, the portion developed by REN - the transmission, is a relatively stable activity, and even the demand
reduction, which for a power station owner may be dramatic, is neutral to REN. This of course has the other side of this problem: if and when the market
REN COMPANY REPORT
THIS
DOCUMENT
IS
NOT
AN
INVESTMENT
RECOMMENDATION
AND
SHALL
BE
USED
EXCLUSIVELY
FOR
ACADEMIC
PURPOSES
(SEE DISCLOSURES AND DISCLAIMERS AT END OF DOCUMENT)PAGE 9/27 0 10000 20000 30000 40000 50000 60000
Figure 9 – Natural Gas Consumption
Source: Company Data
0 10000 20000 30000 40000 2011 2012
Electricity Market Conventional Market Figure 11- Conventional and Electricity Market Growth
Source: Company Data
Natural gas sector in Portugal
Natural Gas was introduced in Portugal in 1997 to provide a competitive, convenient and ecological energy source, and its main usage was expected to be for electricity production in combined cycle power plants. For this purpose pipelines, storage facilities and a LNG terminal were built, and natural gas consumption in both the conventional and in the electricity market started to evolve (figure 9)
.
Contrarily to the electricity sector there was never a fully integrated monopoly company. The sector was managed by the high-pressure operator-
Transgás. This company was responsible for the purchase of natural gas in the international markets and its transportation to Portugal, the sales to some clients and to local distribution companies (LDC’s), and finally Transgás was also responsible for the construction and operation of the pipelines, LNG terminal and underground storage.
In 2006, the Portuguese government decided to introduce a major change in the natural gas sector promoting its liberalization and deciding that the high-pressure infrastructures should be owned by REN (until then REN only operated the electricity transmission network) and also attributing to REN the role of system operator (GTS). As a consequence, REN bought from Transgás the high pressure pipelines, the LNG terminal (located in Sines) and an underground storage facility (located in Carriço).
The commercial activities are now totally liberalized, while the infrastructure operators, REN and the local distribution companies, are regulated monopolies with the obligation of providing access to their grids in a
transparent and non-discriminatory manner.
During the last years REN’s growth in the natural gas business came from a relevant investment in the LNG terminal with the construction of a third tank and the reinforcement of the emission capacity, the construction of its third cavern at Carriço, (there is a fourth under construction presently) and some limited investments in the high-pressure transmission.
The natural gas market in Portugal is being hit by the changes in the electricity sector in a more dramatic manner: the renewables power production is replacing electricity otherwise produced using natural gas and the electricity consumption reduction is also affecting mostly the natural gas fired power plants, as the
production which is “disappearing” would be based on natural gas.
Liberalized
Market Regulated Activities
Import Transport and Regaseification Storage and Distribution Commercialization REN Source: Galpenergia Figure 10 - Natural Gas Market
REN COMPANY REPORT
THIS
DOCUMENT
IS
NOT
AN
INVESTMENT
RECOMMENDATION
AND
SHALL
BE
USED
EXCLUSIVELY
FOR
ACADEMIC
PURPOSES
(SEE DISCLOSURES AND DISCLAIMERS AT END OF DOCUMENT)PAGE 10/27
In what concerns REN’s activities in the natural gas sector and future developments, there are two relevant investments foreseen:
- The construction of a pipeline linking Mangualde to Zamora - The construction of one more underground storage cavern
Both investments are being justified by security of supply needs – the pipeline is needed under Regulation No 994/2010 of the European Parliament which determines that countries in the European Union must be able to cope with the interruption of its most important supply entry point.
As for the new underground storage, the Decree-Law nº 297/2011 defines the minimum amount of natural gas that needs to be stored in the country at every moment to cope with a crisis in the supply of natural gas to the Country. The minimum amount of natural gas required needs to be defined by a new ordinance, which will determine the country’s needs of new storage facilities.
Finally, it might be required to build a compression station in Carregado, but since natural gas market consumption has been decreasing this investment was postponed.
After these investments, there are no new major investments foreseen in this sector.
Portuguese Regulation
The Electricity and Natural Gas sectors are either regulated by ERSE, in the monopolistic activities, such as transmission and distribution of electricity and natural gas, gas underground storage and LNG Terminal, or supervised by ERSE, in the liberalized activities, namely the commercialization of electricity and gas and production of electricity.
The Regulator ERSE is responsible for natural gas and electricity sector
regulation. ERSE is a public company with financial and administrative independence
from the Portuguese state, being governed by its statutes. The main goal while creating the regulator was the consumer’s protection, especially those less fortunate in terms of service quality, price of energy and security of supply. Also, ERSE has to promote the efficiency in investments and in the management of the regulated companies, environmental care and finally to arbitrate disputes out of courts between market participants.
The principles applied by the regulator are the same for both sectors, and considering that almost all of RENs activities are regulated, it is important to understand the fundamentals of the Portuguese Regulation.
Limited opportunities to invest
REN COMPANY REPORT
THIS
DOCUMENT
IS
NOT
AN
INVESTMENT
RECOMMENDATION
AND
SHALL
BE
USED
EXCLUSIVELY
FOR
ACADEMIC
PURPOSES
(SEE DISCLOSURES AND DISCLAIMERS AT END OF DOCUMENT)PAGE 11/27
The Regulation is done on the basis of “Regulamentos”78 which are only changed from time to time, always after a public hearing process to take into account the opinion of the various stakeholders.
On this basis, ERSE fixes a number of parameters and rules for each Regulatory Period – a three years period – present periods are January 2012 / December 2014, for electricity, and July 2010 / June 2013, for natural gas.
Every year ERSE applies those “Regulamentos”, parameters, and historical data (economic, financial and of the market) to determine the revenues of each regulated company and the applicable regulated tariffs for the following year. On June 15th ERSE will publish the applicable parameters for the next natural gas regulatory period (July 2013/June 2016) and the tariffs and revenues applicable for the next “gas year” July 2013 /June 2014.
A Regulated Company has the right to receive its “allowed revenues" every year.
These allowed revenues are established to assure the economic and financial equilibrium of the company, assuming an efficient management.
These allowed revenues are basically the sum of three parcels:
1. Capital costs
The capital costs are designed to ensure the remuneration of the capital employed by the company to develop its regulated activities9; it is calculated multiplying the average net assets (Regulated Assets Basis, RAB) of the year by the Rate of Remuneration (RoR). This RoR is established using CAPM model to determine the cost of capital of the activity for each regulatory period (three years):
In the gas activities it is a fixed value for the period (8% for the period ending in June 2013), in the case of electricity it is a value (9.0%) subject to yearly revisions, depending on the evolution of the CDS of the Portuguese Republic in the period October (previous year) to September of the same year; this revision however cannot lead to a change greater than +- 1.5%. The possible values of RoR will always be
between 7,5% and 10,5% (figure 12).
This is valid for the present regulatory period (January 2012 – December 2014) for which the Regulator has also introduced a relevant change affecting REN: the
investments done by REN in the electricity transmission system may be remunerated with a premium of 1.5% (on top of the RoR explained above), in case
7
http://www.erse.pt/pt/electricidade/tarifaseprecos/2013/Paginas/default.aspx
8http://www.erse.pt/pt/gasnatural/tarifaseprecos/201207a201306/Paginas/default.aspx
9RoR should always be near REN’s cost of capital. In our view it should always be above REN’s WACC as otherwise, REN would cut its investments. On the other hand, it should not be lower, as REN would have the right to defend itself in court in case the RoR is below their WACC.
Source: ERSE
Figure 12:RoR Computation
7.00% 7.50% 8.00% 8.50% 9.00% 9.50% 10.00% 10.50% 11.00% 0% 2% 4% 6% 8% 10% 12% 14% 16% RoR CDS RP
REN COMPANY REPORT
THIS
DOCUMENT
IS
NOT
AN
INVESTMENT
RECOMMENDATION
AND
SHALL
BE
USED
EXCLUSIVELY
FOR
ACADEMIC
PURPOSES
(SEE DISCLOSURES AND DISCLAIMERS AT END OF DOCUMENT)PAGE 12/27
REN does those investments at “standard costs”. This was designed to pass to the company the risk (and reward) on the efficiency of its investment program, contrarily to the “normal” regime, in which real investment costs were included in the RAB, thus passing to the market all deviations (positive or negative) to the investment budget. According to REN information, about 90% of the investments have been done with this premium since this new possibility was introduced.
2. Depreciation
The Depreciation is the accounting value of the depreciation of the Regulated assets.
3. OPEX
The OPEX parcel is a value determined by the Regulator each year for each of the regulated activities. Based on historic costs and benchmarking the Regulator
establishes the “approved costs”, which normally include some efficiency gains – if
the company is not able to be as efficient as the Regulator determined, it will be a loss for the company. If however the real costs are below the approved costs, that will represent a gain for that year; in this case, the real lower costs will then be used as the basis for the following years. With this regime, the company may have some
gains if it is efficient but it is very unlikely that these gains are sustainable, as the Regulator incorporates those efficiency gains for the following periods.
In some activities, the Regulator adds some other parcels, namely some incentive gains in case some objectives are achieved: for example in the case of the electricity transmission grid, if REN achieves an availability higher than 98.5%, it will be entitled to an extra revenue of 1 million euros.
Regulated tariffs
Based on the allowed revenues of all regulated companies, and on market projections for the following period, ERSE calculates the applicable regulated tariffs. As it is impossible to know the real dimension of the market in advance, there will always be deviations, which mean that the company may receive more (or less) money than the allowed revenues it is entitled.
However all deviations are incorporated (added or subtracted) in the following
year revenues added by interests calculated at a rate of Euribor plus 1%-1.5%.
On the long run, this should have no effect on REN’s value, as deviations should converge to a zero average.
Considering all the above:
The three main drivers for REN’s value are: 1) the RoR determined by the Regulator and its relation to the real WACC of REN, 2) the management of regulatory asset base level and 3) the efficiency of REN at operational level (OPEX).
REN COMPANY REPORT
THIS
DOCUMENT
IS
NOT
AN
INVESTMENT
RECOMMENDATION
AND
SHALL
BE
USED
EXCLUSIVELY
FOR
ACADEMIC
PURPOSES
(SEE DISCLOSURES AND DISCLAIMERS AT END OF DOCUMENT)PAGE 13/27
Source: Bloomberg and Nova Research Team
Figure 13-EBITDA breakdown
Source: Company Data
As a conclusion REN will be a profitable company as long as it keeps its operating costs below the ones accepted by ERSE, and its cost of capital below the regulated rate of return.
The investment program is the key driver for growth. If REN does not invest above depreciations, its EBITDA will decrease over time. However this growth will only
create value if the RoR is above the company’s WACC.
Valuation
We valued REN through a Sum of the parts approach using discounted cash flows valuation, in which we will analyse in detail the company divided in three segments: electricity, natural gas and others. On figure 13 we can see the last three years EBITDA breakdown. It is clear that the relevant segments of this company are Electricity and Gas, for this reason we will give them more importance.
We analysed REN in three scenarios: 1) base case, 2) the premium part of the rate
of remuneration in the electricity sector is removed and 3) Portuguese default. REN’s
value is the weighted average of these three scenarios, which we will further explain.
Discount Rate
We discount the future cash flows at the weighted average cost of capital by using CAPM to estimate it. The table 2 presents the parameter estimates, from which we compute a post-tax WACC of 6,7%.
The gearing was computed through the average Debt to Assets Value ratio from comparable companies with ratings that are equal or above REN’s (table3). The tax rate corresponds to the statutory corporate tax rate applied in companies in Portugal today.
The risk free rate was estimated by averaging the 10-year government bonds fro the Eurozone AAA rating countries: Netherlands, Finland, France, Austria, and Germany from the last three months.
The market risk premium was assumed to be 5,8%, according to Dimson, Marsh and Staunton. This study includes market risk premium from 20 countries since 1900, and the average market risk premium was 5,8%.
The country risk premium had to be considered due to the sovereign debt crisis, and since investors believe that Portugal may not fulfil its debt obligations, they will demand
Table2: WACC Debt to Equity 1,20 Cost of Debt 6,01% Tax rate 31,5% Cost of Equity 9,76% Market risk Premium 6% Equity Beta 0,65 Risk Free 1,66% Country Risk Premium 4% WACC 6,68%
Table 3: Debt to Assets Ratio
Terna 59% REE 54% Snam Rete Gas 53% Enagás 59% Endesa 43%
Average 54%
Source: Bloomberg and Nova Research Team
REN COMPANY REPORT
THIS
DOCUMENT
IS
NOT
AN
INVESTMENT
RECOMMENDATION
AND
SHALL
BE
USED
EXCLUSIVELY
FOR
ACADEMIC
PURPOSES
(SEE DISCLOSURES AND DISCLAIMERS AT END OF DOCUMENT)PAGE 14/27
Source: Bloomberg and Nova Research Team
Return on Capital
Recovery Of Net Operating Costs Recovery of Interest from Tariff Deviations from Previous Years
Incentive of the availability of the network
Fully Depreciated Assets in Use
Source: ERSE
Figure 14: Allowed Revenues Computation
a higher premium when compared to a higher rating country. We assumed it was the difference from the Portuguese 10-year government bonds minus the average Eurozone AAA countries 10-year government bonds yield.
We derived REN’s equity beta from the average asset beta of international comparators. We estimated the average asset beta from 2007 until 2012 for seven companies (see appendix 1), and then we transformed it into an equity beta by leveraging for the gearing assumed above.
The cost of debt is the sum between the risk free rate and the country risk premium. We believe that investors when investing in companies that operate in Portugal will demand a premium over risk free rate. This approach is conservative hence REN’s rating is above the one from Portuguese Republic, and so we assumed the debt risk premium to be zero.10 Finally the cost of equity was computed by using CAPM formula, adding the country risk premium.
Electricity
The electricity allowed revenues had a review in 2011 and the methodology to compute revenues changed, although the principles described previously were maintained. ERSE wanted to promote a better performance in REN’s operations: promotion of efficient investment, reduction of maintenance and operational costs, reduction of overinvestment by incorporating an incentive to the use of depreciated assets that still may be functional, to increase the network availability ratio.
The following figure shows the procedure to compute the yearly-allowed revenues:11
The return on capital portion is defined by the multiplication of the regulated asset base (RAB) by the defined rate of return (RoR). RAB is divided in assets in operations before 2009 at incurred costs, and assets in operations after 1st of January of 2009 at standard costs. This was built to stimulate an efficient plan of REN’s
10
Moody’s rating for Portuguese Republic is Ba3 and for REN is Ba1, and S&P is BB and BB+ (January 2013) 11
Tariff deviations from previous years are not considered revenues for the year n, only its interests, but will be received on year n.
Table4: Country Risk Premium Country Yield 10Y B Germany 1,42% 10 Y B France 1,95% 10 Y B Netherlands 1,69% 10Y B Finland 1,54% 10 Y B Austria 1,70% Average 1,66% 10Y B Portugal 6,01% Country Premium 4,35% RAB is divided in assets in operation: At incurred costs before 2009 At standard costs after 2009 Return on Capital: RAB times RoR
REN COMPANY REPORT
THIS
DOCUMENT
IS
NOT
AN
INVESTMENT
RECOMMENDATION
AND
SHALL
BE
USED
EXCLUSIVELY
FOR
ACADEMIC
PURPOSES
(SEE DISCLOSURES AND DISCLAIMERS AT END OF DOCUMENT)PAGE 15/27
investments, allowing a 10% upside limit for the real costs comparing to the standard costs. These last ones will be multiplied by RoR plus a premium of 1,5%. In
this report we assumed that 90% of REN CAPEX will be allocated in assets with
premium, by analysing data from 2011 and 2012, and realising that REN has been
able to keep their real costs bellow standard costs in its investments.
The RoR on the remunerated assets was also changed in this review. The 2013 RoR is defined by the sum of the average ten year treasury bonds of 5 AAA Eurozone countries (Netherlands, Germany, Finland, France and Austria) to a market premium, that is partially linked to the Portuguese Republic 5 Y CDS computed as a daily average of the year t, from October t-1 to September t. The average will be filtered by the elimination of 1/12 of the highest and lowest observed quotation. This value will always be between 7,5% and 10,5%. We assumed a rate of 8,06% and for the
assets with premium 9,56%, based on the average CDS since September.
The recovery of Net Operating Costs (OPEX) growth from one year to another of OPEX from one year to another is limited to the growth of inflation. OPEX due to grid expansion are also to be considered accepted costs. On the base case we
considered that REN’s costs are equal to the approved costs by the regulator.
The allowed revenues from recovery of Interest from Tariff Deviations will not be considered in the future cash flows for electricity. The tariff deviations are computed in t+2 y, and the interest rate will be the result of the following multiplication:
1 + 1! !"#$%&# !"#!!!+ !"#$%& !!! ×(1 + 1! !"#$%&# !"#!!!+ !"#$%& !!!)
The fully depreciated assets in use revenues are computed through the following formula:
50%×!"#$%&'$"& !"#$×(1 + 0,5× !"! + 1,5% )
As to the incentive to the availability of the network, it depends on the availability rate:
if REN manages to have an availability rate of 98,5% or bigger the allowed revenues will increase 1M, however if it is bellow 96,5% it will decrease 1M. In our projections we considered that REN would maintain the historical efficiency premium from last years.
The projects considered in the CAPEX plan are according to the announcements
made on the last investor day. The amount of €200 million/year of investment refers
to the new interconnection Minho-Galicia, the acquisition of new equipment for managing energy flows on the network, the strengthening of supply in big cities and connections to new hydro power plants from existing plants.
Despite the RAB with and without premium from the electricity infrastructures, REN also has RAB that refers to land. The company received this land when REN was separated from EDP. The remuneration of this land is different from the other
OPEX growth is limited to the growth of inflation
Premium of 1,5% in RoR of Assets at standard costs
RoR of Land is the interbank swap + 50 basis points
REN COMPANY REPORT
THIS
DOCUMENT
IS
NOT
AN
INVESTMENT
RECOMMENDATION
AND
SHALL
BE
USED
EXCLUSIVELY
FOR
ACADEMIC
PURPOSES
(SEE DISCLOSURES AND DISCLAIMERS AT END OF DOCUMENT)PAGE 16/27
Source: Nova Research Team
regulated assets. Its applied the interbank swap rate plus 50 basis points and no depreciation is added to the allowed revenues.
All the CAPEX is considered entirely for non-land RAB and no new land assets should be acquired by REN in the future.
Table 5 presents the electricity sector results for the next periods and the estimated Enterprise Value.
For the perpetuity calculation we have considered a growth rate of 1,5%. This
corresponds to the expected growth of the return on RAB assuming that REN fulfils the present investment program in this sector.
Table 5: Electricity Enterprise Value
€ Thousands 2012 2013 2014 2015 2016 2017 Return on non land RAB 199 794 175 806 180 622 184 093 186 220 187 003 Land Remuneration 10 278 9 724 9 183 8 782 8 389 8 001 Recovery of OPEX 72 000 73 440 74 909 76 407 77 935 79 494 Recovery of Depreciations 135 900 149 977 163 977 177 977 191 977 205 977 Others 6 128 9 600 9 792 9 988 10 188 10 391 Construction Revenues 155 500 200 000 200 000 200 000 200 000 200 000 Total Revenues 579 600 618 547 638 483 657 247 674 709 690 866 OPEX 58 000 59 160 60 343 61 550 62 781 64 037 Construction Costs 132 500 180 000 180 000 180 000 180 000 180 000 EBITDA 389 100 379 387 398 140 415 697 431 928 446 830 Depreciations 137 500 153 038 167 324 181 609 195 895 210 181 EBIT 251 600 226 349 230 816 234 088 236 033 236 649 Tax 75 480 71 300 72 707 73 738 74 350 74 544 Tax adjustments 1 008 -‐ -‐ -‐ -‐ -‐ NOPLAT 175 112 155 049 158 109 160 350 161 683 162 104 Depreciations 137 500 153 038 167 324 181 609 195 895 210 181 Operational Gross CF 312 612 308 087 325 433 341 960 357 578 372 285 CAPEX 80 903 200 000 200 000 200 000 200 000 200 000 WC 22 918 -‐24 082 -‐32 468 -‐40 459 -‐46 781 -‐52 220 NWC -‐146 522 -‐47 000 -‐8 386 -‐7 991 -‐6 322 -‐5 439 Other Assets 48 917 48 276 50 576 52 740 54 754 56 618 Other Liabilities 80 999 204 469 190 987 178 328 164 695 149 856 Change in other Assets and Liabilities -‐5 399 124 111 -‐15 781 -‐14 824 -‐15 647 -‐16 702 Assets and Liabilities (non core Business) -‐105 692 -‐110 974 -‐116 521 -‐122 346 -‐128 462 -‐134 885 Change 50 690 5 282 5 547 5 825 6 116 6 423 Free Cash Flow to the firm 130 479 190 480 106 812 124 970 141 724 156 566 Discounted Cash Flows 100 120 109 802 116 722 2 511 781 Enterprise Value 2 838 425
Natural Gas
Figure 15 explains how the allowed revenues for natural gas were computed on the last 3 years.
We believe that it does not make sense to consider different rates of return for these two activities since the risks are very identical. However, we also believe that the
reasons that led ERSE to include a premium on the RoR for electricity will not apply to natural gas.
REN COMPANY REPORT
THIS
DOCUMENT
IS
NOT
AN
INVESTMENT
RECOMMENDATION
AND
SHALL
BE
USED
EXCLUSIVELY
FOR
ACADEMIC
PURPOSES
(SEE DISCLOSURES AND DISCLAIMERS AT END OF DOCUMENT)PAGE 17/27
Source: Nova Research Team
We do believe that ERSE will have a mechanism to compute the WACC for REN similar to the one used for electricity, and so the RoR we considered for this sector was the same as for electricity without premium. This is because we do not believe that ERSE will want to promote investment in this sector while the natural gas consumption in the country does not recover its growth at the very least.
There are some investments planned and approved (both by the State and by the
shareholders) which we considered in our forecasted cash flows. These investments relate to two new underground storage caverns and the new pipeline from Mangualde to Guarda.
The allowed OPEX costs and the real ones are considered to grow at the same pace maintaining the same behaviour as in the previous years.
In our cash flows predictions we have only considered the return on capital and the recovery of OPEX (as we did for electricity), since in our projections there are no
tariff deviations – on the long term this should be the case. Table 6 presents the estimated Income statement and the cash flow map for the natural gas sector, as also the enterprise value.
Table: 6 Natural GAS Cash Flow Map
€Thousands 2012 2013 2014 2015 2016 2017 Return on non land RAB 86 952 90 699 91 798 91 110 89 783 89 610 Recovery of OPEX 38 300 39 066 39 847 40 644 41 457 42 286 Recovery of Depreciations 59 600 57 603 60 659 62 845 64 399 66 309 Others -‐6 152 9 600 9 792 9 988 10 188 10 391 Construction Revenues 45 000 83 199 67 261 44 320 55 299 76 569 Total 223 700 280 167 269 357 248 907 261 125 285 165 OPEX 27 600 28 152 28 715 29 289 29 875 30 473 Construction Costs 40 400 74 879 60 535 39 888 49 769 68 912 EBITDA 155 700 177 136 180 107 179 730 181 481 185 781 Depreciations 59 700 60 003 63 186 65 464 67 082 69 071 EBIT 96 000 117 133 116 921 114 266 114 399 116 709 Tax 28 800 36 897 36 830 35 994 36 036 36 763 Tax adjustments 405 -‐ -‐ -‐ -‐ -‐ NOPLAT 66 795 80 236 80 091 78 272 78 363 79 946 Depreciations 59 700 60 003 63 186 65 464 67 082 69 071 Operational Gross CF 126 495 140 239 143 277 143 736 145 446 149 017 CAPEX 119 600 83 199 67 261 44 320 55 299 76 569 Working Capital -‐26 289 -‐21 519 -‐38 555 -‐61 459 -‐50 667 -‐30 023 Net Working Capital -‐43 037 4 771 -‐17 037 -‐22 903 10 792 20 644 Other Assets 20 612 22 719 23 310 23 598 23 740 24 060 Other Liabilities 80 781 97 853 90 484 82 292 75 074 69 062 Change in other Assets and Liabilities -‐2 741 14 965 -‐7 961 -‐8 479 -‐7 361 -‐6 332 Assets and Liabilities (non core Business) -‐116 -‐124 -‐132 -‐140 -‐148 -‐156 Change 8 8 8 8 8 8 Free Cash Flow to the firm -‐38 874 76 785 51 027 68 042 93 586 86 769 Discounted Cash Flows 47 830 59 784 77 075 1 002 217 Enterprise Value 1 186 906 Return on Capital Recovery Of Net Operating Costs !""#$%&'(%)%*+%,' Interests on Tariff Deviation s from Previous Years Source: ERSE Figure 15 – Allowed Revenues Computation No tariff deviations in our projections
REN COMPANY REPORT
THIS
DOCUMENT
IS
NOT
AN
INVESTMENT
RECOMMENDATION
AND
SHALL
BE
USED
EXCLUSIVELY
FOR
ACADEMIC
PURPOSES
(SEE DISCLOSURES AND DISCLAIMERS AT END OF DOCUMENT)PAGE 18/27
REN is analysing
possible opportunities in several countries
For the perpetuity we have assumed a growth of 0% as the RAB’s remuneration is stable in the period from 2013-2017 with the present investment program and we are projecting the following periods with the same pattern.
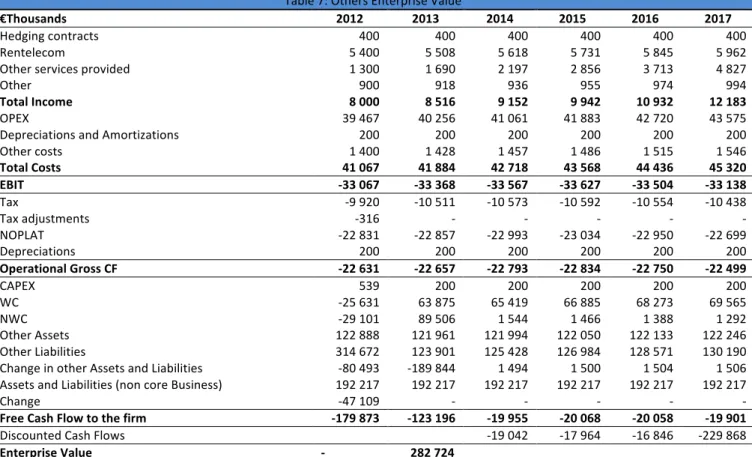
Others
This segment of the company comprises several costs that are common for the whole company, such as the investor relations department, human resources, accounting, and other department costs. It is important to emphasise that the Regulator considers part of these costs accepted costs for the regulated activities. This segment also comprehends Rentelecom, Consultancy and Commercial Services and Ren Atlântico. We believe that the company’s growth may be in this segment in the future, with the investment possibilities in foreign countries. REN wants to support the expansion
abroad with the stable revenue base in Portugal, through mergers and acquisitions or greenfield projects.
For this purpose REN has already a development team on selected sites to analyse possible opportunities. The countries analysed are Brasil, Chile, Colombia, Peru, Mozambique, Angola, South Africa China and other countries in Middle East and even in Europe.
It is divided in three geographies and types of opportunities. In latin America, there is a team monitoring possible investments. In Sub-Saharian Africa REN is selling consultancy services to develop relationships. In the middle East REN is exploring opportunities to which would take advantage of the partnership with State Grid of China and Oman Oil. And finally in Europe REN is evaluating possible opportunities to leverage its know-how.
However, due to the lack of more information we did not consider any cash
flows from these future international activities.
We have considered that Consultancy services will grow 30% per year over the next three years, however it will still have a limited impact on REN financial statements compared with the revenues from regulated activities.