WORKING PAPERS
ECONOMICS
Nº 01/2016
A COUNTING MULTIDIMENSIONAL INNOVATION INDEX
FOR SME
Nuno Campos Pereira
Católica Porto Business SchoolNuno Araújo
CATIM - Centro de Apoio Tecnológico à Indústria Metalomecânica
Leonardo Costa
1
A Counting Multidimensional Innovation Index for SMEs
By Nuno Campos Pereira, Nuno Araújo, and Leonardo Costa
Nuno Campos Pereira
Católica Porto Business School, Universidade Católica Portuguesa
Nuno Araújo
CATIM - Centro de Apoio Tecnológico à Indústria Metalomecânica
Leonardo Costa (corresponding author)
Católica Porto Business School, CEGE, Universidade Católica Portuguesa Rua Diogo Botelho 1327
4169-005 Porto Portugal
2
A Counting Multidimensional Innovation Index for SMEs
We developed a Counting Multidimensional Innovation Index (MII) framework for measuring and benchmarking innovation of Small and Medium Enterprises (SMEs), groups of SMEs, industries, regions, and countries. The methodology behind the MII is similar to the methodology behind the United Nations Multidimensional Poverty Index and follows the innovation definitions stipulated by the OECD Oslo Manual, covering dimensions and partial indicators suggested by this Manual and/or adapted from the Innovation Union Scoreboard (IUS) and from the Global Innovation Index (GII). To illustrate the MII framework, a survey was conducted among SMEs of the metalworking industry in Portugal.
Keywords: Innovation, SME, Multidimensional Innovation Index, Portuguese Metalworking Industry
1. Introduction
This research was motivated by the importance attached to innovation in the literature, by the role of Small and Medium Enterprises (SMEs)1 as major sources of innovation, by the
need of characterizing the innovation of sectors dominated by SMEs such as the metalworking industry in Portugal, and by the difficulties of gathering information on SMEs. The main objective of this research is the development of a Multidimensional Innovation
Index (MII) innovation measurement framework, capable of overcoming the difficulties in measuring and benchmarking innovation of SMEs, groups of SMEs, industries, regions, and countries. The MII framework is able to generate not only individual profiles of innovation but also group composite measures of innovation, by partial indicator and/or dimension and multidimensionally, allowing to compare SMEs, groups of SMEs, industries, regions, and countries.
Composite indicators have been increasingly used to support data based narratives for political advocacy. Saltelli (2007) questioned the simplified messages they provide. Nardo et
al. (OECD 2008) recommended best practices for the construction of composite indicators. In
this research we followed the innovation definitions stipulated by the Organisation for
1 In the European Union, SME’s are firms employing 10 to less than 250 employees, which have an annual
turnover or an annual balance sheet not exceeding, respectively, € 50 million and € 43 million (European Commission 2015).
3
Economic Cooperation and Development Oslo Manual (OECD 2005) and built 20 partial indicators of innovation, mostly adapting suggestions of this Manual and/or partial indicators appearing in the Innovation Union Scoreboard (IUS - UNU-MERIT, 2015) and in the Global Innovation Index (GII - Cornell University, INSEAD, and WIPO, 2015).2 Hence, the partial indicators being considered in the MII are not new in the innovation literature. The novelty of the MII is the counting dual cut-off method employed to establish innovative and non-innovative firms, by partial indicator and multidimensionally. This counting dual cut-off method was proposed in the poverty literature by Alkire and Foster (2011), being motivated by Atkinson's (2003) discussion of counting methods for measuring multidimensional deprivation, and incorporating Sen's (1993) view of poverty as capability deprivation. It has been applied to compute the United Nations (UN) Multidimensional Poverty Index (MPI) developed by Alkire and Santos (2010, 2014), and more recently to measure multidimensional poverty in Europe (Alkire and Apablaza, 2016). So, the MII framework is based on the method proposed by Alkire and Foster (2011) and has similarities with the UN MPI framework (Alkire and Santos 2010, 2014). Like the MPI, the MII is based on micro data, employs a counting dual cut-off method that demands individual simple yes or no answers to a set of questions, and it is easy to compute.
The paper unfolds as follows. Section 2 addresses the concept of innovation and the theories behind the OECD Oslo Manual, the IUS, the GII, and the partial indicators of the proposed MII. Section 3 describes the counting dual cut-off method employed to compute the MII, providing an illustrative example. Section 4 yields an application of the MII framework to the SMEs of the metalworking industry in Portugal, presenting and discussing the survey conducted and the results obtained. Section 5 yields the concluding remarks.
2 The Innovation Union Scoreboard (IUS) is published annually by the European Commission. The Global
Innovation Index (GII) is co-published annually by Cornell University, INSEAD, and the World Intellectual Property Organization (WIPO), an agency of the United Nations (UN). In addition to the Oslo Manual, the IUS, and the GII, a few Portuguese national systems were also taken into account to build the 20 partial indicators (see, for instance, COTEC 2014 and IAPMEI 2014).
4 2. Innovation and SMEs
Several theories form the basis for the OECD Oslo Manual, the IUS, the GII, and thus the proposed MII framework. These theories establish the concept of innovation and its relationship with productivity, identify the territories where innovation occurs, provide a view of innovation as a system, stress the importance not only of products and processes but also of organisational, management and marketing practices, discuss the driving forces behind innovation, characterize the existence of radical and incremental innovations and of open and closed innovations, describe the links between innovation and firm size and between innovation and firm growth, discuss the explanatory power of patents, and many other aspects. They justify not only the choice of the 20 partial indicators used in the MII framework but also the environmental variables that can be considered ex-post explaining differences in innovation across firms.
According to Schumpeter (1911), innovation is a process of creating something new and destroying what becomes outdated. It can be understood as the creation of new combinations of means of production, which may include the introduction of a new good, the introduction of new production methods, the opening of a new market, the conquest of a new source of supply of raw materials, or the implementation of a new organization in any industry (Schumpeter 1911). For Joyce, Nohria, and Roberson (2004), to be considered innovative an organization must change its industry somehow. Godin (2008) considers innovation as a process that leads to an outcome that is a novelty, by definition, since the object or the new way of doing something did not previously existed. Chauvel (2011) sees innovation as the ability of a firm to overcome perfect competition, originating a situation of temporary monopoly by creating a new market for its products. For the purpose of this research, we have adopted the OECD Oslo Manual definition of innovation. “An innovation
5
is the implementation of a new or significantly improved product (good or service), or process, a new marketing method, or a new organisational method in business practices, workplace organisation or external relations” (OECD 2005, pp 46).
Innovations and creativity (or inventions) are related but not the same thing. Inventions necessarily happen before innovations, which explains the attention given in the literature to creativity (Florida 2002; Landry 2008; Shearmur 2012). While creativity refers to the generation of ideas, innovation concerns their implementation.3 Innovation is a process that transforms inventions into value at the firm level (Lazonick 2005). Creativity is an important element in innovation, as it aims to develop organizations with the ability to process innovation, so that the result is new, unique and meaningful (Badawy 1986). National culture does influence economic creativity, and innovation implementation explains some of the variation in prosperity across countries (Williams and McGuire 2010). Networks
contribute to innovation and performance of SMEs (Gronum, Verreynne, and Kastelle 2012). Human capital can have a significant impact on reducing the barriers to innovation represented by knowledge shortages and market uncertainties (D’Este, Rentocchini, and Vega-Jurado 2014). Small firms provide the most conducive environment for
entrepreneurship and innovation, given the commitment and close cooperation of their members (Sahut and Peris-Ortiz 2014).
Robert Solow (1956, 1957) noted more than 60 years ago that rising incomes should largely be attributed not to capital accumulation, but to technological progress – to learning how to do things better (Stiglitz 2014). Technological progress is embodied in Neoclassical and New Growth Theory models (for example Romer 1990) and is pointed as the principal way through which economic growth can be stimulated (Ray 1998). There are other perspectives on innovation, besides the ones provided by Neoclassical and New Growth
6
theories. According to Evolutionary and New Schumpeterian approaches, innovation and technological changes are path dependent (Nelson and Winter 1982; Dosi 1982; Freeman and Louçã 2001; Verspagen 2005).
Concerning the territories where innovation occurs, many authors show the existence of links between innovation and cities. Currid (2007) presented the case of New York. Bettencourt, Lobo, and Strumsky (2007), referring to the number of innovation patents, concluded that the latter occur predominantly in cities. For a few authors cities are the loci of innovation and creativity (Montgomery 2007; Florida 2009). Cohendet, Grandadam, and Simon (2010) studied the anatomy of the creative city by defining three different layers - the upper ground, the middle ground and the underground. Each one of these layers intervenes with specific characteristics in the creative process, and enables new knowledge to transit from an informal micro level to a formal macro-level. Shearmur
(2012) investigated the correlation between innovation and cities. The author argues that cities convert innovation into value, though innovation may occur outside the cities. That is, cities may be dependent on activities occurring outside. He concluded that the only types of innovation specific to the cities might well be social and political innovations, designed to address issues specifically earmarked for housing developments. Lööf and Johansson (2014) studied the influence of metropolitan externalities on productivity for different types of long-run R&D engagement. They found that firms in Sweden with persistent R&D have a productivity premium that is about 14 per cent in the largest cities and 8 per cent in non-metro locations. Lee and Rodríguez-Pose (2014) studied the link between local creative industries concentration and SMEs’ innovation in the UK. The results suggest that firms in local economies with high shares of creative industries’ employment are significantly more likely to introduce entirely new products and processes than firms elsewhere.
7
Regarding the relationship between innovation and productivity, Hall (2011) found an economically significant impact of product innovation and a somehow more ambiguous impact of process innovation, the latter result being primarily due to difficulties in measuring the effect. Bloom et al. (2012) show that high management scores are strongly and positively related with countries’ level of development. Bloom et al. (2014) provide evidence that an important explanation for the substantial differences in productivity among firms and countries are variations in management practices. Their preliminary estimates suggest that around a quarter to a third of cross-country and within-country TFP gaps appear to be management related. Still according to Bloom et al (2014), higher management scores are positively and significantly associated with higher productivity, firm size, profitability, sales growth, market value and survival. Factors such as competition, governance, ownership, human capital, asymmetric information, financial constraints, etc., help to account for the variation in management (Bloom et al. 2014). Several authors analyse organizational structures and the processes of learning and adjustment to changes in technology and in the firm environment, including the market (e.g. Lam 2005). Thus, management seems to matter, both qualitatively and quantitatively. Many authors found that the effect of R&D on firm’s productivity is positive (Lichtenberg and Siegel 1991; Klette, and Johansen 1998; Harhoff 1998; Lotti, and Santarelli 2001; Janz, Lööf, and Peters 2004; Van Leeuwen and Klomp 2006; Parisi, Schiantarelli, and Sembenelli 2006) and a few suggested that the returns from R&D have been declining over the years (Klette and Kortum 2004).
Innovations can be radical or incremental. For Schumpeter (1911), radical innovations cause world changes, while incremental innovations fill in the process of continuously change. For Stiglitz (2014), ‘While some of the productivity increase reflects the impact of dramatic discoveries, much of it has been due to small, incremental changes’. A few authors relate radical innovations with networking SMEs and incremental innovations with large and
8
hierarchical organizations operating in markets with few innovations (Freeman and Soete 1997). Other relate these innovation types with network relationships of firms, with radical innovations requiring strong collaborative ties with costumers while incremental innovations being commercialized through different types of downstream networks (Partanen, Chetty, and Rajala 2014). Maes and Sels (2014) investigated if and how internally and externally oriented knowledge capabilities can stimulate radical product innovation in SMEs. They concluded that externally oriented learning processes are dependent on firms’ capabilities that increase knowledge diversity and sharing among the employees, which in turn has a strong and direct influence as potential wellsprings of radical innovation.
Regarding the sources of information, the literature distinguishes closed and open innovations. According to Chesbrough (2013) closed innovations happen when an organization uses internal sources of information to innovate, such as its own employees, while open innovations occur when an organization uses external sources of information to innovate. The author suggests that many innovative firms have moved to a model of open innovation, using a wide range of actors and external sources to help them achieve and sustain innovation. Laursen and Salter (2006) explored the relationship between the firm’s external openness and its innovation performance. The authors found the most open firms to be more likely to get better innovation performance and the benefits of openness being subject to decreasing returns. Barge-Gil (2010) addressed the relationship between the openness of firms’ innovation strategies and firm characteristics by distinguishing three firm strategies - open, semi-open and closed. Using a panel of Spanish firms (2004–2006), he concluded that open innovators are smaller and less R&D intensive than semi-open ones, although larger and more R&D intensive than closed innovators. Parida,
Westerberg, and Frishammar (2012) analysed inbound open innovation activities in high-tech SMEs. They found technology sourcing being linked to radical innovation performance,
9
whereas technology scouting being linked to incremental innovation performance. Lasagni (2012) investigated the role of external relationships as key drivers of European SMEs innovation. The author found innovation performance being higher in SMEs that are proactive in strengthening their relationships with innovative suppliers, users, and customers. Brockman, Jones, and Becherer (2012) showed that the overall positive influence of customer orientation on SMEs performance is stronger as risk-taking, innovativeness, and opportunity focus increase. Spithoven, Vanhaverbeke, and Roijakkers (2013) studied open innovation (OI) practices in SMEs. They found that the effects of OI practices in SMEs often differ from those in large firms. SMEs are more effective in using different OI practices simultaneously when they introduce new products on the market, whereas this is less the case for large firms.
Against the Schumpeterian hypothesis of a positive relationship between firm size and innovative activity, a few authors (e.g. Acs and Audretsch 1988, 1990) argued that small companies are the engines of technological change and innovation activity. Although preliminary, Hall, Lotti, and Mairesse’s (2009) results indicate that firm size is negatively associated with R&D intensity and positively associated with the likelihood of having process or product innovations. Revilla and Fernández (2013) studied the effects of firm size on innovative activity on a sample of Spanish manufacturing firms. They found that technological dynamism negatively moderates the effects of firm size on the economic productivity of R&D. Lejarraga and Martinez-Ros (2014) extended the size–innovation
debate by proposing that the size of firms affects the scale and quality of product innovation, through the adoption of different decision making styles. Using longitudinal data of Spanish firms, they showed that size is negatively related with the scale and positively related with the quality of product innovation. Antonelli and Scellato (2015) analysed the effects of the size of the firm in the direction of technological innovations in a panel of 6600 Italian
10
firms (1996-2005). They found small firms being more likely to introduce biased technological changes, directed toward the most intensive use of locally abundant production factors, and large firms being more likely to introduce neutral technological changes, shifting the production frontier.
Other authors addressed the link between innovation and firm growth. According to Audretsch, Coad, and Segarra (2014), a large number of applied papers found a positive link between innovation and firm growth. For example, Deschryvere (2014) explored the relationships between growth and R&D investment. Using Finnish data, he found continuous product innovators and occasional process innovators to have the stronger associations between sales growth and subsequent R&D growth.
A few authors questioned the innovation explanatory power of patent citations (Breschi and Lissoni 2001; Thompson and Fox-Kean 2005). Indeed, as pointed out by Acs (2002), the use of patents as an indicator of innovation reveals some problems such as: i) the fact that patents only register major product innovations; ii) the existence of firms patenting new ideas and having no intention of launching them into the market; and iii) SMEs that would rather rely on the secrecy of the product, not disclosing their inventions.
Many other aspects are addressed in the literature, such as the role of entrepreneurial motivations (Verbees and Meulenberg 2004; Carsrud and Brännback 2011), the context dependence of innovation performance (Rosenbusch, Brinckmann, and Bausch 2011), the impact and effectiveness of policy support to innovation (Parrilli and Elola 2012; Foreman-Peck 2013; Kobayashi 2014; Castillo et al. 2014; Brancati 2015), the joint dynamic of export and R&D activities (Esteve-Pérez and Rodríguez 2013), the impact
of the business cycle (Madrid-Guijarro, García-Pérez-de-Lema, and Auken 2013), the family and non-family nature of the firm (for example Classen et al. 2014), the joint effect of patents
11
and reduced competition (Beneito, Rochina-Barrachina, and Sanchis 2014), the use of CEO, managers, and non-managerial employees ideas in small firms (Andries and Czarnitzki 2014), the Total factor Productivity (TFP) elasticity with respect to R&D capital (Cchini and Venturini 2014), the comparison of international innovation strategies of emerging and developed markets (Wang, Sutherland, and Ning 2014), marketing theories and normative approaches to market exchanges (Hunt, 1983), consumer markets (Burr 2014), and other aspects.
Table 1 describes the 20 partial indicators of innovation employed in the MII framework. Recognizing the existence of outputs and inputs of innovation (see OECD 2005; UNU-MERIT 2015; Cornell University, INSEAD, and WIPO 2015), the 20 partial indicators of innovation are classified as outputs (or results of) and inputs (or efforts towards) innovation. The 8 output partial indicators considered are subdivided in 2 classes: i) Knowledge and technology (3 indicators); and ii) Economic effects (5 indicators). The 12 input partial indicators considered are subdivided in 5 classes corresponding to business functions: i) Human resources (2 indicators); ii) Processes and infrastructure (4 indicators); iii) Strategy and organization (3 indicators); iv) Finance (2 indicators); and v) Marketing (1 indicator).
Table 1
MII partial indicators
Partial Indicators
Outputs, Knowledge and Technoloy
1. Product and/or processes innovations. Measures whether companies were able to introduce innovations in
12
2. Number of workers. Aims to assess whether the company has managed to increase its number of qualified
employees
3. PCT Patents. Aims to appreciate the company’s ability to create patents, since the company's ability to
develop new products will determine their competitive advantage, and is therefore a good indicator of the
innovation rate in new products.
Outputs, Economic effects
4. Volume of exports. Company’s ability to increase its volume of exports.
5. Turnover. Company’s ability to increase its turnover
6. Patent revenues.
7. New customers. Company’s ability to get new customers.
8. New markets. Company’s ability to enter into new markets.
Inputs, Human resources
9. Workers by skill level. Aims to identify the degree of qualification of employees in the company, and the
percentage of those with masters or doctoral qualification.
10. Training investment. The purpose is to know whether companies invest in the training of employees.
Inputs, processes and infrastructure
11. Innovations made in products and/or processes. Intends to evaluate whether a company has achieved
some innovation in their products and/or processes internally.
12. Partnerships with external entities for innovation. Aims to measure the degree of involvement of
companies with external entities for innovation.
13. ICT use. It is intended to illustrate whether companies are using computer tools or specialized software
during the process of manufacturing and services.
14. Existence of R&D department in the company. Aims to find out if the company has a space exclusively
dedicated to R & D within its facilities.
13
15. Actions by top management in innovation activities. Indicates whether top management participates
actively in the innovation process.
16. Encouraging innovation by organizational culture. Aims to assess to what extent the organization’s
culture encourages entrepreneurship, and the risk-taking behaviour of their workers.
17. Organizational innovations. Seeks to measure the ability of firms to innovate organizationally, according
to the concept of organizational innovation defined.
Inputs, Finance
18. R&D investment. Evaluates the financial efforts in R&D made by the company.
19. Credit access for R&D investment. Reveals the company’s ability to obtain external financing to invest in
R&D.
Inputs, Marketing
20. Marketing innovations. The purpose is to establish to what extent companies have achieved innovations in
marketing in accordance with the definitions set out.
3. A Counting Multidimensional Innovation Index (MII) for SMEs
The MII is a vector that contains the following 4 multidimensional innovation measures:
MIIo = Ho x Ao (1)
MIIi = Hi x Ai (2)
MIIr = MIIo/MIIi (3)
MIIa = (MIIo+MIIi)/2 (4)
These 4 composite measures mimic the 4 composite indicators proposed in the GII (see Cornell University, INSEAD, and WIPO 2015):
14
- The MIIo measures the incidence and intensity of multidimensional innovation in terms of outputs. Ho is the proportion of multidimensional output innovative SMEs and Ao is the average intensity of multidimensional output innovation of these SMEs. The MIIo measure lies on the interval [0,1].
- The MIIi measures the incidence and intensity of multidimensional innovation in terms of inputs. Hi is the proportion of multidimensional input innovative SMEs and Ai is the average intensity of multidimensional input innovation of these SMEs. The MIIi measure lies on the interval [0,1].
- The MIIr is the ratio between the MIIo and the MIIi. It measures the Total Factor Productivity (TFP) of innovation of the group of SMEs under analysis. It is similar to the GII Innovation Efficiency Ratio (Cornell University, INSEAD, and WIPO 2015). The MIIr measure lies on the interval [0, + inf].
- Finally, the MIIa is the average between the MIIo and the MIIi. It is an overall measure of innovation similar to the IUS Summary Innovation Index (UNU-MERIT 2015) and to the GII Global Innovation Index (Cornell University, INSEAD, and WIPO 2015). The MIIa measure lies on the interval [0,1].
Like the MPI (Alkire and Santos 2010, 2014; Alkire and Apablaza 2016), the mathematical structure of the MIIo and the MIIi measures corresponds to the one of the M0 poverty
measure, the latter being the Adjusted Head Count Ratio proposed by Alkire and Foster (2011). The M0 measure has several important properties:
1. It is robust when using ordinal or cardinal variables, as it dichotomizes the variables;
15
2. By adjusting multidimensional incidence by intensity, it satisfies dimensional monotonicity;
3. It is decomposable by population sub-groups; and
4. It can be broken down by partial indicator and/or dimension.
See Alkire and Foster (2011) for a detailed presentation of the M0 properties.
Constructing the MII measures implies the following steps:
1. Establishing the set of output and input partial indicators and dimensions to be considered in the composite measures. In section 2, we presented a list of 20 output and input partial indicators.
2. Setting the cut-offs for each partial indicator above which the SME is considered to be innovative in each indicator. These cut-offs are set to be 0.5, since all the variables are dichotomized (1, if the SME is innovative in the partial indicator; 0 if the SME is not innovative in the partial indicator) and we consider 0.5 as the multidimensional output (input) cut-off. Consequently, all partial indicators missing values are to be filled with the value 0.5.
3. Applying the cut-offs to verify in which partial indicators each SME is and is not innovative.
4. Selecting the relative weights of each indicator such that the sum of the weights of all output (input) indicators adds up to one. Like in the MPI, we have chosen equal weights for all output (input) dimensions, and equal weights for the indicators within each dimension.
5. Computing the weighted innovation output (input) composite score for each SME. 6. Determining the multidimensional output (input) innovation cut-off, that is, the
16
considered output (input) multidimensional innovative. We set the output (input) cut-off to be 0.5.
7. Computing the proportion of SMEs that have been identified as output (input) multidimensionally innovative in the sample. This is the headcount ratio Ho (Hi). 8. Computing the average score of multidimensional output (input) innovative SMEs.
This is the average intensity of multidimensional output (input) innovation, Ao (Ai).
9. Computing MIIo and MIIi.
10. Computing MIIr and MIIa respectively as the ratio and the average of MIIo and MIIi.
The cut-offs in 2. and in 6. are normative. If the cut-offs in 6. are changed, the cut-offs in 2 must be changed accordingly, because of the treatment given to the missing values.
The weights of the partial indicators are also normative. They need not to be equal across output (input) dimensions and across indicators in each dimension. The only restriction is the sum of the weights of all output (input) indicators to add up to one. Nonetheless, equal weights make easier the interpretation of the composite indicators (on this see Atkinson 2003; Alkire and Foster 2011).
The list of 20 partial indicators considered can be altered. For instance, it is possible to have a set of alternative partial indicators more suited to address SMEs’ innovation in developing countries.
To compute the MII, we only need the group of SMEs under analysis to answer twenty ‘yes’ or ‘no’ questions that feed the twenty partial indicators of innovation being
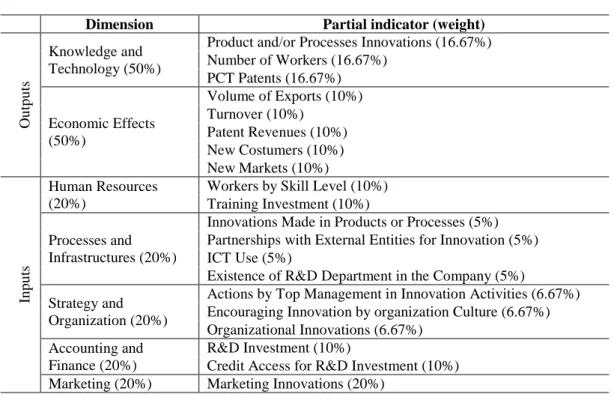
considered. Table 2 shows the twenty partial indicators of innovation measured for each SME and their weights.
17 Table 2
MII partial indicators and corresponding Weights
Dimension Partial indicator (weight)
Ou tp u ts Knowledge and Technology (50%)
Product and/or Processes Innovations (16.67%) Number of Workers (16.67%) PCT Patents (16.67%) Economic Effects (50%) Volume of Exports (10%) Turnover (10%) Patent Revenues (10%) New Costumers (10%) New Markets (10%) In p u ts Human Resources (20%)
Workers by Skill Level (10%) Training Investment (10%)
Processes and Infrastructures (20%)
Innovations Made in Products or Processes (5%) Partnerships with External Entities for Innovation (5%) ICT Use (5%)
Existence of R&D Department in the Company (5%) Strategy and
Organization (20%)
Actions by Top Management in Innovation Activities (6.67%) Encouraging Innovation by organization Culture (6.67%) Organizational Innovations (6.67%)
Accounting and Finance (20%)
R&D Investment (10%)
Credit Access for R&D Investment (10%) Marketing (20%) Marketing Innovations (20%)
Table 2 allows to build for each SME under analysis a profile of innovation with ‘1’s and ‘0’s, which is easy to interpret, and to compute individual multidimensional innovation
output add input scores. Once each SME is classified in either multidimensional output (input) innovative or non-innovative, the next step is to compute the MII vector that characterizes the group of SMEs under analysis. We next show an illustrative example of the MII framework computation for a group of three hypothetical SMEs: X, Y, and Z. The first step is to fill each SME innovation profile and check if it is multidimensional output (input) innovative, by computing the corresponding multidimensional innovation scores. Table 3 shows the values of the 20 partial indicators for each of the three SMEs considered.
18 Table 3
Innovation Profiles of SMEs X, Y, and Z
Dimension Partial indicator (weight) X Y Z
Ou tp u ts Knowledge and Technology (50%)
Product and/or Processes Innovations (16.67%) 1 0 0 Number of Workers (16.67%) 1 0 1 PCT Patents (16.67%) 0 0 0 Economic Effects (50%) Volume of Exports (10%) 1 0 1 Turnover (10%) 1 0 1 Patent Revenues (10%) 0 0 0 New Costumers (10%) 1 1 1 New Markets (10%) 1 0 0 In p u ts Human Resources (20%)
Workers by Skill Level (10%) 0 0 0 Training Investment (10%) 1 1 1
Processes and Infrastructures (20%)
Innovations Made in Products or Processes (5%) 1 0 1 Partnerships with External Entities for Innovation (5%) 1 0 1 ICT Use (5%) 1 0 0 Existence of R&D Department in the Company (5%) 1 0 0 Strategy and
Organization (20%)
Actions by Top Management in Innovation Activities (6.67%) 1 1 1 Encouraging Innovation by organization Culture (6.67%) 1 1 1 Organizational Innovations (6.67%) 0 0 1 Accounting and
Finance (20%)
R&D Investment (10%) 1 0 1 Credit Access for R&D Investment (10%) 1 0 0 Marketing (20%) Marketing Innovations (20%) 0 0 1
From Table 3, the multidimensional innovation output and input scores of SME X are respectively:
- 1*0.1667+1*0.1667+0*0.1667+1*0.1+1*0.1+0*0.1+1*0.1+1*0.1 = 0.733 > 0.5, for outputs, and
- 0*0.1 + 1*0.1 + 1*0.05 + 1*0.05 + 1*0.05 + 1*0.05 + 1*0.0667 + 1*0.0667 + 0*0.0667 + 1*0.1 + 1*0.1 = 0,633 > 0.5, for inputs.4
We conclude that SME X is multidimensional output innovative (0.733 > 0.5) and multidimensional input innovative (0,633 > 0.5). Similar calculations can be performed with SMEs Y and Z. Table 4 shows the multidimensional output and input innovation scores of the three SMEs. Only SME X is multidimensional output innovative. SMEs X and Z are both
4 It is also possible to compute for each SME the TFP of innovation. The TFP score of SME X is: 0.733/0.633
19
multidimensional input innovative. SME Y is neither multidimensional output innovative nor multidimensional input innovative.
Table 4
SMEs X, Y and Z Multidimensional Output and Input Innovation Scores
X Y Z
Multidimesnional Output Innovation Score 0.733 0.100 0.467 Is the firm Output-Innovative? Yes No No Multidimensional Input Innovation Score 0.633 0.233 0.700 Is the firm Input-Innovative? Yes No Yes
From Table 4, it is possible to compute the MII vector measures for the group constituted by the three SMEs:
MIIo = Ho x Ao = 1/3 x 0.733 = 0.244 (5) MIIi = Hi x Ai = 2/3 x [(0.633+0.700)/2] = 0.444 (6) MIIr = MIIo/MIIi = 0.244/0.444 = 0.550 (7) MIIa = (MIIo+MIIi)/2 = 0.244/0.444 = 0.344 (8)
4. Applying the MII framework to the SMEs of the Metalworking Industry in Portugal An online survey was conducted in late 2013 among a universe of 700 SMEs of the metalworking industry in Portugal. The questionnaire asked information referring to the 2012 civil year. A total of 45 SMEs responded, which represents about 6.4 percent of firms
surveyed.
20
Figure 1 and Figure 2 display respectively the distribution of the universe and of the sample by NUTS III territories and by Class of Economic Activity (CAE). Table 5 indicates the average scale of operation – number of workers and turnover – of the universe and of the sample. Figures 1 and 2 and Table 5 show the sample to be fairly representative of the universe. Most of the firms are from ‘Grande Porto’ NUTS III and from CAE 25 – ‘metal products, except machinery and equipment’, in the universe and in the sample (see Appendix
for mainland Portugal map of NUTS III territories and for the description of the Portuguese metalworking industry CAE). Average number of workers and turnover are similar, in the universe and in the sample.
Figure 1
Universe and Sample by NUTS III
0% 5% 10% 15% 20% 25% 30% 35% 40% 45% 50% Universe Sample
21 Figure 2
Universe and sample by Class of Economic Activity (CAE).
Table 5
Average Scale of Operation in 2012.
Average number of workers Average turnover per firm
Universe 55 € 5352515
Sample 58 € 5409632
Source: AIMMAP/Authors
Table 6 yields sample average characteristics of Portuguese metalworking industry SMEs in 2012. The average turnover of sample SMEs was slightly above € 5 million in 2012. ‘Exports’ represented 36.5 percent of the turnover, while ‘R&D and innovation expenditures’ only 1.4 percent. ‘Sales to new markets’ accounted for approximately 4.5 percent of ‘Turnover’, the weight of ‘Sales of innovative products’ being 6.5 percent. ‘New customers’ were about 9.1 percent of ‘Total customers’. Only two sample SMEs had ‘Patents’.
0 0.1 0.2 0.3 0.4 0.5 0.6 CAE
24CAE25CAE26CAE27CAE28CAE29CAE30CAE31CAE32CAE33CAE38CAE71
Universe Sample
22 Table 6
Sample SMEs Average characteristics in 2012.
Variable Average value in 2012
Number of workers 58 Turnover € 5409632.53 Exports € 1977192.55 R&D and innovation expenditures € 78094.61 Sales to new markets € 258642.90 Sales of innovative products € 404590.82 New customers 11.2 Total customers 123.3
Patents 0.7
Figures 3, 4, and 5 illustrate the distribution of workers by gender and by level of education in the sample. More than 75 percent of workers are males. More than 80 percent have a level of education III – ‘Upper Secondary education geared for further study at a higher level or less’. The weight of females in the workforce is superior in intermediate levels
of education when compared to other levels, representing half of workers with level IV - ‘Upper Secondary Education obtained in basic education courses or dual certification or
23 Figure 3
Workers by Gender
Figure 4
Workers by Level of Education
Level I – Lower Secondary Education
Level II – Upper Secondary Education obtained in basic education courses or dual certification Level III – Upper Secondary education geared for further study at a higher level
Level IV – Upper Secondary Education obtained in basic education courses or dual certification or geared for further studies at a higher level plus internship - minimum of 6 months
Level V – Qualification not greater than post-secondary level with credits for further study at higher level Level VI – Bachelor
Level VII – Master Level VIII – Doctoral
23% 77% Female Male 29% 33% 21% 3% 3% 10% 1% 0% level I level II level III level IV level V level VI level VII level VIII
24 Figure 5
Workers by Gender and Level of Education.
Figure 6 shows the distribution of sample firms by legal status. Sample SMEs are private limited firms, public limited firms and sole proprietorships. About 64 percent of the firms are private limited firms.
Figure 6
Distribution of Firms by Legal Status
Figure 7 illustrates the motivations behind innovation of sample SMEs. About 50 percent of sample SMEs selected ‘Market share increase’, ‘Production costs reduction’, and ‘Product quality improvement’ as motivations to invest in innovation. More than 30 percent
0% 10% 20% 30% 40% 50% 60% 70% 80% 90% 100% level I level
II levelIII levelIV levelV levelVI levelVII levelVIII
Female Male 64% 31% 5% private limited companies public limited companies sole proprietorships
25
selected ‘Opening new markets’ and ‘Producing for the customer’ as their motivations.
Around 20 percent selected ‘Obsolete products replace’ and ‘Product range increase’. ‘Environmental damage reduction’ and ‘Maintain market share’ do not seem to be major
motivations to invest in innovation for nearly all the firms. Finally, 5 percent of sample SMEs state the existence of ‘Other motivations’ besides the ones listed to invest in innovation and 7
percent answered ‘No motivation’.
Figure 7
Portuguese Metalworking Industry SMEs’ Motivations for Innovation
MII results
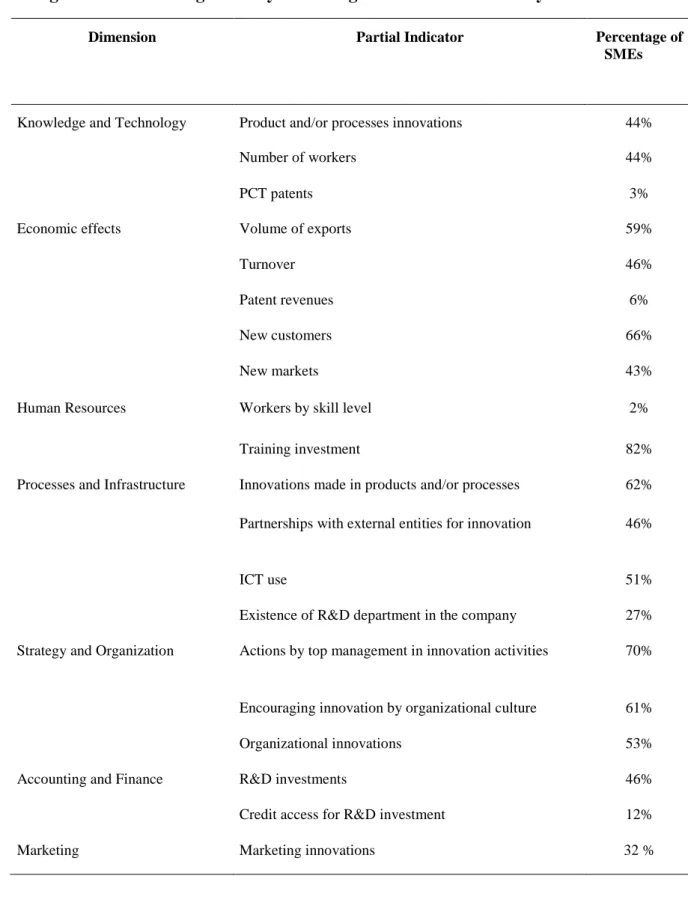
Table 7 gives the proportion of sample SMEs that show to be innovative in each of the twenty partial indicators.
0% 10% 20% 30% 40% 50% 60%
26 Table 7
Portuguese Metalworking Industry Percentage of Innovative SMEs by Partial Indicator
Dimension Partial Indicator Percentage of SMEs
Knowledge and Technology Product and/or processes innovations 44%
Number of workers 44%
PCT patents 3%
Economic effects Volume of exports 59%
Turnover 46%
Patent revenues 6%
New customers 66%
New markets 43%
Human Resources Workers by skill level 2%
Training investment 82%
Processes and Infrastructure Innovations made in products and/or processes 62%
Partnerships with external entities for innovation 46%
ICT use 51%
Existence of R&D department in the company 27%
Strategy and Organization Actions by top management in innovation activities 70%
Encouraging innovation by organizational culture 61%
Organizational innovations 53%
Accounting and Finance R&D investments 46%
Credit access for R&D investment 12%
Marketing Marketing innovations 32 %
27 Table 8
Sample SMEs MII Measures and Elements
Ho Ao MIIo Hi Ai MIIi MIIr MIIa
0.289 0.605 0.175 0.422 0.633 0.267 0.654 0,221
Ho = 0.289, that is, 28.9 percent of the firms are multidimensional innovative in terms of outputs. Ao = 0.605 is the average intensity of multidimensional innovation in terms of outputs of innovative firms. Thus, MIIo = Ho x Ao = 0.175 measures the incidence of innovation on the interval [0, 1] in what concerns to outputs of sample SMEs. Hi = 0.422, that is, 42.2 percent of the firms are multidimensional innovative in terms of inputs. Ai = 0.633 is the average intensity of multidimensional innovation in terms of inputs of innovative firms. Thus, MIIi = Hi x Ai = 0.267 measures the incidence of innovation on the interval [0, 1] in what concerns to inputs of sample SMEs. MIIr = MIIo/MIIi = 0.654, lies on the interval [0, +inf], and corresponds to the TFP of multidimensional innovation of sample SMEs. MIIa = (MIIo+MIIi)/2 = 0.404 is the average incidence of innovation in terms of outputs and inputs.
Differences across SMEs
We analysed the links between individual output (input) multidimensional composite scores of the sample SMEs and the variables used to characterize the sample, which from now on we designate as Z variables. The exercise allowed us to identify groups of most innovative SMEs and to characterize them by calculating the corresponding MII specific vector (MIIo, MIIi, MIIr, MIIa).
Available Z variables refer to scale of operation (‘Number of workers’ and ‘Turnover’), the share of exports on the turnover (‘Export ratio’), classes of economic activity
(‘CAE #’), the legal nature of the firms (‘Public limited companies’ and ‘Sole
proprietorship’), and NUTS III territorial location (‘Ave’, ‘Baixo Vouga’, ‘Entre Douro e
28
variables, such as CAE, legal nature of the firms, and NUTS III, dummy variables were considered distinguishing each class. NUTS III dummy variables capture observable and
non-observable effects not captured by other Z variables taken into account and they were considered just for estimation consistency.
The regression results are presented in Table 9 (see Table A2 in the Appendix for a description of the data). Concerning outputs, with a level of significance of 1 percent, ‘CAE
33’ affects multidimensional output innovation negatively. The effects of ‘CAE 71’ and ‘Sole proprietorship’ are positive. In what refers to inputs, with a level of significance of 1 percent,
‘CAE 71’ affects SMEs’ multidimensional input innovation negatively. With a level of
significance of 5 percent, the ‘Number of workers’ affects multidimensional input innovation positively, and ‘CAE 29’ has a negative effect. The coefficients of other variables such as ‘Export ratio’ are not significant, although having the expected signs.
Table 9
Explaining the Differences in Multidimensional Innovation across SMEs of the Portuguese Metalworking Industry
Individual multidimensional output innovation scores
Individual multidimensional input innovation scores
Coef. Std. Err. P>|t| Coef. Std. Err. P>|t|
Number of workers -.0408019 .122759 0.742 .193586 .0960733 0.055*** Turnover -.0125735 .1041714 0.905 -.148551 .0992244 0.147 Export ratio .1401962 .1395888 0.325 .0717037 .1740312 0.684 CAE 24 -.0170588 .0646838 0.794 .1831002 .1860233 0.344 CAE 27 .1591182 .1228386 0.207 .0030383 .1947514 0.988 CAE 28 -.1161001 .1275327 0.371 -.0400064 .1026777 0.700 CAE 29 -.1644721 .1345675 0.233 -.1896955 .1064041 0.087*** CAE 30 -.0352127 .0992237 0.190 -.0761066 .1144514 0.635 CAE 32 -.3159792 .1104988 0.726 .1422944 .1177671 0.225
29
CAE 33 -.7529799 .1384438 0.008* -.0421088 .10533 0.724
CAE 71 .2873827 .2131566 0.000* -.7507715 .158575 0.000*
Public limited companies .117701 .1006021 0.253 .0259934 .0990508 0.795
Sole proprietorship .4992659 .1393381 0.001* .5328428 .095483 0.000* NUTS III Ave .2402359 .115921 0.049** .1481365 .2107581 0.489
NUTS III Baixo Vouga .0368534 .1116215 0.744 .0688489 .1316794 0.606
NUTS III Entre Douro e Vouga
.0785803 .1220637 0.526 .0764345 .1163557 0.517
NUTS III Pinhal Interior Norte
-.2149487 .0975117 0.037** .1206598 .100672 0.242
NUTS III Pinhal Litoral .3185134 .1187465 0.013** .4271834 .1096129 0.001*
NUTS III Tâmega -.2268606 .1248031 0.081** -.2134692 .1739322 0.231
Constant .3205571 .0956796 0.003* .327097 .1070552 0.005* *p < 0.01; **p < 0.05, and ***p < 0.10; N=45; Robust estimation.
The results of the regressions must be interpreted with caution, given the small size of the sample and of each group of observations.5 Nonetheless, they confirmed some of the findings of the literature. In particular, the ‘Number of workers’ (a measure of scale of operation) has a significant and positive impact on multidimensional input innovation, which supports the Schumpeterian hypothesis of a positive relationship between firm size and innovative activity, within the SMEs of the metalworking industry in Portugal. In Table 10, we distinguish the MII composite measures for the groups of small SMEs (with a number of workers from 10 to less than 50) and medium SMEs (with a number of workers from 50 to less than 250).
5 For instance, Sole proprietorship corresponds to only two firms of the sample (see Table A3 in the
30 Table 10
Portuguese Metalworking Industry SMEs MII Composite Measures
Sample Small SMEs (10 to less than 50 workers) Medium SMEs (50 to less than 250 workers) MIIo 0.175 0.122 0.308 MIIi 0.267 0.192 0.449 MIIr 0.654 0.636 0.686 MIIa 0.221 0.157 0.404
From Table 10, it is noteworthy that the group of small (medium) SMEs has lower (higher) MII composite measures than the total sample.
5. Conclusions
We developed a Counting MII framework for measuring and benchmarking innovation of SMEs.
The methodology behind the MII is similar to the methodology behind the UN MPI and follows the innovation definitions stipulated by the OECD Oslo Manual, covering dimensions and partial indicators appearing in the IUS and in the GII. The MII framework starts by computing individual partial and multidimensional innovation output and input scores. The MII vector considers 4 multidimensional innovation composite measures that characterize the group of SMEs, the industry or the country being analysed: i) the first (MIIo) measures the incidence and intensity of innovation in terms of outputs, and lies on the interval [0, 1]; ii) the second (MIIi) measures the incidence and intensity of innovation in terms of inputs, and lies on the interval [0, 1]; and iii) the third (MIIr) measures the TFP of innovation
31
and lies on the interval [0, +inf]; the fourth (MIIa) measures the average multidimensional innovation in terms of outputs and inputs, and lies on the interval [0, 1].
To illustrate the MII, a survey was conducted among SMEs of the metalworking industry in Portugal. Results show that, in 2012, about 29 percent of SMEs in the Portuguese metalworking industry were multidimensional innovative in terms of outputs and 42 percent were multidimensional innovative in terms of inputs. The average intensity of multidimensional innovation of innovative SMEs in terms of outputs was 0.605, while the average intensity of multidimensional innovation of innovative SMEs in terms of inputs was 0.633. The MII vector was thus [MIIo; MIIi; MIIr; MIIa] = [0.175, 0.267, 0.654, 0.221], showing that there is still much to be done in what refers to innovation of the industry SMEs.
Significant differences were found across sample SMEs in what concerns to individual multidimensional output and input innovation scores. These differences are explained by factors such as the number of workers, class of economic activity, and legal status of SMEs, a few of the Z variables considered. They allow to identify, characterize, and compare different groups of SMEs in the industry in what refers to multidimensional innovation, by computing the corresponding and specific MII vectors. This exercise was done for the groups of small and medium sample SMEs. When compared with the sample, the group of small (medium) SMEs has lower (higher) MII composite measures, which supports the Schumpeterian hypothesis of a positive relationship between firm size and innovative activity, within the SMEs of the industry.
There are issues to explore in future research. The set of partial indicators of innovation considered can be adjusted, particularly if analysing SMEs of developing countries. The weights and the cut-offs of the counting dual cut-off method employed are normative and they can also be adjusted by experts. These changes do not alter the nature and
32
the properties of the counting dual cut-off method employed to measure multidimensional innovations of SMEs.
References
Acs, Zoltan J., and David B. Audretsch (1988). ‘Innovation in Large and Small Firms: An Empirical Analysis,’
American Economic Review, 78, 678–690.
Acs, Zoltan J., and David B. Audretsch (1990). Innovation and Small Firms. Cambridge, Massachusetts: MIT Press.
Acs, Zoltan J. (2002). Innovation and the growth of cities. Cheltenham, Gloucestershire: Edward Elgar.
Alkire, Sabina, and Maria E. Santos (2010). ‘Acute Multidimensional Poverty: A New Index for Developing Countries,’ Oxford, Oxfordshire: Department of International Development.
Alkire, Sabina, and James Foster (2011). ‘Counting and multidimensional poverty measurement,’ Jornal of Public Economics, 95, 476-487.
Alkire, Sabina, and Maria E. Santos (2014). ‘Measuring Acute Poverty in the Developing World: Robustness and Scope of the Multidimensional Poverty Index,’ World Development, 59, 251–274.
Alkire, sabina, and Mauricio Apablaza (2016), Mutidimensional Poverty in Europe 2006-2012: Illustrtaing a Methodology, OPHI Working Paper No. 74, Oxford Department of International Development, QEH, University of Oxford.
Andries, Petra, and Dirk Czarnitzki (2014), ‘Small firm innovation performance and employee involvement,’
Small Business Economics, 43, 21–38.
Antonelli, Cristiano, and Giuseppe Scellato (2015). ‘Firms size and directed technological change,’ Small
Business Economics, 44, 207–218.
Atkinson, Anthony B. (2003), “Multidimensional deprivation contrasting social welfare and counting approaches”, Journal of Economic Equality, 1, 51-65.
Audretsch, David B., Coad, Alex, and Agustí Segarra (2014). ‘Firm growth and innovation,’ Small Business
Economics, 43, 743–749.
Badawy, Michael K. (1986). ‘How To Prevent Creativity Mismanagement,’ Research Management, 29(4), 28-35.
Barge-Gil, Andrés (2010). ‘Open, Semi-Open and Closed Innovators: Towards an Explanation of Degree of Openness,’ Industry and Innovation, 17(6), 577-607.
Beneito, Pilar, Rochina-Barrachina, María E., and Amparo Sanchis (2014). ‘Patents, Competition, and Firms’ Innovation Incentives,’ Industry and Innovation, 21(4), 285–309.
Bettencourt, Luís M.A., Lobo, José, and Deborah Strumsky (2007). ‘Invention in the city: Increasing returns to patenting as a scaling function of metropolitan size,’ Research Policy, 36, 107–120.
Bloom, Nicholas., Genakos, Christos, Sadun, Raffaella, and John Van Reenen (2012). “Management practices across fims and countries”, Academy of Management Perspectives, vol. 26, no. 1, 12–33; published ahead of print 5 December 2011.
Bloom, Nicholas, Lemos, Renata, Sadun, Raffaela, Scur, Daniela, and John Van Reen (2014). The New Empirical Economics of Management, Centre for Economic Performance, Occasional paper 41.
33
Brancati, Emanuele (2015). ‘Innovation financing and the role of relationship lending for SMEs,’ Small Business
Economics, 44, 449–473.
Breschi, Stefano, and Francesco Lissoni (2001). ‘Knowledge Spillovers and Local Innovation: A critical Survey,’ Industrial and Corporate Change, 10(4), 975–1005.
Brockman, Beverly K., Jones, Michael A., and Richard C. Becherer (2012). ‘Customer Orientation and Performance in Small Firms: Examining the Moderating Influence of Risk-Taking, Innovativeness, and Opportunity Focus,’ Journal of Small Business Management, 50(3), 429–446.
Burr, Thomas (2014). ‘Innovation in Consumer Markets: French and American Bicycles, 1860s – 1920s,’
Industry and Innovation, 21(6), 513–531.
Castillo, Victoria, Maffioli, Alessandro, Rojo, Sofía, and Rodolfo Stucchi (2014). ‘The effect of innovation policy on SMEs’ employment and wages in Argentina,’ Small Business Economics, 42, 387–406.
Carsrud, Alan, and Malin Brännback (2011). ‘Entrepreneurial Motivations: What Do We Still Need to Know?,’
Journal of Small Business Management, 49(1), 9-26.
Cchini, Alessandro S., and Venturini, Francesco (2014). ‘R&D and Productivity in High-Tech Manufacturing: A Comparison between Italy and Spain,’ Industry and Innovation, 21(5), 359–379.
Chauvel, Daniele (2011). ‘Leading Issues in Innovation,’ in Leading Issues in Innovation Research, Edited by Daniele Chauvel, Reading, UK: Academic Publishing International Ltd.
Chesbrough, Henry W. (2003). Open Innovation. Boston, Massachusetts: Harvard Business School Press. Classen, Nicolas, Carree, Martin, Van Gils, Anita, and Bettina Peters (2014). ‘Innovation in family and
non-family SMEs: an exploratory analysis,’ Small Business Economics, 42, 595–609.
Cohendet, Patrick, Grandadam, David, and Laurent Simon (2010). ‘The Anatomy of the Creative City,’ Industry
and Innovation, 17(1), 91-111.
Cornell University, INSEAD, and WIPO (2015). ‘The Global Innovation Index 2015: Effective Innovation Policies for Development.’ Soumitra Dutta, Bruno Lanvin, and Sacha Wunsch-Vincent Editors.
https://www.globalinnovationindex.org/content/page/gii-full-report-2015#pdfopener
COTEC (2014). ‘Innovation Digest: Janeiro 2014.’, http://www.barometro.cotecportugal.pt.
Currid, Elizabeth (2007). The Warhol Economy: How Fashion And Music Drive New York City. Princeton, New Jersey: Princeton University Press.
Deschryvere, Matthias (2014). ‘R&D, firm growth and the role of innovation persistence: an analysis of Finnish SMEs and large firms,’ Small Business Economics, 43, 767–785.
D'Este, Pablo, Rentocchini, Francesco, and Jaider Vega-Jurado (2014). ‘The Role of Human Capital in Lowering the Barriers to Engaging in Innovation: Evidence from the Spanish Innovation Survey,’ Industry and
Innovation, 21(1), 1–19.
Dosi, Giovanni (1982). ‘Technological paradigms and technological trajectories,’ Research Policy, 11, 147-162. Esteve-Pérez, Silviano, and Diego Rodríguez (2013), ‘The dynamics of exports and R&D in SMEs,’ Small
Business Economics, 41, 219–240.
European Commision (2015). ‘Entreprise and Industry.’, <http://ec.europa.eu/enterprise/policies/sme/facts-figures-analysis/sme-definition/index_en.htm> Accessed on May 2015.
Florida, Richard (2002). The rise of the creative class. New York, New York: Basic Books. Florida, Richard (2009). Whose your city? New York, New York: Basic Books.
Foreman-Peck, James (2013). ‘Effectiveness and efficiency of SME innovation policy,’ Small Business
34
Freeman, Chris, and Luc Soete (1997). The Economics of the Industrial Innovations (3rd ed). UK, The MIT
Press, Reprinted 2004 by Routledge.
Freeman, Chris, and Francisco Louçã (2001). As time goes by: From the industrial revolutions to the information
revolution. Oxford: Oxford University Press.
Godin, Benoît (2008) ‘Innovation: the History of a Category,’ Working Paper No. 1, Project on the Intellectual History of Innovation, Montreal: INRS. 62 p.
Gronum, Sarel, Verreynne, Martie-Louise and Tim Kastelle (2012). ‘The Role of Networks in Small and Medium-Sized Enterprise Innovation and Firm Performance,’ Journal of Small Business Management, 50(2), 257-282.
Hall, Bronwyn H., Lotti, Francesca, and Jacques Mairesse (2009). ‘Innovation and productivity in SMEs: empirical evidence for Italy,’ Small Business Economics, 33, 13-33.
Hall, Bronwyn H. (2011).‘Innovation and productivity,’ Nordic Economic Policy Review, 2, 167 – 195.
Harhoff, Dietmar (1998). ‘R&D and productivity in German manufacturing firms,’ Economics of Innovation and
New Technology, 6, 29–49.
Hunt, S.D. (1983), Marketing Theory: the Philosophy of Marketing Science, Richard D. Irwin, Inc., New York. IAPMEI (2014). ‘Benchmarking e Boas práticas: Índice Português.’
<http://www.iapmei.pt/resources/download/relatorio_tipo.pdf> Accessed on May 2015.
Janz, Norbert, Hans Lööf, and Bettina Peters (2004). ‘Firm level innovation and productivity - is there a common story across countries?,’ Problems and Perspectives in Management, 2, 1–22.
Joyce, William, Nohria, Nitin, and Bruce Roberson (2004). What (Really) Works: The 4+2 Formula for
Sustained Business Success. New York: HarperBusiness.
Klette, Tor J., and Frode Johansen (1998). ‘Accumulation of R&D Capital and Dynamic Firm Performance: A Not-so-Fixed Effect Model,’ Annales D’Économie Et De Statistique, No. 49/50, 389-419.
Klette, Tor. J., and Samuel Kortum (2004). ‘Innovating firms and aggregate innovation’, Journal of Political
Economy, 112(5), 986–1018.
Kobayashi, Yohei (2014). ‘Effect of R&D tax credits for SMEs in Japan: a microeconometric analysis focused on liquidity constraints,’ Small Business Economics, 42, 311–327.
Landry, Charles (2008). The creative city: A toolkit for innovators. Second Edition. London, London: Earthscan. Lasagni, Andrea (2012). ‘How Can External Relationships Enhance Innovation in SMEs? New Evidence for
Europe,’ Journal of Small Business Management, 50(2), 310–339.
Laursen, K., and Salter, A. (2006). ‘Open for innovation: The role of openness in explaining innovation performance among U.K. manufacturing firms,’ Strategic Management Journal, 27: 131–150.
Lam, Alice (2005), “Organizational Innovation”, Chapter 5 in J. Fagerberg, D. Mowery and R.R. Nelson (eds.), The Oxford Handbook of Innovation, Oxford University Press, New York.
Lazonick, W. (2005). ‘The innovative firm,’ in The Oxford Hand Book of Innovation, Eds. Fagerberg, Jan, David C. Mowery, and Richard R. Nelson, New York: Oxford University Press, 29-55.
Lee, Neil, and Andrés Rodríguez-Pose (2014), ‘Innovation in Creative Cities: Evidence from British Small Firms,’ Industry and Innovation, 21(6), 494–512.
Lejarraga, José, and Ester Martinez-Ros (2014). ‘Size, R&D productivity and Decision Styles,’ Small Business
Economics, 42, 643–662.
Lichtenberg, Frank R., and Donal Siegel (1991). ‘The impact of R&D investment on productivity: New evidence using linked R&D-LRD data,’ Economic Inquiry, 29(2), 203–228.
35
Lööf, Hans, and Börje Johansson (2014). ‘R&D Strategy, Metropolitan Externalities and Productivity: Evidence from Sweden,’ Industry and Innovation, 21(2), 141–154.
Lotti, Francesca, and Enrico Santarelli \(2001). ‘Linking Knowledge to Productivity:A Germany–Italy Comparison Using the CIS database,’ Empirica, 28, 293–317.
Madrid-Guijarro, Antonia, García-Pérez-de-Lema, Domingo, and Howard Van Auken (2013). ‘An Investigation of Spanish SME Innovation during Different Economic Conditions,’ Journal of Small Business
Management, 51(4), 578–601.
Maes, Johan, and Luc Sels (2014). ‘SMEs’ Radical Product Innovation: The Role of Internally and Externally Oriented Knowledge Capabilities,’ Journal of Small Business Management, 52(1), 141–163.
Montgomery, John (2007). The New Wealth of Cities: City Dynamics and the Fifth Wave. Aldershot, Hampshire, England: Ashgate Publishing Limited.
Nelson, Richard R. and Sidney G. Winter (1982), An Evolutionary Theory of Economic Change, Belknap Press of Harvard University Press, Cambridge, Massachusetts, and London, England.
OECD (2005). Oslo Manual: Guidelines for Collecting and Interpreting Innovation. Third Edition. Paris, Île-de-France: OECD Publishing.
OECD (2008). Handbook on Constructing Composite Indicators: Methodology and User Gude. Paris, OECD Publications. Available at https://www.oecd.org/std/42495745.pdfParida, Vinit, Westerberg, Mats, and Johan Frishammar (2012). ‘Inbound Open Innovation Activities in High-Tech SMEs: The Impact on Innovation Performance,’ Journal of Small Business Management, 50(2), 283–309.
Parisi, Maria L., Fabio Schiantarelli, and Alessandro Sembenelli (2006). ‘Productivity innovation and R&D: Micro evidence for Italy,’ European Economic Review, 50(8), 2037–2061.
Parrilli, Mario Davide, and Aitziber Elola (2012), ‘The strength of science and technology drivers for SME innovation,’ Small Business Economics, 39, 897–907.
Partanen, Jukka, Chetty, Sylvie K. and Arto Rajala (2014). ‘Innovation Types and Network Relationships,’
Entrepreneurship Theory and Practice, September, 1027-1055.
Pereira, Nuno C. (2014). ‘Um sistema de indicadores de inovação para as pequenas e médias empresas do setor metalúrgico e metalomecânico,’ Relatório de Estágio, Mestrado em Business Economics, Faculdade de Economia e Gestão, Universidade Católica Portuguesa.
Ray, Debraj (1998). Development Economics. Princeton: Princeton University Press.
Revilla, António, and Zulima Fernández (2013). ‘Environmental Dynamism, Firm Size and the Economic Productivity of R&D,’ Industry and Innovation, 20(6), 503-522.
Romer, Paul M. (1990). ‘Endogenous Technological Change,’ Journal of Political Economy, 98, 71-102. Rosenbusch, Nina, Brinckmann, Jan, and Andreas Bausch (2011). ‘Is innovation always beneficial? A
meta-analysis of the relationship between innovation and performance in SMEs,’ Journal of Business Venturing, 26, 441 –457.
Sahut, Jean-Michel, and Marta Peris-Ortiz (2014). ‘Small business, innovation, and entrepreneurship,’ Small
Business Economics, 42, 663-668.
Saltelli, Andrea (2007). “Composite Indicators Between Analysis and Advocacy”, Social Indicators Reasearch, 81, 65-77
Schumpeter, Joseph A. (1911). The Theory of Economic Development: An Inquiry into Profits, Capital,
Credit, Interest and the Business Cycle, translated from the German by Redvers Opie in 1934, 2008,
New Brunswick (U.S.A) and London (U.K.): Transaction Publishers.
Sen, Amartya.K., (1993). ‘Capability and Well-Being’. In: Nussbaum, M., Sen, A.K. (Eds.), Quality of Life. Clarendon Press, Oxford, pp. 30–53.
36
Shearmur, Richard (2012). ‘Are cities the font of innovation? A critical review of the literature on cities and innovation,’ Cities, 29(2), S9–S18.
Solow, Robert M. (1956). ‘A Contribution to the theory of Economic Growth,’ Quarterly Journal of Economics, vol. 70, 65-94.
Solow, Robert M. (1957). ‘Technical Change and the Agregate Production Function,’ The Review of Economics
and Statistics,vol. 39(3), 312-320.
Spithoven, André, Vanhaverbeke, Wim, and Nadine Roijakkers (2013). ‘Open innovation practices in SMEs and large enterprises,’ Small Business Economics, 41, 537–562.
Stiglitz, Joseph E. (2014). ‘Creating An Innovation Society,’ Social Europe, on 4 June 2014, http://www.socialeurope.eu/2014/06/innovation-society/ Accessed on 9 July 2014.
Thompson, Peter, and Melanie Fox-Kean (2005). ‘Patent Citations and Geographic Spillovers: A Reassessment,’
American Economic Review, 95(1), 450–460.
UNU-MERIT (2015). ‘Innovation Union Scoreboard 2014.’ Report prepared for the European Commision by Hugo Hollanders and Nordine Es-Sadki from the Maastricht Economic and Social Research Institute on Innovation and Technology (UNU-MERIT), coordinated and guided by Bonifacio Garcia Porras, Head of Unit, Mark Nicklas and Tomasz Jerzyniak. http://ec.europa.eu/enterprise/policies/innovation/files/ius/ius-2014_en.pdf.
Van Leeuwen, George, and Luuk Klomp (2006). ‘On the contribution of innovation to multi-factor productivity growth,’ Economics of Innovation and New Technology, 15 (4-5), 367–390.
Verbees, Frans J. H. M., and Matthew T. G. Meulenberg (2014), ‘Market Orientation, Innovativeness, Product Innovation, and Performance in Small Firms,’ Journal of Small Business Management, 42(2), 134–154. Verspagen, Bart (2005). ‘Innovation and Economic Growth,’ in The Oxford Hand Book of Innovation, Eds.
Fagerberg, Jan, David C. Mowery, and Richard R. Nelson, New York: Oxford University Press, 487-513. Wang, Yuan D., Sutherland, Dylan, and Lutao Ning (2014). ‘A Dynamic Comparative Analysis of International
Innovation Networks in Emerging Market MNCs,’ Industry and Innovation, 21(6), 457–475.
Williams, Leslie K., and Stephen J. McGuire (2010). ‘Economic creativity and innovation implementation: the entrepreneurial of growth? Evidence from 63 countries,’ Small Business Economics, 34, 391-412.
37 APPENDIX
TABLES
Table A1
Description of Portuguese Metalworking Industry CAE
CAE # Description
CAE 24 Based metal manufacture.
CAE 25 Manufacture of fabricated metal products, except machinery and equipment.
CAE 27 Manufacture of electrical equipment.
CAE 28 Manufacture of machinery and equipment, n.p.
CAE 29 Manufacture of motor vehicles, trailers, semi-trailers and components for motor vehicles.
CAE 30 Manufacture of other transport equipment.
CAE 32 Other manufacturing industries.
CAE 33 Repair and installation of machinery and equipment.
CAE 71 Activities architectural, engineering and related techniques; activities of testing and
analysis techniques.
Source: Statistics Portugal
Table A2
Description of regression variables.
Output Multidimensional Innovation Score Input Multidimensional Innovation score NUTS III # CAE # Number of Workers (10^2) Turnover (10^6 euros) Export Ratio Legal Status 0.6334 0.7334 3 28 0.47 0.4577886 0.41 2 0.8001 0.6334 2 25 0.18 0.075926389 0.32 2 0.7001 0.4667 4 25 0.11 0.0622335 0.03 2 0.1667 0.3667 2 25 0.24 1.5 0.10 2 0.4834 0.4334 2 25 0.16 0.12 0.01 2 0.1 0.3 3 25 0.06 0.515191284 0.35 2 0.3 0.3 3 25 0.55 0.515191284 0.35 2