ECOGRAPHY 24: 68 – 82. Copenhagen 2001
Phytophagous insects and web-building spiders in relation to
pasture vegetation complexity
Paulo A. V. Borges and Valerie K. Brown
Borges, P. A. V. and Brown, V. K. 2001. Phytopahgous insects and web-building spiders in relation to pasture vegetation complexity. – Ecography 24: 68 – 82.
We investigate the potential use of structural characteristics of vegetation as predic-tors of the densities of pasture arthropods in three Azorean islands. Two types of upland pastures, recent sown pastures (3 – 4 yr old) and wet semi-natural old pastures
(\35 yr old), were studied in three Azorean islands (S. Maria, Terceira and Pico).
Three arthropod assemblages, of particular importance in pasture habitats, were assessed: insect forb-feeders, insect grass-feeders and web-building spiders. These are numerically abundant and represent a range of feeding strategies. Point quadrats for plants and suction (Vortis) for arthropods were used as sampling methods. Several vegetation indices were investigated, but only three (cover abundance of perennial forbs, cover abundance of perennial grasses and the total vegetation alpha-diversity) were good predictors of invertebrate abundance. Vegetation structure, defined by a Height Index, was of minor predictive value. In sown and semi-natural pastureland, diverse and structurally complex pasture sites support more individual insect forb-feeders, grass-feeders and web-building spiders per unit area than less complex ones.
P. A. V. Borges and V. K. Brown, NERC Centre for Population Biology, Imperial College, Silwood Park Ascot, Berks, U.K. SL5 7PY(present address of P. A. V. B.:
Uni6. dos Ac¸ores, Dept de Ciencias Agra´rias, Terra-Cha˜, PL-9700Angra do
Hero-ı´smo, Terceira, Ac¸ores, Portugal, [email protected]). The role of herbivorous invertebrates in grassland
dy-namics has been considered subtle (Crawley 1990), while other studies have demonstrated that insect her-bivory can be a major determinant of plant community structure and composition (Gange and Brown 1989, Brown et al. 1990, Brown and Gange 1992). Moreover, invertebrate herbivores are known to cause production losses in grassland systems (Henderson 1978, Curry 1994) and can significantly alter community composi-tion and productivity in ecosystems (Huntly 1991, Tscharntke and Greiler 1995).
Grassland arthropod predators may also be impor-tant in shaping the community structure of their food source, including invertebrate herbivores (Strong et al. 1984, Siemann et al. 1998), but there is little strong evidence for this hypothesis (Stilling 1988, Curry 1994). For instance, there is no theory predicting when natural enemies will exert significant mortality in polycultures
(Andow 1991) and little evidence that spider popula-tions cause significant density-dependent mortality in prey populations (Wise 1995).
The density and diversity of grassland invertebrates depends on a number of factors: 1) the abundance of invertebrates changes with the seasonal mean tempera-ture in temperate grasslands (Usher 1978). Physical features of the environment (e.g. temperature, moisture) may, therefore, act directly on the physiology of the invertebrates, but may also have indirect effects through the supply of plant food and the quality of habitats (Curry 1994); 2) concentration of resources is also important (Strong et al. 1984). The ‘‘resource concentration hypothesis’’ (Root 1973) predicts that ‘‘herbivores are more likely to find and remain on hosts that are growing in dense or nearly pure stands’’. Thus, the abundance of specialist herbivores will be lower in polycultures, since it is less likely that they will be able Accepted 14 March 2000
Copyright © ECOGRAPHY 2001 ISSN 0906-7590
to locate their host-plant in a diverse mosaic (Bach 1980, Andow 1991). In practical terms, this model predicts that arthropod pest outbreaks are more likely to occur in monocultures than in polycultures (Andow 1991). Moreover, as specialist and generalist natural enemies are more diverse in polycultures (Root 1973, Bach 1980, Andow 1991), the ‘‘enemies hypothesis’’ (Root 1973) also predicts that herbivore population densities are lower in polycultures than in monocul-tures; 3) management of pastures has an important impact on arthropod species composition, density and diversity (e.g. Morris 1973, 1990a, b, c, Rushton et al. 1989, Brown et al. 1990, Good and Giller 1991, Dennis et al. 1998). Grazing induces changes in habitat struc-ture that influence the diversity and density of passtruc-ture arthropods (Brown et al. 1992, Gibson et al. 1992a, b, Curry 1994). Plant species architecture (Lawton 1983, Stinson and Brown 1983, Strong et al. 1984, Haysom and Coulson 1998) and habitat structure (Southwood et al. 1979, Lawton and Strong 1981, Brown and South-wood 1987, Brown 1991a, b, Denno and Roderick 1991, Gardner et al. 1995) were shown to be important in determining the diversity and abundance of phy-tophagous insects. In fact, the relationship between diversity and habitat complexity is viewed as a general pattern in community ecology (Schluter and Ricklefs 1993). For instance, predators, such as web-building spiders, might be expected to have relatively predictable assemblages based on habitat structure (Uetz 1991, Gibson et al. 1992a, Wise 1995).
In this paper, we investigate the potential use of characteristics of the vegetation to predict the densities of pasture arthropods. Three groups of arthropod as-semblages are investigated: insect forb-feeders, insect grass-feeders and web-building spiders, since these as-semblages are the main groups in the pasture habitats studied, and present a range of feeding strategies. Web-building spiders are particularly suitable for this study, since they are expected to be directly dependent on vegetation structural complexity and respond to varia-tion in plant architecture at very localized scales (Gib-son et al. 1992a).
Materials and methods
Sites and experimental design
A detailed description of the sites is presented elsewhere (see Borges 1997, Borges and Brown 1999). In sum-mary, two 900 m2 replicates of upland recently sown
pastures (3 – 4 yr old) and upland wet semi-natural old pastures (\35 yr old) were selected in three Azorean islands (Santa Maria, Terceira and Pico). These pasture types are referred to as habitats. In order to manipulate and standardize the periods of cattle grazing, all the 12 sites (3 islands × 2 habitats × 2 replicates) were fenced
during January and February 1994, with additional rabbit fences being erected in April 1994. In addition, in each of the 900 m2replicates, 20 3 × 3 m plots were
demarcated. Because of the different geometry of the main pastures, the 12 field sites were of two shapes: seven had a 5 × 4 configuration of plots and five had three rows of eight plots, with the last four being omitted from sampling. All the fenced sites were grazed regularly by dairy and beef cattle, thereby maintaining the traditional management of the sites.
Sampling
Sampling occurred at least three weeks after a grazing period, to allow regrowth of the vegetation. Vegetation and arthropod data were collected in the spring, sum-mer and autumn 1994 and sumsum-mer 1995. The vegeta-tion was sampled by point-quadrats and the arthropods by suction.
Vegetation
Vegetation was sampled using a frame, comprising ten equally-spaced vertical 3 mm diameter point-quadrat pins, as used by V. K. Brown and colleagues at Silwood Park (see also Gibson et al. 1987). In each of the 20 plots, two linear frames were placed at random. The number of touches of each living plant species was recorded in 2 cm (B10 cm) or 5 cm (10 cm and above) height intervals, to provide a measure of sward archi-tecture. Thus, a total of 400 pins was used for each field site on each sampling occasion.
Data were collated to give a range of measures: Co6er abundance (ca)
Was calculated as the total number of touches of a species on 400 height-profile point-quadrat pins. This measure gives a reliable estimate of cover abundance (also referred to as cover) for a species (Brown et al. 1988), and can be related to biomass. As most forb and grass species in the sites were perennial, the perennial forb cover abundance (PEFca) and the perennial grass cover abundance (PEGca) were selected as potential explanatory variables of arthropod abundance. Height(ht)
Is a measure of plant structure. The weighted mean height of the total vegetation (V-ht), of the perennial forbs (PEF-ht) and of the perennial grasses (PEG-ht) was calculated for each plot (20 pins) using the expression: %N i = 1 (hi× ni),% N i = 1 (ni)
where hi= the midpoint of the height class i, ni=
num-ber of touches at height class i and N = numnum-ber of height classes represented in the sample (Gibson et al. 1987). Means were taken from 20 plots for each site on each sampling occasion.
William’sh di6ersity (W-h)
The index of plant diversity used was the William’sa index (a) (see Southwood 1978):
S =a ln (1+N/a)
Plant structural diversity was assessed from the multiple touch data, using the above formula where S was the summation of the number of species in each height class and N the total of number of touches in the sample (see Stinson and Brown 1983, Brown and Gange 1989). This index (W-a) was only calculated for the total vegetation in each plot. Means were taken from 20 plots for each field site for each sampling occasion.
Species richness
The mean number of vascular plant species touching the point-quadrat pins (‘‘Sprich’’) was used as a mea-sure of plant species richness. Species touching all the pins in each plot are clearly the most frequent species in the sites. This measure was calculated for all vascular plant species and means were estimated from 20 plots for each site on each sampling occasion. In addition, two other measures of species richness were used: total forb species (‘‘tFspp’’) and total grass species (‘‘tGspp’’). In both cases, species richness was obtained by pooling the 20 plots.
Invertebrates
A ‘‘Vortis’’ suction apparatus was used. Sampling was carried out between 11.00 and 18.00 on warm, sunny days when the vegetation was dry. In each of the 20 plots in each field site, four random subsamples were taken, one in each corner of the 3 × 3 m square plots (a total area of 0.8 m2). The collection nozzle was held in
position for 30 s on each occasion. To speed the sampling (important in the changeable weather in the Azores) and to simplify sorting, the four subsamples in a plot were taken successively without changing the collection vial. The samples were stored in 70% ethanol with glycerol prior to sorting.
The arthropod assemblages studied comprised: grass-feeders – all sucking and chewing herbivorous insect species reported to feed on grasses; forb-feeders – as above though reported to feed on forbs; web-building spiders – all species of Tetragnathidae, Araneidae, Linyphiidae, Theridiidae and Dictynidae. Dietary infor-mation for the insect herbivores was either taken from
the literature or given by different specialists (see Ac-knowledgements). For the spiders, families were as-signed to the web-building assemblage following Roberts (1995) and Wise (1995). The abundance of arthropods is given as the mean number of individuals m− 2in each field site. All specimens, including adults
and juveniles, were included in estimates of species abundance. In Appendix 1, the abundance for a species was obtained taking the mean abundance in the four available samples per site. Only the samples where a species occurred were considered for calculation. As the frequency distribution of abundance within each species was shown to be right skewed, the geometric mean was chosen instead the arithmetic mean.
Data analysis
GLIM (Crawley 1993) procedures were used to investi-gate differences in the vegetation explanatory variables and in the arthropod abundance between sampling events, between islands nested within sampling events and between habitats nested within islands.
Multiple regressions were also performed using GLIM to obtain the minimal adequate model explain-ing the greatest variation in density of the three inverte-brate groups. A maximal model was fitted, including the following explanatory variables: W-a, PEFca, PEF-ht, tFspp in predicting the abundance of forb-feeding insects; W-a, PEGca, PEG-ht, tGspp in predicting the abundance of grass-feeding insects. A preliminary anal-ysis indicated that the best variables in predicting the abundance of web-building spiders were W-a, PEGca, V-ht and Sprich.
Model simplification was achieved by deleting non-significant terms from the model, until none could be removed without causing an increase in deviance with pB0.05. The response variables were consistently loga-rithmically transformed in order to equalize variance and improve normality of errors. Transformation (loga-rithmic or square root) of the explanatory variables was used where necessary to improve normality of errors.
The observations for the different sampling occasions arise from the same experimental plots and were not, therefore, independent. Thus, each sampling event was analysed independently. As will be shown below, there was a habitat effect in several of the response and explanatory variables. Thus, each habitat was also analysed independently. As there are three response variables (insect forb-feeding density, insect grass-feed-ing density and web-buildgrass-feed-ing spider density), two habi-tats (sown and semi-natural pastures) and four sampling occasions (spring, summer and autumn 1994, summer 1995), twentyfour (3 × 2 × 4) multiple regres-sion analyses were performed.
Results of analyses are expressed in tables, each composed of 16 probabilities (4 sampling periods × 4
explanatory variables removed from each maximum models). Thus, to adjust for multiple comparisons we accepted the vegetation indices probabilities at a con-servative Bonferroni-correcteda% of 0.0031.
Only six points and four degrees of freedom are available in each multiple regression. This is unavoid-able because of the nature and extent of the study. The results are therefore discussed in terms of their biologi-cal relevance.
Results
A total of 73 species of vascular plants (52 forbs and 21 grasses) were sampled by point-quadrats in the 12 sites. Fourtythree forbs and 20 grasses were found in sown pastures, while in semi-natural pastures, there were 41 forbs and 17 grasses (for further details see Borges 1997, 1999).
In the suction samples, totals of 4408, 24394 and 24489 individual arthropods were identified and sorted into 51 species of forb-feeders, 21 grass-feeders and 29 web-building spiders respectively (see Appendix 1).
The values of the response and explanatory variables used as y-variables in nested analyses of variance and as y and x-variables in multiple regressions are given in Appendix 2.
Only three variables showed a sampling date effect, namely V-ht (F3,8= 4.45, pB0.05), PEF-ht (F3,8=
5.21, pB0.05) and PEG-ht (F3,8= 5.14, pB0.05).
There was no significant effect of island (nested within sampling event) or habitat (nested within island). This is a consequence of seasonal and between-year differ-ences in the height of the sward due to climatic factors. In most sites, vegetation height peaked in the summer. The results did show a significant island effect for several variables. Vegetation diversity (W-a) was slightly higher in S. Maria and lower in Terceira on all sampling occasions (F8,12= 2.83, 0.05BpB0.1), while
the abundance of web-building spiders (F8,12= 4.13,
pB0.05) tended to be higher in Pico (spring and sum-mer 1994) or Terceira (autumn 1994, sumsum-mer 1995) and lower in S. Maria.
In two variables, there were both island and habitat effects: PEFca (F8,12= 3.14, pB0.05; F12,24= 2.66, pB
0.05 respectively) and the abundance of forb-feeding insects (F8,12= 5.07, pB0.01; F12,24= 2.16, 0.05BpB
0.1). The result obtained with PEFca was because of a generally higher cover of forbs in the semi-natural pastures in S. Maria than Pico or Terceira. The abun-dance of forb-feeding insects was mainly higher in S. Maria than in the other two islands, but there were no consistent patterns between habitats.
The three remaining variables showed only a signifi-cant habitat effect. The species richness (alpha diver-sity) was consistently higher in the semi-natural
pastures than in the sown pastures, but particularly so in S. Maria and Terceira (F12,24= 3.18, pB0.01). Yet,
overall (gamma diversity) more plant species were listed in the sown pastures than in the semi-natural pastures. The PEGca (F12,24= 4.86, pB0.001) and the
abun-dance of grass-feeding insects (F12,24= 5.27, pB0.001)
also showed a highly significant habitat effect. The abundance of grass-feeding insects was higher in the semi-natural pastures from S. Maria and Pico and in the sown pastures from Terceira, and the cover abun-dance of grasses tended to be higher in the semi-natural pastures of the three islands, with the greatest differ-ences occurring in Terceira.
Forb-feeding insects
The forb-feeding insects found in the two habitats (see Appendix 1) varied in species abundance. They were dominated by legume-feeders, the aphids Acyrtosiphon pisum (Harris) (geomean abundance of 1.35 m2in sown
pastures and 1.10 m2 in semi-natural pastures) and Therioaphis trifolii (Monell) (sown = 0.85 m2,
semi-nat-ural = 0.34 m2) and adults of the curculionid Sitona fla6escens (Marshall) (sown=0.37 m2, semi-natural =
0.11 m2), resulting from the high cover abundance of Lotus uliginosus Schkuhr and Trifolium repens L. in most sites. Also common were the, aphids Thecabius affinis (Kaltenbach) (semi-natural = 0.75 m2) and Aphis cracci6ora Koch (sown=0.34 m2), and the caterpillars, Cyclophora puppillaria granti Prout (semi-natural = 0.44 m2) and Agrotis segetum (Denis and Schiffermuller)
(semi-natural = 0.38 m2) (see Appendix 1).
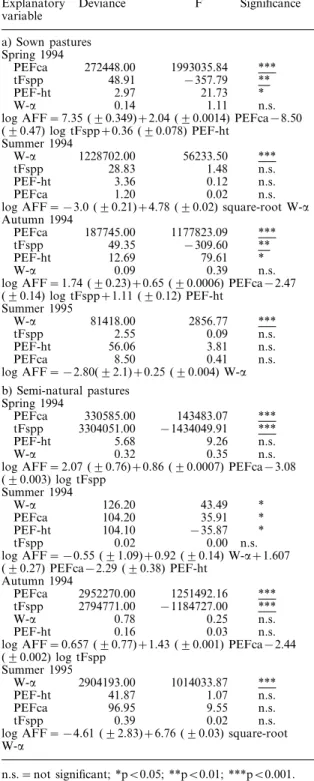
The abundance of forb-feeding insects (AFF) in sown pastures was significantly positively correlated with the cover of perennial forbs (PEFca) in spring and autumn 1994, and with the diversity of the total vegetation (W-a) in the summers of 1994 and 1995 (Table 1a). Significant negative correlations were obtained with total forb species (tFspp) in the spring and autumn 1994 (Table 1a).
Likewise, the abundance of forb-feeding insects (AFF) in semi-natural pastures was significantly posi-tively correlated with PEFca in spring and autumn 1994, and with W-a in summer 1995 (Table 1b). Signifi-cant negative correlations were obtained with tFspp in spring and autumn 1994 (Table 1b).
Grass-feeding insects
The grass-feeding insect species (see Appendix 1) in-clude grass foliage-chewing insects (Orthoptera, Lepi-doptera), grass root-chewing insects (Lepidoptera – Noctuidae and Coleoptera – Curculionidae) and leaf and root sap-feeders (Heteroptera – Miridae; Ho-moptera, Auchenorrhyncha – Cicadellidae and
Del-Table 1. Abundance of forb-feeding insects in sown (a) and semi-natural (b) pastures; analysis of deviance (ANODEV) table for multiple regression with step-wise omission of non-significant terms, beginning from the maximal model. For
each analysis the minimal adequate model (parameters91
SE) is shown. PEFca = perennial forb cover abundance; PEF-ht = weigPEF-hted mean heigPEF-ht of the perennial forbs;
W-a=To-tal vegetation William’sa diversity; tFspp=total forb species.
Explanatory Deviance F Significance
variable a) Sown pastures Spring 1994 PEFca 272448.00 1993035.84 *** tFspp 48.91 −357.79 ** PEF-ht 2.97 21.73 * W-a 0.14 1.11 n.s.
log AFF = 7.35 (90.349)+2.04 (90.0014) PEFca−8.50
(90.47) log tFspp+0.36 (90.078) PEF-ht Summer 1994 W-a 1228702.00 56233.50 *** tFspp 28.83 1.48 n.s. PEF-ht 3.36 0.12 n.s. PEFca 1.20 0.02 n.s.
log AFF = −3.0 (90.21)+4.78 (90.02) square-root W-a
Autumn 1994
PEFca 187745.00 1177823.09 ***
tFspp 49.35 −309.60 **
PEF-ht 12.69 79.61 *
W-a 0.09 0.39 n.s.
log AFF = 1.74 (90.23)+0.65 (90.0006) PEFca−2.47
(90.14) log tFspp+1.11 (90.12) PEF-ht Summer 1995 W-a 81418.00 2856.77 *** tFspp 2.55 0.09 n.s. PEF-ht 56.06 3.81 n.s. PEFca 8.50 0.41 n.s.
log AFF = −2.80(92.1)+0.25 (90.004) W-a
b) Semi-natural pastures Spring 1994 PEFca 330585.00 143483.07 *** tFspp 3304051.00 −1434049.91 *** PEF-ht 5.68 9.26 n.s. W-a 0.32 0.35 n.s.
log AFF = 2.07 (90.76)+0.86 (90.0007) PEFca−3.08
(90.003) log tFspp Summer 1994 W-a 126.20 43.49 * PEFca 104.20 35.91 * PEF-ht 104.10 −35.87 * tFspp 0.02 0.00 n.s.
log AFF = −0.55 (91.09)+0.92 (90.14) W-a+1.607
(90.27) PEFca−2.29 (90.38) PEF-ht Autumn 1994 PEFca 2952270.00 1251492.16 *** tFspp 2794771.00 −1184727.00 *** W-a 0.78 0.25 n.s. PEF-ht 0.16 0.03 n.s.
log AFF = 0.657 (90.77)+1.43 (90.001) PEFca−2.44
(90.002) log tFspp Summer 1995 W-a 2904193.00 1014033.87 *** PEF-ht 41.87 1.07 n.s. PEFca 96.95 9.55 n.s. tFspp 0.39 0.02 n.s.
log AFF = −4.61 (92.83)+6.76 (90.03) square-root
W-a
n.s. = not significant; *pB0.05; **pB0.01; ***pB0.001. Note: Probabilities underlined are significant after Bonferroni
adjustment (a%=0.0031).
phacidae; Homoptera, Sternorrhyncha – Aphididae; Thysanoptera). The most abundant (geomean abun-dance) species found in the twelve sites were the com-mon yellow pasture thrip, Aptinothrips rufus (Haliday) (sown = 8.62 m2, semi-natural = 9.15 m2), two
grass-land leafhopper species, Anoscopus albifrons (Linnaeus) (sown = 1.04 m2, semi-natural = 5.01 m2) and Euscelid-ius6ariegatus (Kirschbaum) (sown=5.92 m2,
semi-nat-ural = 1.39 m2), the delphacid planthopper Muellerianella sp. a (sown = 1.20 m2, semi-natural =
2.16 m2) and larvae of the armyworm (Mythimna unipuncta (Haworth) (sown = 0.72 m2, semi-natural =
0.79 m2) (see Appendix 1).
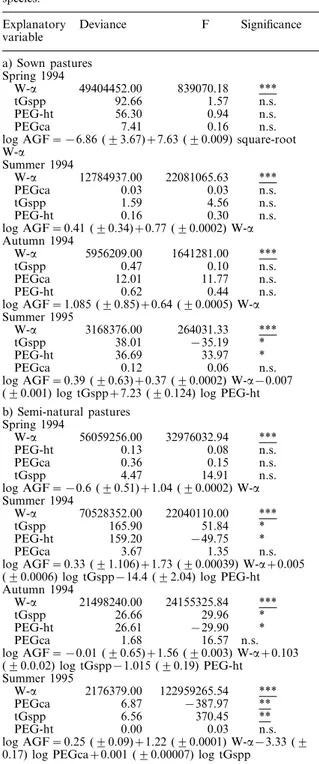
The abundance of grass-feeding insects (AGF) in sown and semi-natural pastures was consistantly and significantly positively correlated with the diversity of the whole vegetation (W-a) on all the sampling occa-sions (Table 2a). The abundance of grass-feeding in-sects (AGF) in semi-natural pastures was significantly positively correlated with W-a on all the sampling occasions, and with the total grass species richness (tGspp) in the summer of 1995 (Table 2b). A significant negative correlation was obtained with the cover abun-dance of grasses (PEGca) in the summer 1995 (Table 2b).
Web-building spiders
The most abundant (geomean abundance) species were mainly linyphiids (see Appendix 1): Lepthyphantes tenuis (sown = 0.94 m2, semi-natural = 1.19 m2), Erigone atra (sown = 0.58 m2, semi-natural = 1.35 m2), Oedothorax fuscus (sown = 0.91 m2, semi-natural = 1.18
m2), Erigone autumnalis (sown = 0.79 m2,
semi-natu-ral = 0.64 m2), Erigone dentipalpis (sown = 0.38 m2,
semi-natural = 0.44 m2), but also the Theridiidae Achaearanea acoreensis (sown = 0.30 m2,
semi-natu-ral = 0.44 m2). All these species are well adapted
pas-ture-dwelling spiders, while E. atra, E. dentipalpis and O. fuscus normally occur in heavily grazed pastures (De Keer and Maelfait 1987, 1988).
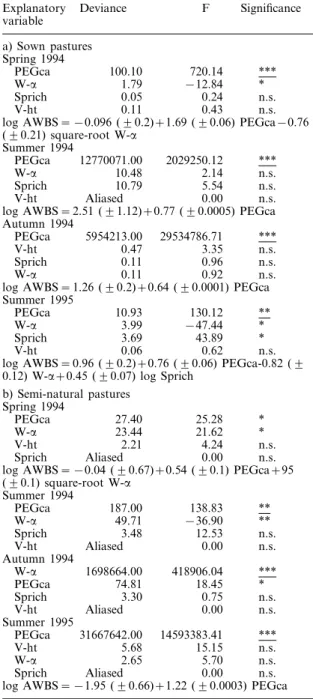
The abundance of web-building spiders (AWBS) was significantly positively correlated with the cover abun-dance of grasses (PEGca) on all the sampling occasions in sown pastures and in the summers of 1994 and 1995 in semi-natural pastures (Table 3a and b).
The abundance of web-building spiders was also significantly positively correlated with the total vegeta-tion diversity (W-a) in the semi-natural pastures in the autumn 1994 (Table 3b).
Discussion
The aim of this paper was to demonstrate relationships between various attributes of the vegetation and
abun-Table 2. Abundance of grass-feeding insects in sown (a) and semi-natural (b) pastures; analysis of deviance (ANODEV) table for multiple regression with step-wise omission of non-significant terms, beginning from the maximal model. For
each analysis the minimal adequate model (parameters91
SE) is shown. PEGca = perennial grass cover abundance; PEG-ht = weighted mean height of the perennial grasses; W-a=total vegetation William’s a diversity; tGspp=total grass species.
F
Explanatory Deviance Significance
variable a) Sown pastures Spring 1994 W-a 49404452.00 839070.18 *** tGspp 92.66 1.57 n.s. PEG-ht 56.30 0.94 n.s. n.s. PEGca 7.41 0.16
log AGF = −6.86 (93.67)+7.63 (90.009) square-root
W-a Summer 1994 W-a 12784937.00 22081065.63 *** PEGca 0.03 0.03 n.s. tGspp 1.59 4.56 n.s. PEG-ht 0.16 0.30 n.s.
log AGF = 0.41 (90.34)+0.77 (90.0002) W-a Autumn 1994
W-a 5956209.00 1641281.00 ***
tGspp 0.47 0.10 n.s.
PEGca 12.01 11.77 n.s.
PEG-ht 0.62 0.44 n.s.
log AGF = 1.085 (90.85)+0.64 (90.0005) W-a Summer 1995
W-a 3168376.00 264031.33 ***
tGspp 38.01 −35.19 *
PEG-ht 36.69 33.97 *
PEGca 0.12 0.06 n.s.
log AGF = 0.39 (90.63)+0.37 (90.0002) W-a−0.007
(90.001) log tGspp+7.23 (90.124) log PEG-ht
b) Semi-natural pastures Spring 1994 *** W-a 56059256.00 32976032.94 PEG-ht 0.13 0.08 n.s. PEGca 0.36 0.15 n.s. tGspp 4.47 14.91 n.s.
log AGF = −0.6 (90.51)+1.04 (90.0002) W-a Summer 1994
W-a 70528352.00 22040110.00 ***
tGspp 165.90 51.84 *
PEG-ht 159.20 −49.75 *
PEGca 3.67 1.35 n.s.
log AGF = 0.33 (91.106)+1.73 (90.00039) W-a+0.005
(90.0006) log tGspp−14.4 (92.04) log PEG-ht
Autumn 1994
W-a 21498240.00 24155325.84 ***
tGspp 26.66 29.96 *
PEG-ht 26.61 −29.90 *
PEGca 1.68 16.57 n.s.
log AGF = −0.01 (90.65)+1.56 (90.003) W-a+0.103
(90.0.02) log tGspp−1.015 (90.19) PEG-ht Summer 1995 *** W-a 2176379.00 122959265.54 PEGca 6.87 −387.97 ** tGspp 6.56 370.45 ** PEG-ht 0.00 0.03 n.s.
log AGF = 0.25 (90.09)+1.22 (90.0001) W-a−3.33 (9
0.17) log PEGca+0.001 (90.00007) log tGspp
n.s. = not significant; *pB0.05; **pB0.01; ***pB0.001. Note: Probabilities underlined are significant after Bonferroni
adjustment (a%=0.0031).
dance of invertebrate groups common in pastures, in three Azorean islands. Such relations may signal vege-tation predictors of invertebrate densities. Three vegeta-tion indices, single or in combinavegeta-tion (total vegetavegeta-tion William’s alpha diversity, ‘‘W-a’’; perennial forb cover abundance, ‘‘PEFca’’; perennial grass cover abundance, ‘‘PEGca’’) were found to predict arthropod abundances of specific groups (Tables 1 – 3; see also Fig. 1).
Although the total density of forb-feeders and web-building spiders differed between islands, a habitat effect was obtained for forb- and grass-feeding insect densities. The density of forb-feeders tracked the cover abundance of perennial forbs, with both variables hav-ing significant island and habitat effects. The same occurred with the grass-feeders and the cover abun-dance of perennial grasses, which displayed a habitat effect. Similarly, the diversity of grasses and grass-feed-ers were related to island and habitat.
However, the cover abundance of perennial grasses and their height index were not good predictors of the abundance of grass-feeders in either habitats. Here, alpha-diversity of the vegetation as a whole was the main predictor of the grass-feeding insect abundance. Taking into account that the reduction in structural complexity of the vegetation by grazing or cutting is known to have an effect on the densities of grass-feed-ers (Morris 1973, Gibson et al. 1992b), these results are difficult to interpret and probably reflect the poor pre-dictive value of the height index in these pasture sys-tems. This is, perhaps, not surprising since the Azorean pastures are grazed more frequently than those studied by these authors in the U.K. More regular grazing may cause further disruption to the relationship, and pre-vent the insects from tracking the vegetation so closely. Grasses are architecturally not as complex as forbs (Lawton and Schroeder 1977, Tscharntke and Greiler 1995), but still host a variety of insect species. Indeed, grass-feeding species were the most abundant herbi-vores in the field sites (e.g. Anoscopus albifrons, Eu-scelidius 6ariegatus, Muellerianella sp. a, Aptinothrips rufus). The reason that the abundance of grasses (PEGca) was not a good predictor of grass-feeder den-sity may indicate that few species are specific to individ-ual grass species (Brown et al. 1992).
Similarly plant-insect abundance patterns were found in the spring and autumn 1994 and in the summers 1994 and 1995 for forb-feeding insects in sown pastures. Vegetation diversity seemed to be a good predictor of the density of forb-feeders in the summers 1994 and 1995, in both sown and semi-natural pastures. More-over, there is a paucity of forb-feeding species in Pico, despite the availability of forb species (see also Borges and Brown 1999). For the forb-feeding insects, both the cover abundance of forbs and the alpha-diversity of the vegetation were good predictors of forb-feeding insect density.
For the web-building spiders, there was a consistently strong association between the abundance of this predatory assemblage and the cover abundance of
Fig. 1. Scatter plots of the relationships between: a) log abun-dance of forb-feeding insects and the perennial forb cover abundance in the semi-natural pastures (spring 1994); b) log abundance of grass-feeding insects and total vegetation
William’s a diversity in the semi-natural pastures (summer
1994); c) log abundance of web-building spiders and the perennial grass cover abundance in the sown pastures (summer 1994).
Table 3. Abundance of web-building spiders in sown (a) and semi-natural (b) pastures; analysis of deviance (ANODEV) table for multiple regression with step-wise omission of non-significant terms, beginning from the maximal model. For
each analysis the minimal adequate model (parameters91
SE) is shown. PEGca = perennial grass cover abundance; V-ht = weighted mean height of the total vegetation; W-a=
total vegetation William’sa diversity; Sprich=the mean
num-ber of vascular plant species touching the point-quadrat pins.
Deviance F Explanatory Significance variable a) Sown pastures Spring 1994 *** 720.14 100.10 PEGca −12.84 1.79 * W-a 0.24 n.s. Sprich 0.05 V-ht 0.11 0.43 n.s.
log AWBS = −0.096 (90.2)+1.69 (90.06) PEGca−0.76
(90.21) square-root W-a Summer 1994 *** 2029250.12 12770071.00 PEGca 10.48 W-a 2.14 n.s. 5.54 n.s. Sprich 10.79 Aliased V-ht 0.00 n.s.
log AWBS = 2.51 (91.12)+0.77 (90.0005) PEGca
Autumn 1994 PEGca 5954213.00 29534786.71 *** V-ht 0.47 3.35 n.s. 0.11 Sprich 0.96 n.s. 0.92 n.s. W-a 0.11
log AWBS = 1.26 (90.2)+0.64 (90.0001) PEGca
Summer 1995 ** 130.12 10.93 PEGca −47.44 * W-a 3.99 Sprich 3.69 43.89 * 0.62 0.06 n.s. V-ht
log AWBS = 0.96 (90.2)+0.76 (90.06) PEGca-0.82 (9
0.12) W-a+0.45 (90.07) log Sprich
b) Semi-natural pastures Spring 1994 27.40 * PEGca 25.28 W-a 23.44 21.62 * V-ht 2.21 4.24 n.s. Aliased n.s. Sprich 0.00
log AWBS = −0.04 (90.67)+0.54 (90.1) PEGca+95
(90.1) square-root W-a Summer 1994 PEGca 187.00 138.83 ** W-a 49.71 −36.90 ** n.s. 12.53 3.48 Sprich Aliased 0.00 n.s. V-ht Autumn 1994 W-a 1698664.00 418906.04 *** PEGca 74.81 18.45 * 0.75 3.30 n.s. Sprich 0.00 V-ht Aliased n.s. Summer 1995 *** 14593383.41 31667642.00 PEGca 5.68 V-ht 15.15 n.s. W-a 2.65 5.70 n.s. Sprich Aliased 0.00 n.s.
log AWBS = −1.95 (90.66)+1.22 (90.0003) PEGca
n.s. = not significant; *pB0.05; **pB0.01; ***pB0.001.
Note: Probabilities underlined are significant after Bonferroni
adjustment (a%=0.0031).
perennial grasses. Several inter-related mechanisms may be involved in causing more web-building spiders to occur in dense and structurally diverse grass swards. These include living space, for web attachment, shelter and prey, which will be greater in structurally complex habitats.
Such relationships have obvious implications in terms of pasture management. Spiders are well known biolog-ical control agents in agroecosystems, needing a com-plex sward architecture (Uetz 1991, Gibson et al. 1992a, Curry 1994, Wise 1995). Grazing reduces sward
struc-tural complexity and also spider numbers (Gibson et al. 1992a, Curry 1994). In the present study, the density of spiders was determined three to four weeks after a grazing event, following some regrowth of the vegeta-tion. As the spider density was related to the abundance of perennial grasses, this implies that management fa-vouring a diverse and complex perennial grass sward also favours the assemblage of web-building spiders and consequently the biological control of potentially damaging phytophagous insects.
Other studies (see Brown and Gange 1989, Brown 1991a, b) have considered the weighted mean height index (Height) to be a reliable measure of habitat structure. In the present work, however, this index (e.g. V-ht, PEF-ht and PEG-ht) was seldom a good predic-tor of the density of the three assemblages studied. Moreover, these measures of vegetation height showed a significant sampling event effect, but no island or habitat effects. Such a result implies that, for the two habitats under study, these indices are strongly depen-dent on the seasonal vegetation growth and are of less value as predictors of arthropod density. Another fea-ture, peculiar to the Azores, is that vegetation grows very quickly. As such, there would be much temporal variability in the index, which would reduce its value as a predictor.
In summary, the various effects of pasture manage-ment may have profound effects on local arthropod assemblages. Important predator assemblages, such as the web-building spiders, seem to respond positively to a well developed and complex grass sward. However, grass-feeding insects also increase in diverse vegetation, creating a trade-off between having a diverse grass sward for web spider attachment and a less diverse grass sward to decrease the diversity and density of grass-feeding insects. The positive relationship between forb cover abundance and the abundance of forb-feed-ers implies that good pasture management, which avoids invasion by weedy forb species, is one way of decreasing herbivory by generalist feeders on legume species which are usually of great importance for cattle. Acknowledgements – We are grateful to J. Lawton (Centre for Population Biology, Imperial College, Univ. of London) for reviewing earlier drafts. Special thanks to G. Masters (CABI-Bioscience, Silwood Park, U.K.) for his help in adapting the computer software necessary for the analysis of the point-quadrat data. E. Dias (DCA-UA), B. Oliveira (Dept de Biolo-gia, UA), R. Gabriel (DCA-UA) and A. Morton (Dept of Biology, Imperial College, Univ. of London) helped with the identification of several vascular plant species. The arthropod morphospecies were identified by several taxonomists who also gave valuable advice on the feeding habits and colonization status of each species: Heteroptera (J. Ribes, Barcelona,
Spain), Homoptera-Auchenorrhyncha (J. Hollier, Glebe,
U.K.; J. A. Quartau, ‘‘Faculdade de Cieˆncias de Lisboa’’, Portugal), Aphididae (F. Ilharco, ‘‘Estac¸a˜o Agrono´mica
Na-cional’’, Portugal), Thysanoptera (R. zur Strassen,
‘‘Forschungsinstitut und Naturmuseum Senckenberg’’, Frank-furt, Germany), Lepidoptera (V. Vieira, ‘‘Dept Biologia da Univ. dos Ac¸ores’’, Portugal), Chrysomelidae (D. Erber,
Giessen-Lahn, Germany), Curculionidae (R. Booth, Interna-tional Institute of Entomology, London, U.K.) and Araneae (J. Wunderlich, Straubenhardt, Germany). To all them our sincere thanks. This research was funded by JNICT (‘‘Junta Nacional de Investigac¸a˜o Cientı´fica e Tecnolo´gica’’, Lisboa, Portugal) (Science Program-Ph.D. Grant BD-2706-93-RN) and the Azorean Agriculture Services (Secretaria Regional da Agricultura e Pescas).
References
Andow, D. A. 1991. Vegetational diversity and arthropod population response. – Annu. Rev. Ecol. Syst. 22: 561 – 586.
Bach, C. E. 1980. Effects of plant diversity and time of colonization on an herbivore-plant interaction. – Oecolo-gia 44: 319 – 326.
Borges, P. A. V. 1990. A checklist of Coleoptera from the Azores with some systematic and biogeographic comments. – Bol. Mus. Mun. Funchal 42: 87 – 136.
Borges, P. A. V. 1997. Pasture arthropod community structure in Azorean islands of different geological age. – Ph.D. thesis, Imperial College, Univ. of London.
Borges, P. A. V. 1999. Plant and arthropod species composi-tion of sown and semi-natural pasture communities of three Azorean islands (S. Maria, Terceira and Pico). – Arquipe´lago 17A: 1 – 21.
Borges, P. A. V. and Brown, V. K. 1999. Effect of island geological age on the arthropod species richness of Azorean pastures. – Biol. J. Linn. Soc. 66: 373 – 410. Brown, V. K. 1991a. The importance of habitat structure in
the maintenance of insect species diversity. – In: Pineda, F. D. et al. (eds), Biological diversity. Fundacio´n Ramo´n Areces, Madrid, pp. 49 – 55.
Brown, V. K. 1991b. The effects of changes in habitat struc-ture during succession in terrestrial communities. – In: Bell, S. S., McCoy, E. D. and Mushinsky H. R. (eds), Habitat structure: the physical arrangement of objects in space. Chapman and Hall, pp. 141 – 168.
Brown, V. K. and Southwood, T. R. E. 1987. Secondary succession: patterns and strategies. – In: Gray, A. J., Crawley, M. J. and Edward, P. J. (eds), Colonization, succession and stability. Blackwell, pp. 315 – 337. Brown, V. K. and Gange, A. C. 1989. Insect herbivory during
early plant succession. – Oikos 54: 67 – 76.
Brown, V. K. and Gange, A. C. 1992. Secondary plant succes-sion: how is it modified by insect herbivory? – Vegetatio 101: 3 – 13.
Brown, V. K., Jepsen, M. and Gibson, C. W. D. 1988. Insect herbivory: effects on early old field succession demon-strated by chemical exclusion methods. – Oikos 52: 293 – 302.
Brown, V. K., Gibson, C. W. D. and Sterling, P. H. 1990. The mechanisms controlling insect diversity in calcareous grass-lands. – In: Hillier, S. H., Walton, D. W. H. and Wells, D. A. (eds), Calcareous grasslands-ecology and management. Bluntisham Books, Huntingdon, pp. 79 – 87.
Brown, V. K., Gibson, C. W. D. and Kathirithamby, J. 1992. Community organization in leaf hoppers. – Oikos 65: 97 – 106.
Crawley, M. J. 1990. The relative importance of vertebrate and invertebrate herbivores in plant population dynamics. – In: Bernays E. A. (ed.), Insect plant interactions. CRC Press, Boca Raton, Florida, pp. 45 – 70.
Crawley, M. J. 1993. GLIM for Ecologists. – Blackwell. Curry, J. P. 1994. Grassland invertebrates – ecology, influence
on soil fertility and effects on plant growth. – Chapman and Hall.
De Keer, R. and Maelfait, J.-P. 1987. Life history of Oedotho-rax fuscus Blackwall, 1834. Araneae, Linyphiidae in a
heavily grazed pasture. – Rev. D’E´ col. Biol. Sol 24: 171–
De Keer, R. and Maelfait, J.-P. 1988. Observations on the life cycle of Erigone atra Araneae, Erigoninae in a heavily grazed pasture. – Pedobiologia 32: 201 – 212.
Dennis, P., Young, M. R. and Gordon, I. J. 1998. Distribution and abundance of small insects and arachnids in relation to structural heterogeneity of grazed, indigenous grasslands. – Ecol. Entomol. 23: 253 – 264.
Denno, R. F. and Roderick, G. F. 1991. Influence of patch size, vegetation structure and host plant architecture on the diversity, abundance and life history styles of sap-feeding herbivores. – In: Bell, S. S., McCoy, E. D. and Mushinsky H. R. (eds), Habitat structure: the physical arrangement of objects in space. Chapman and Hall, pp. 169 – 196.
Gange, A. C. and Brown, V. K. 1989. Insect herbivory affects size variability in plant populations. – Oikos 56: 351 – 356. Gardner, S. M. et al. 1995. The influence of habitat structure on arthropod diversity in Argentine semi-arid Chaco forest. – J. Veg. Sci. 6: 349 – 356.
Gibson, C. W. D. et al. 1987. Spring grazing by sheep: effects on seasonal change during early old field succession. – Vegetatio 70: 33 – 43.
Gibson, C. W. D., Hambler, C. and Brown, V. K. 1992a. Changes in spider Araneae assemblages in relation to succession and grazing management. – J. Appl. Ecol. 29: 133 – 142.
Gibson, C. W. D. et al. 1992b. The response of invertebrate assemblies to grazing. – Ecography 15: 166 – 176. Good, J. A. and Giller, P. S. 1991. The effect of cereal and
grass management on staphylinid Coleoptera assemblages in south-west Ireland. – J. Appl. Ecol. 28: 810 – 826. Haysom, K. A. and Coulson, J. C. 1998. The Lepidoptera
fauna associated with Calluna 6ulgaris: effects of plant
architecture on abundance and diversity. – Ecol. Entomol. 23: 377 – 385.
Henderson, I. E. F. 1978. Assessing the effects of invertebrates on grassland productivity. – Sci. Proc. of the Roy. Dublin Soc., Ser. A 6: 121 – 130.
Huntly, N. 1991. Herbivores and the dynamics of communities and ecosystems. – Annu. Rev. Ecol. Syst. 22: 477 – 503. Lawton, J. H. 1983. Plant architecture and the diversity of
phytophagous insects. – Annu. Rev. Entomol. 28: 23 – 39. Lawton, J. H. and Schroeder, D. 1977. The effects of plant type, size of geographical range and taxonomic isolation on number of insect species associated with British plants. – Nature 265: 137 – 140.
Lawton, J. H. and Strong, D. R. 1981. Community patterns and competition in folivorous insects. – Am. Nat. 18: 317 – 338.
Morris, M. G. 1973. The effects of seasonal grazing on the Heteroptera and Auchenorhyncha Hemiptera of chalk grassland. – J. Appl. Ecol. 10: 761 – 780.
Morris, M. G. 1990a. The Hemiptera of two sown calcareous grasslands. I. Colonization and early succession. – J. Appl. Ecol. 27: 367 – 378.
Morris, M. G. 1990b. The Hemiptera of two sown calcareous grasslands. II. Differences between treatments. – J. Appl. Ecol. 27: 379 – 393.
Morris, M. G. 1990c. The Hemiptera of two sown calcareous grasslands. III. Comparisons with the Auchenorhyncha faunas of other grasslands. – J. Appl. Ecol. 27: 394 – 409. Roberts, M. J. 1995. Collins field guide – spiders of Britain
and northern Europe. – Harper Collins Publishers,
London.
Root, R. B. 1973. Organization of a plant-arthropod associa-tion in simple and diverse habitats: the fauna of collards Brassica oleracea. – Ecol. Monogr. 43: 95 – 124.
Rushton, S. P., Luff, M. L. and Eyre, M. D. 1989. Effects of pasture improvement and management on the ground beetle and spider communities of upland grasslands. – J. Appl. Ecol. 26: 489 – 503.
Schluter, D. and Ricklefs, R. E. 1993. Species diversity – an introduction to the problem. – In: Ricklefs, R. E. and Schluter, D. (eds), Species diversity in ecological communi-ties. Historical and geographical perspectives. Univ. of Chicago Press, pp. 1 – 10.
Siemann, E. et al. 1998. Experimental tests of the dependence of Arthropod diversity on plant diversity. – Am. Nat. 152: 738 – 750.
Southwood, T .R. E. 1978. Ecological methods. 2nd ed. – Chapman and Hall.
Southwood, T. R. E., Brown, V. K. and Reader, P. M. 1979. The relationships of plant and insect diversities in succes-sion. – Biol. J. Linn. Soc. 12: 205 – 216.
Stilling, P. 1988. Density-dependent processes and key factors in insect populations. – J. Anim. Ecol. 57: 581 – 593. Stinson, C. S. A. and Brown, V. K. 1983. Seasonal changes in
the architecture of natural plant communities and its rele-vance to insect herbivores. – Oecologia 56: 67 – 69. Strong, D. R., Lawton, J. H. and Southwood, T. R. E. 1984.
Insects on plants. Community patterns and mechanisms. – Blackwell.
Tscharntke, T. and Greiler, H.-J. 1995. Insect communities, grasses and grasslands. – Annu. Rev. Entomol. 40: 535 – 558.
Uetz, G. W. 1991. Habitat structure and spider foraging. – In: Bell, S. S., McCoy, E. D. and Mushinsky H. R. (eds), Habitat structure: the physical arrangement of objects in space. Chapman and Hall, pp. 325 – 348.
Usher, M. B. 1978. The structure of, and processes in, grass-land animal communities: an introduction. – Sci. Proc. Roy. Dublin Soc., Ser. A 6: 121 – 130.
Vieira, V. and Pintureau, B. 1993. Diversite´ compare´e des Le´pidote`res (Insecta) dans les ıˆles des Ac¸ores: revision avec de nouvelles donne´es. – Arquipe´lago 11A: 107 – 112. Wise, D. H. 1995. Spiders in ecological webs. – Cambridge
Univ. Press.
Wunderlich, J. 1991. The spider fauna of the Macaronesian islands – taxonomy, ecology, biogeography and evolution. – Beitr. Araneolog. 1: 1 – 619.
Appendix 1 : G eometric mean abundance (based on four samples per site) of 97 arthropod species (68 herbivorous insects and 2 9 p redatory spiders) colle cted by means o f suction (Vortis) in six sites of sown a nd six sites of semi-natural pasture in three Azorean islands (S. Maria, Terceira and P ico). Nomenclature follows: Hete roptera (Ribes pers. comm.); Homoptera-Auchenorrhyncha (Quartau pers. comm.); Aphididae (Ilharco pers. comm.); Thysanoptera (zur Strassen pers. comm.); Lepidoptera (Vieir a and Pintureau 1993); Coleoptera (Borges 1990); Araneae (Wunderlich 1991). ?? = identification need confirmation. Feeding group (F.G.) categories as follows: FF = forb-feeder; GF = grass-feeder; GFF = grass and forb-feeder; WB = web-building spiders. Colonization status (C.S.) categories as follows: E = endemic; I= introduced; N = native. Species F.G. C.S. S. Maria Terceira Pico Sown Semi-natural Sown S emi-natural Sown Semi-natural Site 1 S ite 2 Site 3 Site 4 Site 5 Site 6 S ite 7 Site 8 S ite 9 S ite 10 Site 11 Site 12 Heteroptera Miridae Pithanus maerkeli (Herrich-Schaeffer) GF N 0.19 0.42 0.06 0.09 0.09 0.32 Trigonotylus caelestialium (Kirkaldy) GF 0.09 0.26 0.06 0.09 0.10 Lygaeidae Beosus maritimus (Scopoli) FF 0.06 Gen. sp. a FF 0.06 Plinthisus bre 6ipennis (Latreille) FF N 0.06 0.11 Plinthisus (Isioscytus ) minutissimus Fieloer FF 0.06 Scolopostethus decoratus (Hahn) FF 0.09 0.31 0.16 0.24 0.06 0.38 0.06 Rhopalidae Liorhyssus hyalinus (Fabricius) FF I 0.06 Pentatomidae Nezara 6iridula (Linnaeus) FF I 0.06 0.06 Homoptera Cicadellidae Anoscopus albifrons (Linnaeus) GF I? 0.44 1.20 3.39 4.55 1.45 2.02 5.93 8.99 0.51 1.62 5.45 3.50 Euscelidius 6ariegatus (Kirschbaum) GF I? 8.67 2.71 0.23 8.56 6.59 7.95 Macrosteles sexnotatus (Falle ´n ) G F N ? 0.34 1.81 0.31 1.19 0.25 0.09 0.39 0.06 Delphacidae Muellerianella sp. a GF N? 0.91 1.33 30.94 13.90 6.87 3.14 1.11 0.65 0.19 0.62 0.38 0.87 Aphididae Acyrthosiphon pisum (Harris) FF N 2.03 0.75 3.40 1.56 0.85 1.04 0.64 1.18 3.20 1.40 0.97 0.45 Anoecia corni (Fabricius) GF I 0.31 0.25 0.19 0.06 0.06 0.06 0.06 0.06 Aphis cracci 6ora Koch F F N 0.38 0.38 0.06 0.31 0.19 Aphis gossypii Glover FF N 0.23 Dysaphis (Pomaphis ) aucupariae (Buckton) FF I 0.14 0.09 0.09 0.06 0.06 0.06 0.06 Myzus cymbalariae Stroyan FF I 0.06 Nasono 6ia ribisnigri (Mosley) FF I 0.24 0.24 0.11 0.13 0.13 Rhopalosiphoninus tulipaellus (Theobald) FF I 0.06 Rhopalosiphum insertum (Walker) GF I 0.10 0.20 0.42 0.06 0.16 0.34 0.56 0.44 0.34 0.20 0.28 0.22 Rhopalosiphum padi (Linnaeus) GF I 0.06 Schizaphis graminum (Rondani) GF N 0.31 Thecabius affinis (Kaltenbach) FF I 0.75 Therioaphis trifolii (Monell) FF N 0.55 1.30 0.11 1.06 Thysanoptera Aeolothripidae Aeolothrips fasciatus (Linnaeus) FF I 0.56 0.72 0.19 0.31 0.09
Appendix 1 : (Continued) Species F.G. C.S. S. Maria Terceira Pico Sown Semi-natural Sown S emi-natural Sown Semi-natural Site 1 S ite 2 Site 3 Site 4 Site 5 Site 6 S ite 7 Site 8 S ite 9 S ite 10 Site 11 Site 12 Phlaeothripidae Haplothrips ? niger (Osborn) GF N 0.38 0.09 0.13 Haplothrips sp. a F F 0.13 Nesothrips propinquus (Bagnall) GF I 0.11 0.21 0.06 0.06 Thripidae Aptinothrips rufus (Haliday) GF N 7.20 12.05 10.97 12.59 13.74 10.78 14.04 6.44 5.43 5.87 8.98 5.24 Heliothrips haemorrhoidalis (Bouche ´) FF I 0.06 0.13 0.06 0.06 Hercinothrips bicinctus (Bagnall) FF I 0.06 Plesiothrips perplexus (Beach) G F I 0.06 0.06 Thrips atratus Haliday FF N Lepidoptera Coleophoridae ?? Coleophora 6ersurella Zeller FF N? 0.17 0.18 0.06 0.13 Gelechiidae Aproaerema anthyllidela (Hu ¨b ner) FF I? 0.06 0.06 0.13 Yponomeutidae Argyresthia atlanticella Rebel FF E 0.13 0.06 0.06 0.06 0.06 Choreutidae Tebenna bjerkandrella (Thunberg) FF I 0.18 0.15 Tortricidae Gen. sp. a FF 0.44 0.38 0.13 Pyralidae Gen. sp. a FF 0.18 0.19 1.26 0.68 0.19 0.31 0.34 0.46 0.69 2.00 0.19 0.23 Gen. sp. b FF 0.25 0.06 Scoparia sp. a F F E 0.06 0.06 0.31 0.13 0.08 0.12 0.09 0.06 0.19 Scoparia sp. b F F E 0.06 Pieridae Colias crocea (Geoffroy) FF N 0.06 0.09 0.25 Geometridae Cyclophora puppillaria granti Prout F F E 0.13 0.19 0.93 0.21 Orthomana obstipata (Fabricius) FF I? 0.06 Xanthorhoe ? inaequata (Warren) FF E 0.13 Noctuidae Agrotis ipsilon (Hufnagel) GFF I? 0.13 0.06 Agrotis segetum (Denis & Schiffermuller) GFF I? 0.38 Autographa gramma (Linnaeus) FF I? 0.14 0.09 0.16 0.09 0.08 0.13 0.13 0.06 0.19 Chrysodeixis chalcites (Esper) FF I 0.16 0.15 0.59 0.62 0.10 0.09 0.06 0.13 0.11 0.06 0.13 0.06 Mythimna unipuncta (Haworth) G F I? 0.46 0.73 3.21 1.06 2.14 0.85 0.38 0.31 0.51 0.46 0.72 0.84 Peridroma saucia (Hu ¨b ner) GF I? 0.06 Phlogophora meticulosa (Linnaeus) GFF I? 0.13 Spodoptera littoralis (Boisduval) FF I 0.06 Coleoptera Elateridae Heteroderes azoricus Tarnier FF E 0.09 0.11
Appendix 1 : (Continued) Species F.G. C.S. S. Maria Terceira Pico Sown Semi-natural Sown S emi-natural Sown Semi-natural Site 1 S ite 2 Site 3 Site 4 Site 5 Site 6 S ite 7 Site 8 S ite 9 S ite 10 Site 11 Site 12 Nitidulidae Meligethes planiusculus (Heer) FF N 0.06 Chrysomelidae Chaetocnema hortensis (Geoffrey) FF I 0.95 0.21 0.34 0.49 0.11 0.27 0.06 0.13 0.06 0.06 Chrysolina (Chrysomela ) banksi (Fabricius) FF N 0.06 0.06 0.13 Epithrix cucumeris Harris FF I 0.06 Longitarsus kutscherae paludi 6agus Peyerimhoff FF I 0.13 0.15 0.09 0.06 Psylliodes chrysocephala (Linnaeus) FF I 0.06 Curculionidae Gymnetron pascuorum (Gyllenhal) FF I 0.06 Otiorhynchus sulcatus (Fabricius) GF I 0.06 0.06 0.06 Sitona fla 6escens (Marshall) FF I 0.94 1.04 0.06 0.36 0.33 0.55 0.10 0.14 0.16 0.09 0.06 Sitona puberulus Reitter FF I 0.13 0.09 0.09 0.15 0.10 0.11 0.44 0.16 Tychius picirostris (Fabricius) FF I 0.09 0.09 Araneae Tetragnathidae Leucognatha acoreensis Wunderlich WB E 0.06 Araneidae Gen. sp. a WB 0.06 Gibbaranea occidentalis Wunderlich WB E 0.06 Mangora acalypha (Walckenaer) WB 0.13 0.19 0.06 Neoscona crucifera (Lucas) WB 0.06 0.06 Linyphiidae Linyphiinae Agyneta fuscipalpis (C. L . K och) WB 0.22 0.15 0.15 0.06 0.06 Agyneta decora (O. P ickard-Cambridge) WB 0.19 Lepthyphantes tenuis (Blackwall) WB 2.46 1.41 3.58 2.05 0.32 0.19 0.34 0.82 1.76 1.85 0.88 1.52 Lepthyphantes schmitzi kulczynski W B N 0.06 0.09 0.19 0.13 0.06 0.06 Erigoninae Eperigone bryantae Ivie & B arrows W B I 0.18 0.06 0.17 0.06 Eperigone fradeorum (Berland) W B I 0.22 0.14 0.36 0.50 0.18 0.13 0.06 0.06 Erigone atra (Blackwall) WB 0.17 0.17 1.87 1.12 1.87 2.00 0.69 2.29 Erigone autumnalis Emerton W B I 2.82 2.16 0.26 1.89 0.09 0.73 0.73 1.43 1.07 0.58 0.28 0.50 Erigone dentipalpis (Wider) WB 0.68 0.40 0.23 0.92 0.16 0.14 0.21 0.31 0.89 0.60 0.99 0.50 Erigone 6agans Savigny & Audouin WB 0.18 0.13 0.06 0.06 0.13 Minicia n.sp.? WB E 0.13 Minicia picoensis Wunderlich WB E 0.06 0.06 Oedothorax fuscus (Blackwall) WB I 0.06 7.65 7.66 2.88 4.59 0.19 0.13 Ostearius melanopygius (O. P ickard-Cambridge) WB 0.19 0.17 0.06 0.92 0.12 0.13 0.07 0.06 0.06 0.06 Pelecopsis parallela (Wider) WB 0.15 Theridiidae Achaearanea acoreensis (Berland) W B I 1.09 0.73 0.74 1.48 0.11 0.16 0.16 0.43 0.13 0.27 0.36 Argyrodes sp. a W B 0.06 Gen. sp. a WB 0.06
Appendix 1 : (Continued) Species F.G. C.S. S. Maria Terceira Pico Sown Semi-natural Sown S emi-natural Sown Semi-natural Site 1 S ite 2 Site 3 Site 4 Site 5 Site 6 S ite 7 Site 8 S ite 9 S ite 10 Site 11 Site 12 Gen. sp. b WB 0.06 Lasaeola oceanica Simon WB E 0.14 0.06 Rugathodes acoreensis Wunderlich WB E 0.06 Steatoda sp. a WB 0.06 Theridion musi 6i 6um Schmidt WB N 0.15 0.22 0.33 Dictynidae Lathys dentichelis (Simon) W B N 0.06
Appendix 2: List of the values of the response and explanatory variables used as y-variates in nested analyses of variance and as y a nd x-variates in sim ple and multiple regressions. Sprich = the mean number of vascular plant species touching the point-uadrat pins; tFspp = total forb species; tGspp = total grass species; W-a = total vegetation William’s a diversity; PEFca = perennial forb cover abundance; PEGca = perennial grass cover abundance; V-ht = weighted mean height o f the total vegetation; PEF-ht = weighted mean height of the p erennial forbs; PEG-ht = weighted mean height of the perennial grasses; AFF = abundance of insect forb-feeders; AGF = abundance of grass-feeders; AWBS = abundance of web-building spiders. S. Maria Terceira Pico Sown Semi-natural Sown Semi-natural Sown Semi-natural Indices Site 1 S ite 2 Site 3 S ite 4 S ite 5 S ite 6 Site 7 Site 8 Site 9 S ite 10 Site 11 Site 12 Spring 1994 Sprich 9.20 6.60 10.65 13.20 5.90 6.45 8.85 9.00 8.95 10.0 9.05 10.60 tFspp 1 5 8 13 17 6 7 11 11 8 9 12 11 TGspp 11 7 7 10 7 7 5 5 9 8 6 8 W-a 1.77 1.18 1.90 2.65 1.00 1.08 1.62 1.57 1.75 1.88 1.63 1.93 PEFca 2278 4138 6004 3058 688 1112 1672 2033 936 554 1434 2392 PEGca 4293 2498 4765 4098 6881 7702 6243 8204 5264 8149 7893 7392 V-ht 7.02 3.44 8.69 6.35 7.39 10.04 4.49 6.68 5.92 12.52 11.06 13.55 PEF-ht 6.45 3.11 7.83 6.12 8.27 12.74 3.55 5.70 4.32 7.51 8.12 16.66 PEG-ht 7.49 4.00 9.94 5.97 7.37 9.89 4.77 6.88 6.23 12.88 11.77 12.22 AFF 5.69 7.50 5.13 3.06 0.81 0.94 0.44 0.56 5.81 1.31 2.06 1.63 AGF 7.38 17.94 134.38 39.94 13.19 40.56 17.63 29.25 2.56 3.81 19.75 9.81 AWBS 22.38 13.69 12.81 19.25 11.75 14.06 18.25 28.63 26.25 49.50 14.38 46.19 Summer 1994 Sprich 9.70 7.20 11.25 12.60 7.30 6.05 10.15 9.80 9.15 11.60 9.55 10.00 tF sp p 2 81 81 52 41 11 21 7 1 7 1 31 41 8 1 3 tGspp 1 3 1 3 8 11 7 8 7 7 1 0 1 0 6 7 W-a 2.24 1.36 2.10 2.58 1.50 1.13 1.74 1.62 1.79 2.37 1.76 2.01 PEFca 2176 3166 5173 3622 859 1217 2990 3104 1331 780 1775 932 PEGca 1266 2502 3896 1891 3247 3920 9159 11343 5099 6211 6580 5205 V-ht 9.24 6.99 10.58 9.53 10.01 11.01 10.60 15.17 7.38 13.37 13.25 10.59 PEF-ht 7.81 5.82 9.36 8.79 9.28 10.59 9.40 13.00 6.81 9.82 10.84 8.43 PEG-ht 11.93 8.33 12.36 11.14 10.02 10.93 11.09 15.72 7.55 13.91 14.12 11.19 AFF 13.69 40.38 12.88 7.06 2.69 5.44 3.81 1.06 1.75 1.31 1.63 0.69 AGF 26.19 20.88 83.88 63.13 61.56 73.94 23.63 17.63 23.06 20.69 28.81 37.19 AWBS 18.38 12.81 19.13 21.69 28.19 48.13 59.25 61.19 45.25 54.06 53.38 48.00 Autumn 1994 Sprich 10.40 6.05 11.90 12.15 7.05 6.30 7.95 8.50 8.55 9.75 8.40 10.25 tFspp 3 3 1 8 1 6 2 2 9 12 18 17 14 14 20 17 tGspp 1 4 9 9 13 8 9 5 6 8 9 6 7 W-a 2.45 1.34 2.40 3.14 1.36 1.35 1.34 1.52 1.76 2.00 1.73 2.12 PEFca 1216 742 2647 1719 654 548 1546 1923 849 837 1053 1352 PEGca 2072 1840 4429 905 4247 2676 8826 6422 4158 4994 4121 4113 V-ht 7.96 4.30 6.28 3.65 7.28 4.36 8.63 9.59 4.46 7.28 6.73 7.17 PEF-ht 5.53 2.52 5.24 3.03 6.38 3.61 7.73 8.43 3.71 5.35 6.67 7.69 PEG-ht 8.68 4.89 7.00 4.09 7.44 4.69 8.74 10.01 4.67 7.59 6.82 6.93 AFF 19.44 1.69 8.94 6.94 3.06 3.75 12.75 19.31 2.50 6.25 1.44 0.81 AGF 22.00 15.75 57.56 42.69 51.44 24.63 35.06 15.19 6.50 14.94 29.06 28.31 AWBS 47.75 24.31 11.13 28.06 46.81 32.94 32.56 44.63 26.69 28.63 28.44 28.44
Appendix 2: (Continued) S. Maria Terceira Pico Sown Semi-natural Sown S emi-natural Sown Semi-natural Indices Site 1 Site 2 Site 3 Site 4 Site 5 Site 6 Site 7 Site 8 Site 9 S ite 10 Site 11 Site 12 Summer 1995 Sprich 12.30 8.00 10.70 15.10 7.45 5.75 8.05 8.85 9.80 11.15 8.40 10.40 tF sp p 2 92 01 82 11 01 31 6 1 6 1 41 52 2 1 4 tGspp 13 10 11 14 7 8 5 8 7 9 5 6 W-a 2.54 1.54 2.10 3.19 1.43 1.21 1.40 1.63 1.95 2.34 1.62 2.12 PEFca 2897 1412 2603 4387 745 316 1265 1869 1266 1431 1441 1864 PEGca 2818 4513 4546 2571 3924 1953 8157 6169 5204 4397 5063 3871 V-ht 10.48 11.98 9.19 13.64 10.93 6.20 7.41 8.69 7.59 9.61 9.88 9.23 PEF-ht 8.92 9.31 8.95 14.12 12.81 6.76 6.75 8.54 7.73 8.62 9.61 8.03 PEG-ht 10.98 13.22 9.36 13.27 9.80 5.25 7.51 8.74 7.64 9.98 10.09 9.88 AFF 6.81 5.50 9.00 17.13 1.63 1.81 2.88 2.88 8.25 2.88 1.50 1.06 AGF 38.81 42.50 44.81 35.88 31.13 14.19 30.88 26.38 28.44 18.19 36.06 17.88 AWBS 20.69 25.06 26.56 49.94 40.25 25.06 40.56 34.63 33.69 27.88 37.75 41.56