Determinants of Electoral Behavior: A Study Using
Individual-Level Data
Joana Garcia
Supervisor: Miguel Gouveia
f f f f f f ff f f f f ffDissertation submitted in partial fulfillment of requirements for the degree of Msc in Economics, at Universidade Católica Portuguesa, September 2014.
Abstract
Determinants of Electoral Behavior: A Study Using Individual-Level Data Joana Garcia
gg gg
Previous research on the impact of reforms to the Portuguese electoral system has assessed mechanical effects assuming that the behavior of individuals would remain the same. We improve on this state of affairs by using a rich dataset to study the impact of district magnitude on three relevant decisions made by individuals: the decision to vote or abstain, the decision to vote sincerely or not and the party choice decision. Then, we use our models to predict the effects of four alternative scenarios: uniform-size circles, a reduction of Members of Parliament to 180, a national circle and single-member circles. Besides making contributions to the understanding of how several individual and contextual-level variables shape the voting behavior of the Portuguese, we make four additional contributions in this study. Firstly, we show that the relationship between district magnitude and the probability of abstention is negative and shows diminishing returns. Secondly, we show that the impact of district magnitude on the probability of voting strategically is strikingly similar to its impact on the probability of abstaining. Thirdly, we show that district magnitude plays an important role in shaping the choice of party by individuals. Finally, by using the models estimated we quantify the impact of different types of redistricting on abstention, sincere voting and party choice.
Contents
Acknowledgments i
1 Introduction 1
2 Brief Overview of the Portuguese Electoral System and of the 2002 and
2005 Elections 3
3 Proposals for an Electoral Reform 6
4 Data 8 5 Vote/Abstain Decision 11 5.1 Introduction . . . 11 5.2 Literature Review . . . 11 5.3 Method . . . 14 5.4 Descriptive Statistics . . . 15
5.5 District Magnitude Functional Form . . . 16
5.6 Results . . . 18 5.7 Model Diagnosis . . . 19 5.8 Interpretation of Results . . . 22 5.8.1 Controls . . . 23 5.8.2 District Magnitude . . . 27 5.9 Predictions . . . 27 5.10 Sensitivity Analysis . . . 30 5.11 Conclusions . . . 32
6 Vote Sincerely/Strategically Decision 34 6.1 Introduction . . . 34
6.2 Literature Review . . . 34
6.3 Method . . . 35
6.4 Descriptive Statistics . . . 37
6.5 District Magnitude Functional Form . . . 38
6.7 Model Diagnosis . . . 41 6.8 Interpretation of Results . . . 42 6.8.1 Controls . . . 43 6.8.2 District Magnitude . . . 45 6.9 Predictions . . . 46 6.10 Sensitivity Analysis . . . 48
6.11 Discussion and Policy Recommendations . . . 49
6.12 Conclusions . . . 51
7 Party Choice Decision 53 7.1 Introduction . . . 53
7.2 Literature Review . . . 55
7.3 Method . . . 55
7.4 Descriptive Statistics . . . 57
7.5 District Magnitude Functional Form . . . 60
7.6 Results . . . 61 7.7 Model Diagnosis . . . 62 7.8 Interpretation of Results . . . 62 7.8.1 Controls . . . 63 7.8.2 District Magnitude . . . 68 7.9 Predictions . . . 69 7.10 Sensitivity Analysis . . . 71 7.11 Conclusions . . . 74
8 Conclusions and Discussion 75
References 77
Acknowledgments
This thesis results from my deep interest in Public Economics and Econometrics. There-fore, first of all I am thankful to my Professors of Public Economics (Professor Miguel Gouveia) and Econometrics (Professors João Valle e Azevedo, Leonor Modesto and Pedro Raposo) for their demanding teaching and for inspiring me and sharing with me their passion for these areas. In particular, I would like to express my sincere gratitude to my supervisor Professor Miguel Gouveia for suggesting me working in this interesting theme and for his invaluable help and guidance throughout this semester, not only in this thesis but also in the good experience that was being teaching assistant of Public Economics. I thank Professor Vítor Gaspar for his invaluable comments, for his suggestions of inter-esting articles on the topic and for sharing with me insights about the Portuguese electoral system. I thank Professors Catarina Reis, Leonor Modesto, Pedro Teles, Pedro Raposo and Teresa Lloyd-Braga for helpful comments on a previous version of this work, and in particular Professor Leonor Modesto for suggesting me submitting an earlier version of this research to the ASSET 2014 conference and supporting me throughout the process. I also thank Professors Patrícia Cruz and Geraldo Cerqueiro for their help in the modeling part.
I thank to IPMA for supplying helpful data (rain dataset PT02).
As for other challenges that I faced in my life, the support of my friends and family was crucial. I am thankful to my parents and brother for their guidance and warmth and to Rui Duarte, Ricardo Monteiro and Jordi Martins for their endless generosity and support and for adding loads of happiness to my life. I also thank to my friend Maria Barata for her patience in our endless debates.
1
Introduction
Even though in 40 years of democracy there has not been any significant change in the Portuguese electoral system (with the exception of the reduction of the number of the Members of Parliament from 250 to 230), the electoral reform has been a recurring theme in the Portuguese political agenda and several alternatives have been debated, including a further decrease in the number of Members of Parliament (henceforth MPs) and a transition to a new system that would comprise single-member circles or small multi-member circles with a national circle.
The knowledge of the effects of these alternative scenarios is essential so that they can be assessed strictly. However, research on this topic has focused on the mechanical effects of reforms such as the conversion of votes into seats, assuming that the electoral behavior of electors would remain unchanged if electoral rules changed (e.g. Presidência do Conselho de Ministros (1997) and Freire et al. (2008)). This study is innovative in that it studies what would possibly be the adjustment of the electors’ strategies to the change in electoral rules and not the mechanical effects already addressed by these contributions.
Our approach is to first model three relevant decisions made by individuals: the decision to vote or abstain, the decision to vote sincerely or strategically and the party choice decision. With this analysis, we identify the impact of the number of seats assigned to each district (defined by Rae (1971) as district magnitude) on these decisions. Then, we use our results to predict the effects of four alternative scenarios: a scenario where all circles have the same magnitude, a reduction to 180 MPs, a national circle and single-member circles.
Our approach is innovative and the gains from using it are twofold.
First, our analysis does not draw on a cross-national sample, but uses elections taking place in the same country to avoid possible heterogeneity problems from cross-national pooling. Indeed, the design of any electoral reform, albeit supported by comparative stud-ies, should essentially focus on the analysis of the respective countries because the effects of changes in electoral systems depend on the characteristics of the country concerned, such as basic and social cleavages, cultural factors and the national political context (see Hix et al. (2013)). Moreover, cross national studies typically summarize the distribution of district magnitude within the country using only one single value such as the mean which can be very problematic when district magnitude varies a lot within the country (see Monroe and Rose (2002)).
Portugal fits the ideal conditions for this single country analysis since it has a large vari-ation of district magnitude (currently from 2 seats in the electoral circle of Portalegre to
47 seats in Lisbon). Indeed, Monroe and Rose (2002) examined a sample of sixteen coun-tries using districted proportional representation systems and concluded that Portugal is the country with the largest degree of variation in district magnitude. This variation combined with a high nationalization of the party system creates the ideal conditions for this analysis.
Second, our study uses individual-level data, which is the most appropriate type of data when we are interested in studying the behavior of individuals, avoiding ecological fallacies associated to the use of aggregate data (see Robinson (2009)).
Overall, we contribute to the study of an object of high complexity - the reform of an electoral system - and we believe our conclusions will enrich the quality of this debate that has recently gained a fresh prominence with the issuance of a manifesto by a list of thirty “independent figures” with political ties (see Bourbon (2014)). Moreover, the analysis of our controls examines different factors that influence the electoral behavior of the Portuguese, reasserting previous knowledge but also contradicting some conclusions from other studies and illuminating important new aspects.
The rest of this study proceeds as follows. The second section presents a brief overview of the Portuguese electoral system and of the 2002 and 2005 elections. The third section describes the proposals that have been made for an electoral reform. The fourth section describes the dataset. The fifth section explores the decision to vote or abstain, the sixth section explores the decision to vote sincerely or not and section 7 explores the party choice decision. Section 8 concludes.
2
Brief Overview of the Portuguese Electoral System
and of the 2002 and 2005 Elections
Given that our study uses Portuguese data for the 2002 and 2005 elections, it is informative at this point to summarize some of the relevant characteristics of the Portuguese electoral system and of these elections that are important to the understanding of our study’s methodology and results.
Since the original drafting of the 1976 Constitution, Portugal has used a proportional representation system. Electors vote in the electoral circle where they are registered. Candidates must be presented in party lists and electors vote in one and only one of the lists presented by the political parties, with no possibility for preferential votes to be expressed (closed lists). Votes are then converted into seats in each electoral circle using the D’Hondt formula and there are no electoral thresholds. Candidates are elected according to the votes received by their party and according to the order in which their name appears in the party list.
There are two two-member districts for Portuguese citizens living abroad and the remain-ing 226 legislators are elected in twenty electoral circles with a magnitude that currently ranges from 2 in the district of Portalegre to 47 in Lisbon (see Figure 2.1). In 2002, district magnitude ranged from 3 in Portalegre to 48 in Lisbon; in 2005, it ranged from 2 in Portalegre to 48 in Lisbon.
Figure 2.1: District Magnitude in Portugal
Source: Official Gazette 1st Series A - Number 71-11/04/2011
The two major parties are the center-left Socialist Party (PS) and the center-right Social Democratic Party (PPD-PSD). There are also three minor parties that hold seats: a communist-green alliance (CDU), a conservative party (CDS-PP) and a relatively new left party, the “Left Block” (BE).
Given that our dataset covers the elections of 2002 and 2005, we also present a brief summary of these elections.
The 2002 election took place after the resignation of the former Socialist Prime-Minister António Guterres, following a defeat of PS in the local elections. A right-wing coalition between PSD and CDS-PP came to power with the PSD leader Durão Barroso as Prime Minister.
The 2005 election was won by PS, which obtained its first absolute majority in Par-liament, and took place after the decision of President Jorge Sampaio of dissolving the Parliament due to to the political instability caused by the government led by Pedro Santana Lopes (PSD) in coalition with the CDS-PP. Pedro Santana Lopes had become Prime-Minister after Durão Barroso left the country in order to become President of the European Commission.
Table 2.1: 2002 and 2005 Elections: National Level Results 2002 2005 BE 2.7% 6.4% CDS-PP 8.8% 7.3% CDU 6.9% 7.5% PPD-PSD 40.2% 28.8% PS 37.8% 45.0% Other 1.6% 2.1% Blank 1.0% 1.8% Null 1.0% 1.1% Abstention 38.5% 35.7% ff
3
Proposals for an Electoral Reform
As in other countries, the electoral reform has been a recurring theme in the Portuguese political agenda.
The first wave of proposals occurred in the second half of the 1980s and regarded a change to a system of majority representation that would privilege governability at the expense of proportionality. These proposals emerged as Portugal had five legislative elections between December 1979 and July 1987, which is around an election every 18 months. However, these proposals were no longer discussed after the emergence of absolute majorities of one party between 1987 and 1995 and between 2005 and 2009.
More recently, the discussion shifted to two main points (see Freire et al. (2008)).
First, the divergence of positions concerning the optimal number of MPs has been a controversial aspect. The original text of the Portuguese Constitution has set up a number of MPs that could vary between 240 and 250, and the ceiling was chosen due to concerns about proportionality. In 1989, concerns with the governability of the system created by political instability led to a constitutional revision that reduced the number of MPs to a minimum of 230 and a maximum of 235. This time the minimum was chosen. In 1997, the constitutional revision reduced the number of MPs to a minimum of 180 and a maximum of 230, and the ceiling was chosen. This sequence of events led to the ever-recurring question of whether Portugal has an excessive number of MPs or not.
In 2007, PSD proposed a decrease in the number of MPs to 181 for reasons related to the dignity and efficacy of parliamentary work (Guedes et al. (2007)). However, this proposal was rejected by BE, CDS-PP, PCP and PS. These parties have argued that, from a comparative perspective with other EU countries, Portugal does not have a high number of MPs and a reduction could have negative consequences on the proportionality of the system since it would decrease average district magnitude (see Freire et al. (2008)). Recently, the PS leader said that he will propose reducing the number of MPs to 180 by September 15 (JN (2014)).
Second, the debate has focused on the transition to a system that favors a greater prox-imity between the elected and the electorate, ensuring a greater accountability of MPs and increasing the levels of electoral participation. Two main proposals have been made in this area.
One solution, advocated by PS and PSD, is a transition to a new system that would comprise single-member circles with a national circle (Rodrigues et al. (2002) and Guedes et al. (2007)). Single-member circles would permit a better knowledge of the elected by the electorate and the implied distortions in proportionality would be compensated by a
national circle.
This proposal has been subject to criticism, in particular due to the disadvantages as-sociated to single-member constituencies (see VV.AA. (1998a)). First, single-member districts can lead to a logic of localism and clientelism in the political competition: the political discussion would give much more prominence to local problems and MPs would give more emphasis to the satisfaction of the interests of the constituents of the circle by which they were elected than to the interests of the country. Second, there is the risk that this system would lead to a bipolarization since in these circles only a party can win and therefore the chances of victory would, in general, be focused on the two major parties (e.g. VV.AA. (1998b) and VV.AA. (1998c)). As pointed out by Teixeira (2009) one could expect the introduction of single-member circles “to increase further the effects of the so-called strategic voting” since the electors would be “forced” to vote in one of the two major parties.
Given these shortcomings of single-member circles, Freire et al. (2008) have proposed a system that combines a national circle with multi-member circles of low or medium magnitude (3-10 seats). This proposal was object of a considerable debate since it was known and, in December 2008, PS organized a Parliamentary Conference in the National Assembly with the participation of the authors and various experts that has not led to any reform.
Thus, in 40 years of democracy, there has not been any considerable change in the Por-tuguese electoral system with the exception of the reduction of the number of MPs from 250 to 230. Inter-party divisions have contributed to the failure of reforms but there is also a “fear of the unknown” (Katz (2005)) since any reform is associated with a high level of uncertainty regarding its effects. The knowledge of the effects of these alternative scenarios is essential so that they can be assessed strictly and this fear is reduced. This study intends to contribute to the enrichment of this debate by studying what would possibly be the adjustment of the electors’ strategies to the change in electoral rules. Before delving into the empirical analysis, next section gives an overview of the data used to conduct it.
4
Data
We have built a database that consists of a merger of three different datasets.
Firstly, as individual level data we use survey data from the election study for 2002 and 2005 coordinated by ICS-UL (Social Sciences Institute of the University of Lisbon). The data is based on a random probability sample of eligible voters and includes electoral behavior of 2801 individuals in these years as well as several other variables such as sociodemographic measures. Secondly, the data on district magnitude was obtained in the Official Gazette. Finally, data on the rain was obtained in the Portuguese Weather Institute (IPMA).
Our dataset does not cover four electoral districts: Madeira and Azores (which are not in mainland Portugal), Europe (the district for the Portuguese citizens living abroad in Europe) and Outside Europe (the district for the Portuguese citizens living abroad but not in Europe) because individual-level data is not available.
Almost all variables in the raw data have missing values. On average, the missing per-centage is equal to 6.8%, which is a relatively small number, for example comparing with the percentages reported by Lee and Kang (2009), which lie between 10% and 20%. We have removed all observations with any missing value. Respondents who do not know the answers or refused to answer are coded as missing.
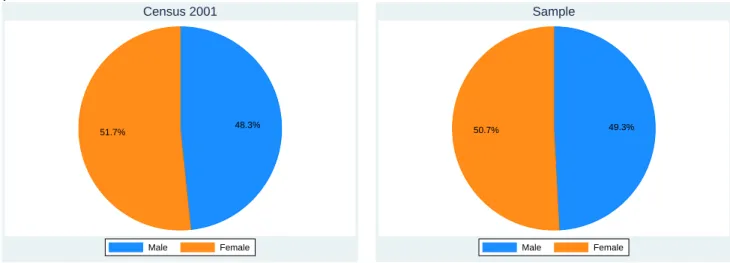
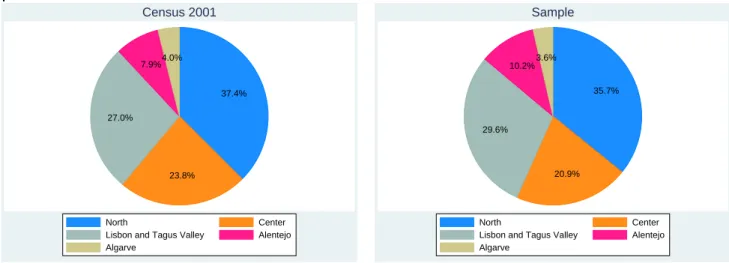
In each part of this study, we will present appropriate descriptive statistics according to the particular decision that we will be analyzing. We present, however, descriptive statistics for three demographic variables that are used throughout our analysis (gender, age and region) and compare them with the Census 2001 information (Figures 4.1, 4.2 and 4.3). We also break down our dataset by district magnitude (Table 4.1).
Figure 4.1: Gender: Comparison of Census 2001 Information with Sample Proportions . 48.3% 51.7% Male Female Census 2001 49.3% 50.7% Male Female Sample ff
Source of Census 2001 Data: Statistics Portugal - Data for the Mainland.
Figure 4.2: Age: Comparison of Census 2001 Information with Sample Proportions . 31.8% 34.0% 34.1% 18-34 35-54 55+ Census 2001 32.6% 36.1% 31.3% 18-34 35-54 55+ Sample ff
Figure 4.3: Regions: Comparison of Census 2001 Information with Sample Proportions . 37.4% 23.8% 27.0% 7.9%4.0% North Center
Lisbon and Tagus Valley Alentejo Algarve Census 2001 35.7% 20.9% 29.6% 10.2%3.6% North Center
Lisbon and Tagus Valley Alentejo Algarve
Sample
ff
Source of Census 2001 Data: Statistics Portugal - Data for the Mainland.
Table 4.1: District Magnitude Frequencies in the Sample District Magnitude
2 3 4 5 6 8 9 10 15 17 18 38 48 Missing Total
5
Vote/Abstain Decision
5.1
Introduction
The reforms to the electoral system that have been proposed imply a change in the dimen-sion of electoral circles. This section aims to understand the consequences on electoral participation that might result from this resizing.
Our plan to achieve this goal is as follows. First, we aim to understand the way in which district magnitude affects (or not) turnout. A first glance at aggregate data for 2002 and 2005 indicates a negative relationship between these variables (see Figure 5.1), but we are not controlling for other variables that might be influencing this relationship. For a proper test, we model the individual decision of voting or abstaining including district magnitude as an explanatory variable to determine its relevance for this decision. Second, we make predictions for different electoral scenarios to show the importance of this effect in a possible resizing of electoral circles.
Figure 5.1: Abstention Rate by District Magnitude (Aggregate Data for the Mainland)
.3 .35 .4 .45 Abstention Rate 0 10 20 30 40 50 District Magnitude 2002 2005 ff
Source: Official Gazette 1st Series A - Number 77-2/04/2002 and Number 47-8/03/2005
5.2
Literature Review
For decades, the idea that higher district magnitude encourages voter participation has been an established rule in the study of electoral behavior (e.g., Powell Jr (1986) and
Jackman (1987)). The argument is that large districts have more parties with electoral chances of winning at least one seat and this provides the voter with an expanded choice set, increasing the probability that one of the parties is a good match for him or her and thereby decreasing the likelihood that none of the options is satisfactory (e.g. Cox (1997) and Blais (2006)). For this reason, almost all research finds higher district magnitude to be a key determinant encouraging voter turnout. Indeed, for Portugal, as Figure 5.2 shows, there is a positive relationship between district magnitude and the number of viable parties1. This provides voters with more viable choices in larger districts, potentially
decreasing abstention.
Figure 5.2: Number of Viable Parties and District Magnitude (2002 and 2005)
2
3
4
5
Number of Viable Parties
0 5 10 15 20 25 30 35 40 45 50 District Magnitude
ff
Source: Official Gazette 1st Series A - Number 247-22/10/1999 and Number 77-2/04/2002
However, in recent years, this positive relationship between turnout and district mag-nitude has been challenged. Brockington (2004) finds that when the number of viable parties is higher, the creation of coalition governments and the increased complexity of the decision making environment may depress turnout. Taagepera et al. (2013) showed that there are two opposite forces - greater likelihood of finding a party close to one’s preferred position and increased complexity of choice - that push in opposite directions as district magnitude increases. Cunow (2013) finds that voters may find themselves overwhelmed by choice and unable or unwilling to make choices when presented with many options.
1We define a viable party as a party that gained at least one seat in that district in the previous
Moreover, recent studies conclude that a large part of the empirical research can be chal-lenged on methodological grounds (e.g. Monroe and Rose (2002) and Blais and Aarts (2006)). These studies point out that most of the research uses the country as the unit of analysis, combines presidential and legislative elections, does not control for the type of electoral system and summarizes the distribution of district magnitude within the coun-try using one single value such as the mean or the median, which may be problematic when district magnitude varies largely within the country. Powell Jr (1986), Jackman (1987), Jackman and Miller (1995) and Pérez-Liñán (2001) use a variable called “nation-ally competitive election districts” that combines electoral formula and district magnitude: “countries with national elections by proportional representation or a national pool for some legislative districts or a simple national presidential vote are assigned a score of four; those with proportional representation in large districts receive a score of three; countries with proportional representation and three to five members per district are scored two; and countries with single-member or winner take-all districts receive the lowest score of one” (Jackman (1987)). This implies that for example Portugal, where district magnitude ranges currently from 2 to 47, would be considered either a two or a three in this classifi-cation, not fully reflecting its electoral system. Blais and Aarts (2006) also consider that, for example, Spain receives “a dubious score of 3”.
Furthermore, in a proper test of the influence of district magnitude on abstention it is necessary to control for individual-level characteristics to avoid ecological fallacies (see Robinson (2009)). Thereby, in this study we will analyze the impact of district magni-tude at the individual-level, taking advantage of the fact that we are able to examine the behavior of electors of the same country who ought to have similar characteristics (assuming those characteristics are based on the variables we control for) in different dis-tricts with different magnitudes. And Portugal is a particularly well-suited case given that district magnitude varies considerably over a meaningful range of values.
To our knowledge, there are very few empirical studies on the impact of district magnitude on turnout that use individual-level data. One exception is the study of Jacobs and Spierings (2010) that includes 32 districts of Dominican Republic and concludes that district magnitude has a highly significant and negative effect on voter turnout. The authors argue that this negative effect is caused by the stronger influence of clientelism in smaller districts (politicians grant economic benefits such as the provision of pork-barrel benefits in exchange for the vote or support of an individual).
For Portugal, to our knowledge there are several articles that use individual-level data to study the impact of several variables on abstention (Magalhães (2001), Freire and Magalhães (2002b), Viegas and Faria (2002) and Freire et al. (2007)) but they do not test
the impact of district magnitude and use methodological and modeling choices that differ from the ones in our analysis.
In sum, the impact of district magnitude on electoral turnout is not as well established in research as it was some years ago and to our knowledge it has not yet been assessed for Portugal. Because of the above-mentioned contradictory effects, it is not clear whether we should expect the impact of district magnitude on turnout to be positive, negative, or nonexistent. We use our rich database with individual-level data to make a contribution to this debate and use our results to make predictions for alternative electoral scenarios.
5.3
Method
Our dependent variable is a binary variable that indicates whether the respondent has abstained or not, which was constructed based on the answers given to the questions about whether the individuals voted or not in the 2002 and 2005 elections.
What we want to study is the individual decision to abstain or not. (5.1) summarizes the individual decision process:
Abstention= 1 if Absention∗ >0 0 otherwise (5.1)
The zero threshold is a normalization and it has no consequence since our vector of regressors will include an intercept. Abstention∗ is unobservable and we assume that it
is linear so that it satisfies the following model:
Abstention∗ = x0β+ υ (5.2)
where x includes the independent variables, β is a vector of regression coefficients and υ is the error-term. For this reduced form, the probability that the individual abstains is given by:
P r(Abstention = 1) = P r(x0β+ υ > 0) = P r(υ > −x0β) (5.3)
Assuming that υ follows a logistic distribution, (5.3) becomes:
P r(Abstention = 1) = Λ(x0β) (5.4)
Λ(z) = e z
1 + ez (5.5)
The model is estimated by maximum likelihood (logit), with inference based on cluster-robust standard errors, clustered by individual.
As independent variables, we use both individual-level variables and context-level vari-ables. Individual-level variables are divided into four categories: individual characteristics, institutional involvement, political variables and position towards issues. As context-level variables, we use district magnitude, data on the rain in the district capital, a time dummy, a measure of urbanization and regional dummies. Table A.1, in the appendix, includes a detailed description and descriptive statistics of all variables. We follow the approach of Jacobs and Spierings (2010) and include as a regressor at the individual level the difference between aggregate turnout figures and the reported turnout in each district to counter for over-reporting at district level.
Next section presents descriptive statistics.
5.4
Descriptive Statistics
For both years, the proportion of abstainers in the sample is substantially lower than in the official results (see Table 5.1), in line with what is common in election surveys (Selb and Munzert (2013)).
Table 5.1: Abstention Rates: Comparison of National Results in the Mainland with Sample
National Results Sample
2002 37.4% 21.3%
2005 34.6% 18.7%
ff
Source of National Results: Official Gazette 1st Series A - Number 77-2/04/2002 and Number 47-8/03/2005
Table 5.2 breaks down abstention rates by individual’s closest party. In 2002, the largest abstention rate is the one for individuals reporting feeling close to BE. For 2005, the largest rate is the one for individuals reporting not feeling close to any party.
Table 5.2: Abstention Rates by Closest Party
BE CDS-PP CDU PPD-PSD PS Other None
2002 28.0% 17.9% 12.7% 13.0% 14.0% 9.8% 26.6%
2005 19.8% 8.6% 8.3% 15.6% 9.7% 12.7% 24.1%
Figure 5.3 breaks down abstention rates by district magnitude in 2002 and 2005. Figure 5.3: Abstention Rates by District Magnitude in Sample
.05 .1 .15 .2 .25 Abstention Rate 0 10 20 30 40 50 District Magnitude 2002 2005 ff
Note: This graphic uses sample proportions. National results are presented in Figure5.1. The observations for Portalegre are not included in this graphic because the abstention rate in both years is equal to 66.67%, which requires a large extension of the y-axis, reducing the clearness
of the results for the other districts.
Next section determines the best specification for the functional form of district magni-tude.
5.5
District Magnitude Functional Form
The common specification of district magnitude in the literature is a logarithmic one. This specification of functional form allows for some nonlinearity in the marginal effect of district magnitude on abstention, meaning, for example, that we should expect a lower impact when district magnitude changes from 25 to 26 when compared to the impact of changing it from 5 to 6.
However, given the recent theories that recognize that there are opposite forces affecting turnout as we increase district magnitude, we start with a more general specification that allows the relationship between abstention and district magnitude to show a reversal by including both the logarithm of district magnitude and its inverse (Model 1). Then, we test two other specifications: including only the inverse of district magnitude (Model 2) and the commonly used logarithmic specification (Model 3). This allows us not to impose a functional form a priori but rather to choose the one that best fits the data.
Instead of the logarithm of district magnitude, we use the logarithm of district magnitude plus one because we will use our model to make predictions for districts of dimension one, as this possibility incorporates one of the electoral reforms proposed for the Portuguese system (Rodrigues et al. (2002) and Guedes et al. (2007)). The impact of this method-ological choice is analyzed in the Sensitivity Analysis section.
The estimates for district magnitude obtained with the estimation of these three models2
are presented in Table 5.3.
Table 5.3: Logit Estimates- Models 1-3
Model 1 Model 2 Model 3
lnM 0.176 (0.457) — — -0.332* (0.195)
1/lnM 3.116 (2.529) 2.240** (1.072) — —
N=1728. * p<0.1; ** p<0.05; *** p<0.01.
Cluster-robust standard errors are in parentheses. Control variables are omitted.
To choose between Models 1-3, we compute three measures that weight both the fit and the parsimony of the model: the Akaike’s information criterion (AIC), proposed in Akaike (1998), the Schwarz’s Bayesian information criterion (BIC), proposed in Schwarz et al. (1978) and McFadden adjusted pseudo-r2 (McFadden (1974)).
The AIC is given by:
AIC = −2lnL + 2q (5.6)
where q is the number of parameters and lnL is the maximized log-likelihood. The BIC is given by:
BIC = −2lnL + ln(n)q (5.7)
2STATA 12.0 is used to implement these models as well as all the statistical analysis throughout this
where n is the number of observations. McFadden adjusted pseudo-r2 is given by:
radj2 = 1 − lnLf ull − q
lnLintercept
(5.8) where lnLf ull is the maximized log-likelihood of the full model and lnLintercept is the one
of the intercept-only model.
Results for these three measures are presented in Table 5.4.
Table 5.4: AIC, BIC and McFadden Adjusted Pseudo-r2 - Models 1-3
Model 1 Model 2 Model 3
AIC 1349.92 1348.12 1350.05
BIC 1584.47 1577.22 1579.15
McFadden Adjusted Pseudo-r2 0.064 0.066 0.064
Model 2 presents the lowest AIC and BIC and the highest McFadden adjusted pseudo-r2
and therefore we choose it to pursue our analysis. Next section presents the estimates obtained for the whole model.
5.6
Results
The results from the estimation of Model 2 are presented in Table 5.5.
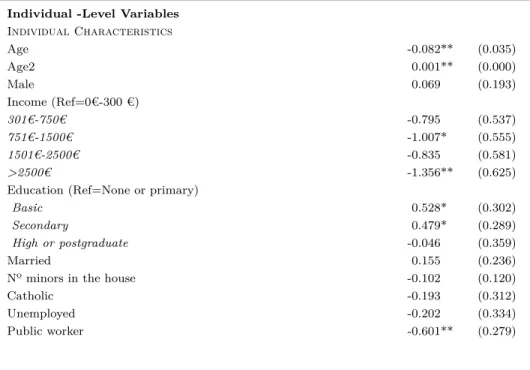
Table 5.5: Abstention Logit Estimates
Individual -Level Variables
Individual Characteristics Age -0.082** (0.035) Age2 0.001** (0.000) Male 0.069 (0.193) Income (Ref=0€-300 €) 301€-750€ -0.795 (0.537) 751€-1500€ -1.007* (0.555) 1501€-2500€ -0.835 (0.581) >2500€ -1.356** (0.625)
Education (Ref=None or primary)
Basic 0.528* (0.302)
Secondary 0.479* (0.289)
High or postgraduate -0.046 (0.359)
Married 0.155 (0.236)
Nº minors in the house -0.102 (0.120)
Catholic -0.193 (0.312)
Unemployed -0.202 (0.334)
Institutional Involvement Church attendance (Ref=Never)
Once a year -0.602* (0.313)
2-11x a year -0.257 (0.280)
1x or more a month -0.686** (0.314)
Once a week or more -0.803** (0.336)
Trade union member -0.523* (0.302)
Political Variables Close to a party (Ref=PS)
BE 0.718 (0.440) CDS-PP 0.631 (0.489) CDU 0.055 (0.482) PPD-PSD 0.363 (0.343) Other -1.641 (1.102) None 0.842*** (0.257)
Informed about politics -0.694** (0.317)
Position towards issues
Wealth inequality 0.073*** (0.028)
Taxes 0.034 (0.035)
Government decision making 0.017 (0.029)
Context-Level Variables
1/lnM 2.240** (1.072)
Rain -0.013 (0.022)
2005 -0.379 (0.254)
Urbanization (Ref=Rural area or village)
Small or middle-size town -0.189 (0.265)
Suburbs of large town or city 0.044 (0.314)
Large town or city 0.396 (0.299)
Regional Dummies (Ref=North)
Center -0.510 (0.314)
Lisbon and Tagus Valley -0.219 (0.272)
Alentejo -0.741* (0.396)
Algarve -0.086 (0.603)
Correction -5.905*** (1.656)
Intercept 1.772 (1.285)
N=1728. * p<0.1; ** p<0.05; *** p<0.01. Cluster-robust standard errors are in parentheses.
Before we proceed to the interpretation of coefficients, next section assesses more deeply the model fit and diagnoses potential problems.
5.7
Model Diagnosis
Firstly, the log-likelihood chi-square test for global significance indicates that the model as a whole is statistically significant with p < 0.0001.
Secondly, we compare predicted outcomes with actual outcomes to assess the fit of the model. Using the estimated model, we predict whether an individual abstains or not setting the following:
ˆ Abstention= 1 if Λ(x0ˆβ) > 0.5 0 if Λ(x0ˆβ) ≤ 0.5 (5.9)
The percentage correctly classified is equal to 85.59%. Note, however, that as most of the sample has Abstention = 0 (80.04%), then it is likely that Λ( ˆx0β) ≤ 0.5 and hence
ˆ
Abstention=0 for most of the observations. Indeed, the model predicts that Abstention =
0 for 98.67% of the observations. This makes the specificity (the fraction of observed
Abstention= 0 cases that are correctly classified) very high (99.39%) and the sensitivity
(the fraction of observed Abstention = 1 cases that are correctly classified) very low (5.51%).
Hence, more generally, a range of cutoff values may be considered. Figure 5.4 plots the sensitivity and specificity values by probability cutoff (c). The point that maximizes their sum is c = 0.140, which leads to a percentage correctly specified equal to 65.10%.
Figure 5.4: Sensitivity and Specificity by Probability Cutoff
0.0 0.5 1.0 1.5 0.0 0.2 0.4 0.6 0.8 1.0 Probability Cutoff Sensitivity Specificity Sensitivity + Specificity
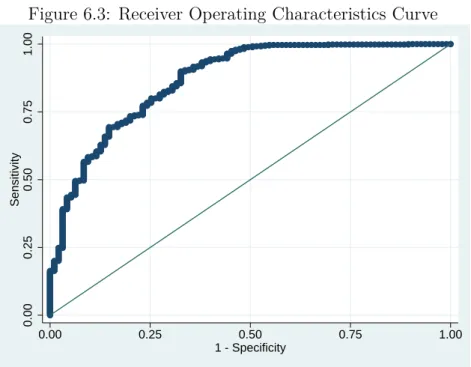
Figure 5.5 plots the receiver operating characteristics curve, which plots sensitivity versus one minus specificity as the probability cutoff varies. A model with no predictive power would be a 45º line. The greater the predictive power the more bowed the curve. The area below the curve is used as a measure of predictive power that ranges from 0.5 (no predictive power) to 1 (perfect model). For our model, the area is equal to 0.7515.
Figure 5.5: Receiver Operating Characteristics Curve 0.00 0.25 0.50 0.75 1.00 Sensitivity 0.00 0.25 0.50 0.75 1.00 1 - Specificity
Thirdly, we conduct the Lagrange multiplier test of generalized logit (Stukel (1988)) to test for model misspecification. We consider as an alternative to the logit model the generalized h-family logit model
Λα(x0β) = e
hα(x0β)
1 + ehα(x0β) (5.10)
where hα(x0β) is a strictly increasing nonlinear function of x0β indexed by the shape
pa-rameters α1 and α2 that control, respectively, the heaviness of the tails and the symmetry
of the function Λα(.). To test for departure from the logit in the direction of an
asym-metric h-family, we add the regressor (x0ˆβ)2 and use a Lagrange multiplier test to test
whether this regressor significantly improves the fit of the model. The null hypothesis of correct model specification is not rejected because the test for the added regressor yields a χ2(1) statistic of 0.0 with p = 0.4622.
Fourthly, we perform the Hosmer and Lemeshow’s goodness-of-fit test (Hosmer and Lemesbow (1980)). We compare the average predicted probabilities n−1P
Λ(x0ˆβ) with
the sample frequency ¯y within groups based on the quantiles of the ordered predicted probabilities. Let ¯ˆpg and ¯yg denominate, respectively, the average predicted probability
and sample frequency in group g. The test statistic is given by:
G
X
g=1
(¯ˆpg− ¯yg)2
Under the null of correct specification, the statistic is distributed as χ2
g−2. Even though
the choice of the number of groups is arbitrary, a common practice is to have 10 groups3.
We follow this practice and obtain p = 0.3220. Therefore, we do not reject the null of correct model specification.
Finally, we test for collinearity problems. The model takes six iterations to converge which is a signal that there is not a high degree of multicollinearity. Then, we compute two interrelated collinearity diagnosis measures: the variance inflation factor and the tolerance, given by:
V IF = 1
tolerance (5.12)
tolerance= 1 − rj2 (5.13)
where r2
j is the coefficient of determination of a regression of regressor j in all the other
regressors. Results are presented in the first two columns of Table A.2, in the appendix. Only for age and its squared is the VIF larger than rule-of-thumb’s4 10 value and is the
tolerance less than 0.1. This is not problematic, as we can solve it by centering squared age. Therefore, if we use (age − mean age)2 instead of age2, VIF and tolerance become
lower than the critical thresholds, as presented in the third and fourth columns of Table A.2, in the appendix, and the coefficients and the standard errors of the other variables (except the constant) remain the same.
Overall, results validate the adequacy of our model. In the next section, we interpret the coefficients obtained.
5.8
Interpretation of Results
Even though our main focus is on the impact of district magnitude, we start with a brief overview of the results obtained for the rest of the model to assess whether the model is performing as expected in most of its variables and to give a picture of the typical reasoning behind the decision to vote or abstain. Then, we interpret the results for district magnitude.
3See Archer et al. (2007). 4See Neter et al. (1996).
5.8.1 Controls
Regarding the impact of age, results show a curvilinear relationship between age and abstention, with a negative significant effect of age on abstention and a positive significant effect of age squared, in line with international studies (see Smets and Van Ham (2013)). Hence, as Figure 5.6 shows, abstention is predicted to decrease with age at a decreasing rate and to have a reversal when age is around 60. Freire and Magalhães (2002b), Viegas and Faria (2002) and Freire et al. (2007) also found a negative relationship between age and abstention for Portugal, but the possibility of a curvilinear relationship was not tested.
Figure 5.6: Mean Predicted Pr(Abstention) and Age
.1 .15 .2 .25 Pr (Abstention) 20 30 40 50 60 70 80 90 Age
Individuals with income between 751€ and 1500€ and more than 2500€ are less likely to abstain than those with income between 0€ and 300€. Figure 5.7 shows the average pre-dictions for each income class. This negative relationship between income and abstention is in line with international studies (see Smets and Van Ham (2013)). For Portugal, Ma-galhães (2001) concluded that, for 1999, this variable is not significant, but this variable was treated as continuous, not exploring non-linear effects.
Figure 5.7: Predictive Margins for Income with 95% Confidence Level 0 .1 .2 .3 .4 .5 Pr(Abstention) 0 -300 301 -750 751 -1500 1501 -2500 >2500 Income (Euros)
Regarding the educational attainment variables, results show that the probability of ab-staining is higher for individuals with basic or secondary education when compared with individuals with no education or primary education. For individuals with high or post-graduate education, the difference is not statistically significant for a significance level lower than 10%. Figure 5.8 shows the average predictions for each education class. These results go against our expectation that the more educated people are the less they abstain. One possible explanation for this result is that people with more education perceive better that their vote has a very little influence over the election outcome. This result explains why turnout levels have not raised in advanced western democracies despite the rise of educational attainment levels (Burden (2009)).
Figure 5.8: Predictive Margins for Education with 95% Confidence Level .05 .1 .15 .2 .25 Pr(Abstention)
None or Primary Basic Secondary High or Postgraduate Education
For Portugal, Magalhães (2001), Viegas and Faria (2002) and Freire et al. (2007) found that educational attainment is not significant to explain abstention and Freire and Magal-hães (2002b) found a negative relationship. However, this variable is treated as continuous, not looking into non-linear effects.
Public workers are potentially more affected by the decisions taken by the government. So, as expected, we estimate that they are less likely to abstain: we estimate that the probability of abstaining is 0.059 points lower. This is directionally in line with the results of Corey and Garand (2002) for the US. For Portugal, this variable was not included in the above-mentioned studies.
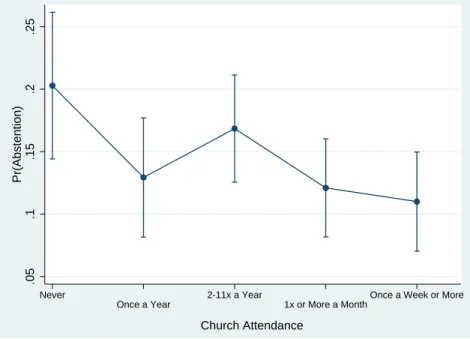
Attendance of church has, in general, a negative statistically significant impact on the probability of abstaining (Figure 5.9 shows the average predictions for each category). This result was to be expected since attendance of religious services builds civic skills that are thought to promote civil commitment and stimulate political participation (Gerber et al. (2008)). This result is in line with international studies (see Smets and Van Ham (2013)) and with the conclusions of Viegas and Faria (2002) for Portugal. In the latter study this variable is treated as continuous, not exploring for non-linear effects.
Figure 5.9: Predictive Margins for Church Attendance with 95% Confidence Level .05 .1 .15 .2 .25 Pr(Abstention) Never Once a Year 2-11x a Year 1x or More a Month
Once a Week or More
Church Attendance
Also, our findings indicate that belonging to a trade union has explanatory power. We estimate the probability of abstention to be lower for trade union members in 0.052 points. This was expected since unions emphasize values that are thought to mobilize citizens (Radcliff and Davis (2000)) and this conclusion is in line with the results for Portugal obtained by Freire and Magalhães (2002b), Viegas and Faria (2002) and Freire et al. (2007). Most international studies do not find a statistically significant effect for this variable (see Smets and Van Ham (2013)).
Of the political variables, individuals that report not being close to any party are more likely to abstain than those that report being close to PS. Previous studies, both national (Magalhães (2001), Freire and Magalhães (2002a), Viegas and Faria (2002) and Freire et al. (2007)) and international (see Smets and Van Ham (2013)), have already found a positive impact of not being close to any party on abstention. Being more informed decreases the probability of abstention, in accordance with international studies (see Smets and Van Ham (2013)).
Of the position towards issues variables, results show that the more individuals believe that there should be more incentives for individual initiative, instead of a more equal distribution of wealth, the more they abstain. This result is in line with our expectations, since the less people attribute an important role to the government, the more they abstain (in line with other studies, e.g. Brockington (2009)). This variable was not included in previous national studies.
the North. To our knowledge, regional dummies were not included in previous studies for Portugal.
5.8.2 District Magnitude
Figure 5.10 illustrates the effect of district magnitude on abstention, with predicted values derived from the estimation of Model 2 and with all the regressors except the inverse of district magnitude at the mean.
Figure 5.10: Mean Predicted Pr(Abstention) and District Magnitude
.1 .15 .2 .25 .3 .35 Pr(Abstention) 0 10 20 30 40 50 District Magnitude
The plot shows a diminishing returns (asymptotic) effect. Indeed, there is a steep decline in the probability of abstention as district magnitude increases followed by a flattening out of this relationship.
This shape indicates that the vast bulk of improvements in electoral participation can be realized with quite modest district magnitudes, meaning that districts of moderate size can allow for relatively low abstention rates while bearing relatively fewer of the costs associated to very large districts (for example in terms of the so-discussed distance between the elected and the electors).
5.9
Predictions
In order to estimate the effects of potential electoral reforms on turnout, we compare abstention outcomes under five different scenarios.
Our reference is the current system. Then, we make predictions for four hypothetical scenarios. First, we consider a system where all circles have the same magnitude, equal to the mean magnitude (uniform circles), a theoretical scenario that enables us to assess the impact of the nonuniformity of district magnitude. Second, given the proposals to decrease the MPs to 180, we compute the hypothetical MPs in each circle under this scenario using the D’Hondt formula (the new distribution of district magnitude is detailed in Figure A.1, in the appendix) and we predict the impact on the mean probability of abstention. Third, given the proposals that comprise a national circle and single-member circles, we also consider these scenarios. Caution should be taken in the interpretation of these last two scenarios since we are making out-of-sample predictions of substantial changes to the current electoral system.
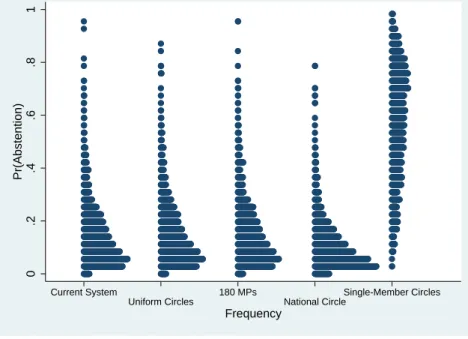
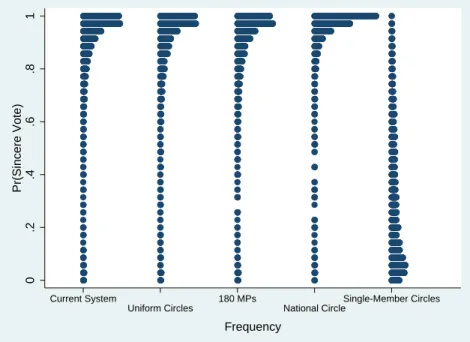
The mean predicted probability of abstention in the five scenarios is given in Table 5.6. The distributions of the predicted probability of abstention are plotted in Figure 5.11, which groups individuals together vertically (as in a histogram) according to their pre-dicted probability of abstention.
Table 5.6: Mean Predicted Pr(Abstention) Under the Alternative Scenarios Scenario Mean Predicted Pr(Abstention)
Current System 14.8%
Uniform Circles 15.5%
180 MPs 15.7%
National Circle 10.8%
Figure 5.11: Distribution of the Predicted Pr(Abstention) Under the Alternative Scenarios 0 .2 .4 .6 .8 1 Pr(Abstention) Current System Uniform Circles 180 MPs National Circle Single-Member Circles Frequency
Firstly, results show that the mean probability of abstention is higher under the uniform circles system than under the current system. This means that the current heterogeneity in the dimension of electoral circles (that results from different amounts of electors across districts) leads to a lower mean probability of abstention than the one that would hold in a theoretical system where all districts have the same magnitude.
Secondly, the 180 MPs scenario also leads to a higher mean predicted probability of ab-stention than the current system. This was to be expected given the negative relationship that we have found between the probability of abstention and district magnitude. In-deed, with a decrease on the number of MPs there is a decrease of the average district magnitude which has a negative impact on abstention.
Thirdly, under the national circle scenario, the mean predicted probability of abstention decreases substantially, which again was to be expected given the negative relationship we have found between abstention and district magnitude.
Finally, under a scenario with single-member circles, the mean predicted probability of abstention increases dramatically. As expected, these circles “stimulate” abstention (VV.AA. (1998d)). However, the result is too extreme most likely due to the small num-ber of observations available for very small districts.5
5For Portalegre, with district magnitude equal to 2 in 2002 and equal to 3 in 2005, we only have
3 individuals and a sample abstention rate of 66.66%. Note, however, that these observations are not influencing the negative relationship previously found between abstention and district magnitude as the coefficient of the inverse of district magnitude remains significant and positive when we exclude them from the estimation of the model (see the Sensitivity Analysis section).
Hence, results indicate that a system with uniform circles, a reduction of the MPs to 180 and single-member circles would have a negative impact on turnout. A national circle, on the other hand, would have a positive impact.
5.10
Sensitivity Analysis
In our estimated model, we use the inverse of district magnitude plus one instead of the inverse of district magnitude because of our intention of using the model to make predictions for districts of dimension one. We show that this choice has no substantial implications for our conclusions. Indeed, when we estimate the model using the inverse of district magnitude, the coefficients of the control variables are similar (see Table A.3, in the appendix) as well as the impact of district magnitude, even though, for small districts, the difference between the mean predicted probability of abstention between the two models is larger (see Figure 5.12).
Figure 5.12: Mean Predicted Pr(Abstention) and District Magnitude: Using ln(MPs+1) and ln(MPs) .1 .15 .2 .25 .3 .35 Pr(Abstention) 0 10 20 30 40 50 District Magnitude ln(MPs+1) ln(MPs)
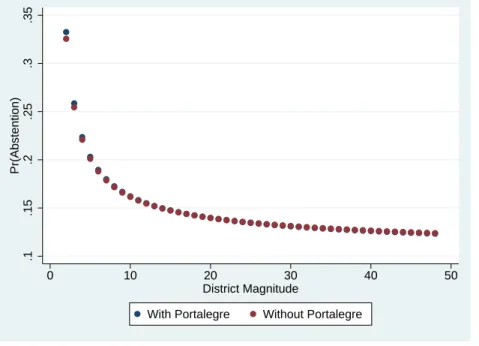
Secondly, given the small number of observations available in our dataset for Portalegre, we estimate our model excluding this district. The coefficients of the control variables are similar (see Table A.4, in the appendix) and for district magnitude the mean predicted probability of abstention is slightly smaller for very small districts (see Figure 5.13).
Figure 5.13: Mean Predicted Pr(Abstention) and District Magnitude: With and Without Portalegre .1 .15 .2 .25 .3 .35 Pr(Abstention) 0 10 20 30 40 50 District Magnitude
With Portalegre Without Portalegre
Finally, we estimate the model assuming that υ in (5.2) is standard normal distributed (probit). Then (5.4) is replaced by:
P r(Abstention = 1) = Φ(x0β) (5.14)
where Φ(.) is the cdf of the standard normal.
The models yield quite different estimates for the regression coefficients since different formulas are used for the probabilities. To make them comparable, we compute the marginal effects at the mean as these are scaled similarly across models.
The marginal effects, with respect to a change in the continuous regressor xj, evaluated
at x = ¯x, for the logit and the probit model, are given by (5.15) and (5.16), respectively:
∂P r(Abstention = 1) ∂xj = Λ(¯x 0ˆβ)n 1 − Λ(¯x0ˆβ)o ˆβj (5.15) ∂P r(Abstention = 1) ∂xj = Φ(¯x0ˆβ)ˆβ j (5.16)
For the dummy variables, the marginal effect is the the discrete change in the predicted probability of Abstention = 1, as the dummy variable changes from 0 to 1.
Results are presented in Table A.5, in the appendix. As often is the case6, there is little
difference between these models. In particular for district magnitude, the mean predicted probability of abstention is very similar across models (see Figure 5.14), even though it is slightly lower for very small districts when the probit model is used. Since the models have the same number of parameters, the natural metric to compare them is the fitted log-likelihood. The probit model has a log likelihood of -631.90 which is 0.16 lower than the -632.06 for the logit, favoring the probit model but suggesting little additional gain to using one model rather than the other.
Figure 5.14: Mean Predicted Pr(Abstention) and District Magnitude: Using Logit and Probit .1 .15 .2 .25 .3 .35 Pr(Abstention) 0 10 20 30 40 50 District Magnitude Logit Probit
5.11
Conclusions
We have proposed a model that explains the individual decision of voting or abstaining. Most of the control variables perform as was theoretically expected, confirming previous knowledge and illuminating new aspects of the electoral behavior of the Portuguese. In terms of the impact of district magnitude, we have found that a larger district mag-nitude encourages electoral participation and quantified this relationship. We have con-cluded that there is a steep decrease in the probability of abstaining as district magnitude increases followed by a flattening out of this relationship. This means that districts of moderate size can allow for relatively low abstention rates while bearing relatively fewer of the costs associated to very large districts (for example in terms of the so-discussed distance between the elected and the electors).
We have also tested a specification that allows for a reversal point but the fit of the model is lower, indicating that there is not a point where the increased complexity of the decision making environment outweighs the incentives created by a higher probability of finding a party close to one’s position.
Then, we have made predictions for four alternative electoral scenarios to shed light on the consequences on abstention of potential electoral reforms that imply a resizing of electoral circles. We have shown that the heterogeneity in terms of district magnitude leads to a lower mean probability of abstention than the one that would hold in a theoretical system where all districts have the same magnitude. For the reduction to 180 MPs, we have estimated an increase in the mean probability of abstention and we have quantified it. Next, even though we are aware that our method is not the most accurate to make predictions for national and single-member circles, since the smaller district in our sample has 2 seats and the largest has 48, we have made out-of-sample predictions that give us a rough measure of the potential consequences of these scenarios on abstention. Results indicate that a national circle would decrease the mean probability of abstention and single-member circles would increase it dramatically. For the latter we have obtained an extreme result that we believe can be justified by the small number of observations available in our dataset for very small districts. Ideally, one would need a larger sample or a survey that oversamples individuals in these districts.
All in all, our findings have one substantial implication: district magnitude influences the probability of abstaining and therefore this change in the behavior of electors should not be disregarded in electoral engineering debates.
6
Vote Sincerely/Strategically Decision
6.1
Introduction
Literature on voting behavior has shown that voters may find it rational to vote for a party other than the most preferred one in order to avoid wasting their vote in a party with no viable chances of being elected to parliament. Such voters are traditionally called “strategic voters”.
Given that district magnitude is a critical determinant of the number of viable parties (Taagepera and Shugart (1989)), we expect it to influence the decision to vote sincerely or strategically. The idea is as follows: in small districts, voters that have as favorite party a party that is not viable may defect from it and instead vote for a viable party with prospects of gaining a seat. In contrast, in large districts with more viable parties, most voters may simply vote for their preferred party. A key implication is that, as the proposed electoral reforms imply a resizing of electoral districts, they can potentially have an impact on whether people vote for their favorite party or not.
In order to study the strategic electoral behavior of the Portuguese and its implications, we proceed in a similar way as for the vote/abstain decision. First, we aim to understand whether district magnitude affects (or not) the decision to vote sincerely or strategically. Then we illustrate the implications of this relationship for the proposed electoral reforms.
6.2
Literature Review
Duverger’s Law (Duverger et al. (1954)) highlights the importance of strategic voting under first-past-the-post (FPTP) systems, such as those in the US and in the UK, where there is only one winner per district: the candidate with the most votes. His argument is that voters do not simply take into account their preferences but also the expectation about the outcome of the election, for instance whether their most preferred candidate is actually a viable alternative in their electoral district. This, as Duverger argues, depresses the chances of “third” parties.
Duverger thought that strategic voting would not emerge under Proportional Represen-tation (PR) systems, such as the Portuguese one, since these systems distribute the avail-able seats in proportion to each party’s votes. Following the same reasoning, Bowler and Lanoue (1992) mention that “under proportional representation, voters can help “their” party by voting for it under any circumstances; thus, voting sincerely is a dominant strategy”.
Contrarily to these views, Leys (1959) and Sartori (1968) argue that strategic voting is significant under PR systems, but only in districts with a magnitude lower than five. The argument is that in districts larger than five the percentages that separate winners from losers are smaller and therefore the informational requirements needed to become confident that a particular party is out of the running in the upcoming election become too high. As a result, in PR systems with large district magnitudes strategic voting should not be an empirically relevant phenomenon. This hypothesis was validated later by Cox (1994) and Cox and Shugart (1996) that analyze Japanese and Japanese and Colombian aggregate data, respectively.
However, recent research has challenged these conclusions. Forsythe et al. (1993), Gschwend (2007) and Lago (2008) conclude that strategic votes can also be cast in large districts because voters only need to know if the party they prefer has some chance of winning at least one seat in their district and for that they only need to look back to the previous election, which is not harder for voters in large districts.
Given the diversity in findings, it is not clear whether we should expect district magnitude to impact the decision to vote sincerely or strategically in PR systems and whether there is a cutoff point. To our knowledge this impact has not yet been assessed for Portugal, with the exception of Gschwend (2007) that, using aggregate data, concludes that parties that did not gain any seat in the previous election are likely to have a lower percentage of votes in the next election and shows that this effect is weaker in larger districts. As Portugal has quite a wide range of district magnitude, at this point it is relevant to take advantage of that and assess the impact of district magnitude within the country using our rich individual-level data, avoiding problems from cross-national pooling and from the use of aggregate data. Moreover, to our knowledge there is not any study for Portugal that examines individual-level factors that might influence the probability of voting sincerely or not. Hence, the analysis of our control variables is an important contribution to the understanding of other factors, besides district magnitude, that might influence this decision.
The detailed methodology used in our analysis is explained in the next section.
6.3
Method
Our dependent variable is a binary variable that indicates whether the voter has voted sincerely or not. To construct this variable, we compare the answer given by the respon-dent to the question about whether she usually thinks of herself as close to any particular party (and if yes, which party) with the party the respondent declares having voted for.
Hence, we will consider that a voter is sincere if she votes for the the party that she reports feeling close to7; otherwise, the voter is considered strategic. This terminology
is not uniform across studies. For example, Felsenthal and Brichta (1985) emphasize the process and not the outcome: a strategic voter is one that takes into consideration how others are likely to vote and strategic voters are those that are not interested in other voters’ preferences and probable decisions. Blais and Nadeau (1996), Blais et al. (2001) and Blais et al. (2005) define a strategic voter as one that does not vote for the preferred alternative and is motivated by the intention to affect the outcome of the election. What we want to study is the individual decision to be a sincere or a strategic voter. (6.1) summarizes the individual decision process:
Sincere= 1 if Sincere∗ >0 0 otherwise (6.1)
Sincere∗ is unobservable and we assume that it is linear so that it satisfies the following
model:
Sincere∗ = x0β+ υ (6.2)
where x includes the independent variables, β is a vector of regression parameters and υ is the error-term. The probability that the individual votes sincerely is given by:
P r(Sincere = 1) = P r(x0β+ υ > 0) = P r(υ > −x0β) (6.3)
Assuming that υ follows a logistic distribution, :
P r(Sincere = 1) = Λ(x0β) (6.4)
where Λ(.) is the logistic cdf with:
Λ(z) = e z
1 + ez (6.5)
The model is estimated by maximum likelihood (logit), with inference based on cluster-robust standard errors, clustered by individual.
As controls, we use both individual-level variables and context-level variables. Table A.6, in the appendix, includes a detailed description and descriptive statistics of all variables.
7When the individual reports feeling close to more than one party, we use the party that she feels
Next section presents descriptive statistics.
6.4
Descriptive Statistics
We present our dependent variable broken down by three factors: year, closest party and district magnitude.
The proportion of sincere voters is equal to 85.9% in 2002 and 87.6% in 2005. Breaking down by closest party (Table 6.1) the proportion of sincere voters is relatively high for individuals that feel close to one of the two major parties, which is expected since these individuals have less incentives to use strategic voting options (Felsenthal and Brichta (1985) and Duch and Palmer (2002)). Surprisingly, in 2005 the proportion of sincere voters for individuals that feel close to CDS-PP is higher than the one for individuals that feel close to PPD-PSD. The proportion of sincere voters for individuals that feel close to one of the residual parties is very low, which is expected given that these parties are not viable in any district (see Table 6.2).
Table 6.1: Proportion of Sincere Voters by Closest Party
BE CDS-PP CDU PPD-PSD PS Other
2002 63.1% 80.4% 81.8% 98.7% 93.7% 0%
2005 77.3% 93.4% 84.6% 90.4% 96.5% 4.8%
Table 6.2: Number of Districts (in the Mainland) in Which Parties are Viable BE CDS-PP CDU PPD-PSD PS Other
2002 1 9 7 17 18 0
2005 2 8 6 17 18 0
ff
Source: Official Gazette 1st Series A - Number 247-22/10/1999 and Number 77-2/04/2002
Breaking down by district magnitude, there is not a clear relationship between sincere voting and district magnitude (see Figure 6.1). However, several factors might be con-taminating this two-way analysis. Therefore, we will make a proper test, controlling for several variables, to determine whether district magnitude influences the probability of voting sincerely or not.
Figure 6.1: Sincere Voting by District Magnitude in Sample .5 .6 .7 .8 .9 1
Sincere Voting (Proportions)
0 10 20 30 40 50
District Magnitude 2002 2005
Next section determines the best specification for the functional form of district magni-tude.
6.5
District Magnitude Functional Form
As for the vote/abstain decision, we estimate three different models to determine the best functional form for district magnitude.
We start with a more general specification that allows the relationship between sincere voting and district magnitude to show a reversal by including both the logarithm of district magnitude and its inverse (Model 1). Model 2 includes only the inverse of district magnitude, allowing for a steep increase in sincere voting as district magnitude increases while district magnitude is below a given level (potentially 5) and a flat curve afterward. Finally, we estimate the common specification in the literature: a logarithmic one (Model 3). Again, we use the logarithm of district magnitude plus one because we will use our model to make predictions for districts of dimension one.
The estimates for district magnitude obtained with the estimation of these three models are presented in Table 6.3.
Table 6.3: Logit Estimates - Models 1-3
Model 1 Model 2 Model 3
lnM -0.674 (0.844) — — 0.566* (0.328)
1/lnM -7.871* (4.731) -4.243** (1.792) — —
N=719. * p<0.1; ** p<0.05; *** p<0.01.
Cluster-robust standard errors are in parentheses. Control variables are omitted.
The computation of the Akaike’s information criterion (AIC), Schwarz’s Bayesian infor-mation criterion (BIC) and McFadden’s adjusted pseudo-r2 (see Table 6.4) indicates that
Model 2 is the most appropriate model. Therefore we choose it to pursue our analysis. Table 6.4: AIC, BIC and McFadden Adjusted Pseudo-r2 - Models 1-3
Model 1 Model 2 Model 3
AIC 424.48 423.15 425.15
BIC 607.60 601.69 603.69
McFadden’s Adjusted Pseudo-r2 0.244 0.246 0.243
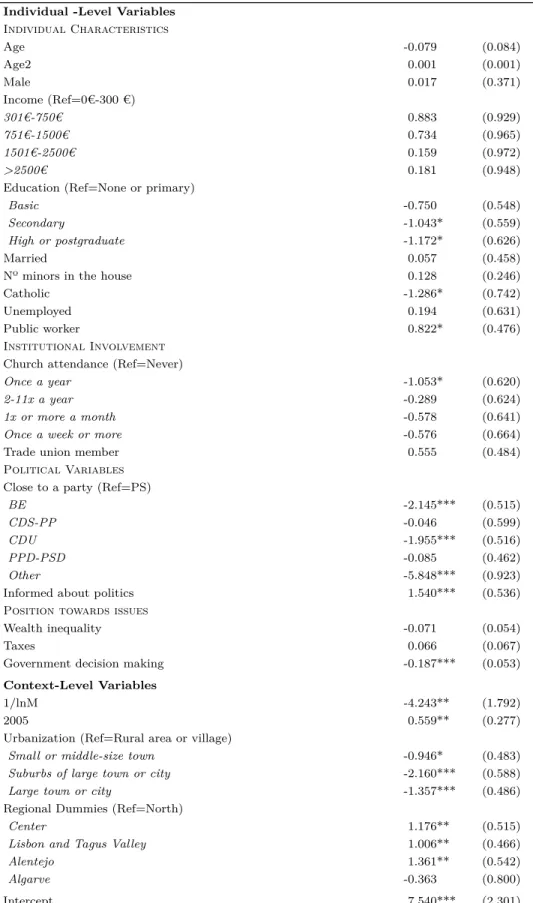
Next section presents the logit estimates and standard errors obtained with the estimation of Model 2.