Oviedo University Press 116 ISSN: 2254-4380
Economics and Business Letters 2(3),116-127, 2013
A comparative analysis of business R&D policy in Spain and Portugal
Adão Carvalho1* • Beatriz Corchuelo2*1
Department of Economics / CEFAGE-UE, University of Évora, Portugal
2
Department of Economics, University of Extremadura, Spain
Received: 1 September 2013 Revised: 4 November 2013 Accepted: 4 November 2013
Abstract
This paper compares the R&D policy strategy of Spain and Portugal to promote business R&D spending by focusing on the R&D objectives, incentives and outcomes. It aims to uncover new matters for policy attention and research concerning the public support for business R&D. These countries have similar R&D structural problems to address, two of the most generous fiscal systems for R&D and comparatively low S&T indicators as compared to the EU average. Both failed to reach the R&D intensity goals of the past and it is unlikely they will reach the R&D goals set for 2020. Nevertheless, the rationale for attracting international R&D investment is competitive. Three important issues call for attention: the inverse public incentive structures for business R&D, the faster growth of the BERD/GDP ratio in Portugal over recent years and the implications of the tax reform in Spain in 2008. As a conclusion, we believe that both countries are missing opportunities for mutual learning and should coordinate their R&D public policies.
Keywords: Business R&D, R&D incentives, R&D policy, Spain, Portugal
JEL Classification Codes: H25, O38, O57.
1. Introduction
Spain and Portugal have different size but comparable structural problems of science and technology (S&T) to address. Recent R&D policy has been designed to increase the historical low-level of domestic expenditures on R&D (GERD) and business R&D (BERD), aiming to reach the European Union (EU) average R&D spending. Better R&D incentives were offered to attain the ambitious R&D goals set by both countries, which have two of the most generous tax incentive systems to face the growing competition for international R&D investment
*
Corresponding author. E-mail: [email protected].
Citation: Carvalho, A. and Corchuelo, B. (2013) A comparative analysis of business R&D policy in Spain and Portugal, Economics and Business Letters, 2(3), 116-127.
117 (OECD, 2008; Carvalho, 2012). R&D is a fundamental input of innovation and governments assumed a leading role in promoting business R&D after the Lisbon Agenda in 2000. Catching-up countries like Spain and Portugal take the EU average as reference to assess their S&T indicators and define R&D goals and policies with this framework in mind. This is tricky since the EU average indicators are moving targets and there is the risk of setting R&D goals not consistent with the country’s R&D potential. On the other hand, the setting of business R&D intensity goals and the globalization of business R&D pose new challenges to public policies, even because Governments do not have a control of important variables like GERD, GDP or the firms’ strategic options. Governments are in a process of learning on how to best promote business R&D spending in this new setting, which is easily noticeable in the many different approaches taken recently by the EU countries to do that.1 That is, learning how to best use the tools – direct support and tax incentives – to promote business R&D, its design, the relative advantage of each tool, and the effectiveness of R&D policy. But, there are also opportunities for learning and identify research issues in a close comparative analysis of R&D policies of neighbouring countries sharing comparable problems and objectives, including the opportunity to conceive common R&D policies, an innovative approach requiring a major change in the way R&D policy and R&D instruments are currently conceived.2
This paper is a first attempt to compare the R&D policy strategy of Spain and Portugal to promote business R&D, with particular focus on the R&D objectives, incentives and outcomes. In our knowledge, there are no previous studies that have focused on this goal and this constitutes the main novelty of this work. The research has an exploratory character and aims to uncover new lines of research and matters for policy attention concerning the public support of business R&D in both countries.
The methodology used is based on the analysis of public information available in official reports and databases, and covers the period from the mid-1990s to include the period of time in which at least one of the countries have set R&D intensive goals. The paper makes an overview of the recent S&T policy and structural R&D problems of both countries, addresses the incentives policy to stimulate business R&D, examines the R&D goals policy and compares the evolution of BERD with the EU average before the conclusion.
Results show that both countries failed to reach the R&D intensity goals of the past and it is unlikely they will reach the R&D goals set for 2020. Nevertheless, the rationale for attracting international R&D investment is competitive as the evolution of both tax incentive systems for R&D shows. Three issues appear to be important in future policy options and call the attention of policy makers and researchers: the fact that Spain and Portugal have inverse incentive structures for business R&D, the faster growth of the BERD/GDP ratio in Portugal over recent years and the implications of the Spanish R&D tax reform in 2008. As a conclusion, we believe that both countries are missing opportunities for mutual learning and should coordinate their R&D public policies.
2. Structural and policy challenges
Spain and Portugal entered the former CEE in 1986 and started to build their S&T system in the 1980s, after emerging from a dictatorship in the 1970s. With poorer S&T indicators than the OECD/EU average, the R&D policy over the last decades has targeted similar R&D
1 The OECD (2010b) report makes an overview of the many approaches taken by governments to leverage business R&D.
2
Indeed, Portugal and Spain have an institutional R&D partnership in the area of nanotechnology – The Interna-tional Iberian Nanotechnology Laboratory (http://www.english.umic.pt/).
118 structural problems related to the size of R&D expenditure and relative weight of each performance sector: R&D expenditures (as a % of GDP) well below the EU average; BERD/GERD ratio smaller than that of the institutional sector (HES+GOVERD+PNP), smaller than the EU average and the two thirds the EU wants; number of full-time equivalent researchers (FTE) per one thousand workers smaller than the OECD average and, unlike the OECD, FTE researchers in higher education in Spain and Portugal outnumber those of the business sector.
The arrival of democracy in the late 1970s brought Spain the opportunity to build the S&T system, which the civil war and the dictatorship have deteriorated. The 1986 Law of Science, Technology and Innovation has shaped the S&T system since then. It has set up a multiannual S&T framework, a budget provision, an Annual Plan for R&D where the thematic priorities are defined, created CICYT3 for the coordination, planning and control of the annual plans, and started providing financial support for business R&D through CDTI4. The new Law of S&T&I of 2011 defines the Spanish S&T&I system as integrating the central government system and all regional systems, including the agents of coordination, financing and execution. The Spanish S&T Strategy and the Spanish Innovation Strategy materialize the multiannual S&T framework to achieve the objectives shared by the regional administrations, the Science, Technology and Innovation Council, the Science, Technology and Innovation Advisory Council, and the Spanish Committee for Research Ethics. The Spanish S&T&I Strategy 2013-2020 and the R&D Annual Plan 2013-2016 were recently approved.
In Portugal, the creation of JNICT5 in 1967, an institution sought to stimulate the domestic technology base, signaled the birth of the S&T policy (Caraça, 1999). In the 1980s, after the dictatorship, Portugal started to build the foundations of its S&T system with the creation of basic infrastructures, launching of mobilizing programs and setting a legal framework. The first official statistics on R&D date back to 1982. The 1988 law on scientific research and technological development addressed all aspects of S&T policy, including objectives, priorities, planning, evaluation, mobility of researchers and articulation with the innovation policy (Caraça, 1999). CIENCIA and PEDIP were the main policy instruments in the 1990s designed to create the infrastructures for science, research and development. The Technological Plan in 2005, the government’s determination to raise R&D spending and the public incentives for R&D have had great impact on the S&T indicators recently.
2.1 Public incentives for R&D
Ambitious R&D goals and generous public incentives are two aspects of the leadership role assumed by Spain and Portugal to promote business R&D after the Lisbon Agenda. The rationale of market failure traditionally used to explain the public support of private R&D, where the presence of externalities makes private R&D spending smaller than the socially optimal (Arrow, 1962; Nelson, 1959), is no longer enough in the context of goals-based R&D policies. Innovation and economic growth, for which R&D is a fundamental input, and country competition for international R&D investment and researchers are also important (Carvalho, 2012). R&D tax incentives, for instance, are encouraged by the European Union and widely used in the OECD countries, but are not conceived according to the rationale of market failure since they do not discriminate sectors, technologies or research areas.
Figure 1 shows OECD estimates for the two main types of public support for private R&D. Direct funding (subsidies, loans...), the traditional way of public intervention, is better to target specific firms, sectors or technology areas; indirect support (tax incentives), which
3 CICYT - Comisión Interministerial de Ciencia y Tecnología. 4
CDTI - Centro para el Desarrollo Tecnológico e Industrial. 5
119 targets all R&D performers and projects, gained popularity in the OECD more recently: 12 countries in 1995, 18 in 2004, 26 in 2011 (OECD, 2011). The public incentives in Spain (0.15% of GDP) and Portugal (0.13% of GDP) are comparable and greater than countries with higher R&D spending (Germany, Finland), but the incentive structure is totally different. According to Figure 1, direct funding represents 80% of the Spanish incentives while in Portugal about 84% are tax incentives. This is interesting and meaningful if we think that Spain and Portugal were placed second and fourth in the ranking of the best tax incentive systems but Portugal has had a faster growth of BERD/GDP ratio over the recent years, as we will see below.
Figure 1. Direct funding and tax incentives for R&D, 2009 (% of GDP)
Source: OECD (2011)
Both countries offer firms various direct funding opportunities for R&D, either for individual projects, projects in consortium or contracting out. Reports of the Spanish main funding agency, CDTI, show that CDTI’s funding between 2006 and 2011 amounted to 6443M€ to support 6815 projects, including projects of technological development, technological innovation, cooperative industrial research, large public-private research consortia, cooperative R&D and NEOTEC. QREN 2007-2013 is the main Portuguese public funding instrument for business R&D, which supports individual R&D projects, R&D centres, collective R&D, mobilising projects, projects of demonstration, co-promotion projects and R&D vouchers. As on December 2012, QREN’s total R&D funding amounted to 1.9M€, benefiting 8136 firms in an estimated investment of 8.2M€ (QREN, 2013).
Many countries are implementing and improving R&D tax incentives systems, even countries traditionally averse to this kind of public support. It is the government’s best tool to influence business R&D and attain R&D goals, which explains its increasing popularity. Spain and Portugal, together with France and Canada, have the most generous and attractive
120 tax incentive systems of the OECD to promote business R&D6 (Tables 1 and 2). In Spain, R&D tax incentives are in place since the 1980s, but major changes were introduced in 1995 with the new law on corporate taxation. Portugal first introduced R&D tax incentives in 19977 and since then has seen the Spanish tax incentives system as a reference and a competitor for international R&D investment. Between 1999 and 2008, the change in tax treatment of R&D was more significant in Portugal (OECD, 2010a): in Spain, for each unit of R&D expenditure there was a tax relief of 0,313 units in 1999 and 0,349 units in 2008; in Portugal the tax relief changed from 0,15 units in 1999 to 0,281 units in 2008.
Table 1. Evolution of the Spanish R&D tax incentives system
1995 1999 2000 2001 2004 2007* 2008 2011
Level rate 20% 30% 30% 30% 30% 27% 25% 25%
Increment rate 40% 50% 50% 50% 50% 46% 42% 42%
Expenditures on R&D personnel - 10% 10% 10% 20% 18% 17% 17% Cooperation with universities and
Technological Centres - 10% 10% 10% 20% 20% - -
R&D capital expenditures (except
buildings) - - - 10% 10% 9% 8% 12%
Expenditures in innovation 10-15% 10-15% 10-15% 10-15% 10-15% 10-15% 10-15%
Deduction base Income tax payable
Years to claim benefits 5 5 10 10 10 15 15 15
Tax credit limit per year 35% 35% 45% 45% 50% 50% 50% 60% Sources: Legislation; Corchuelo (2004)
Note: (*) Alternative option of deducting from the social security tax liability Table 2. Evolution of the Portuguese R&D tax incentives system
1997 2001 2005(a) 2009 2010
Level rate 8% 20% 20% 32.5% 32.5%
Increment rate 30% 50% 50% 50% 50%+20%(b)
Deduction base Income tax payable
Years to claim benefits 3 6 6 6 6
Tax credit limits per year: - volume-based tax credit - increment tax credit
No limit 249399€ No limit 498799€ No limit 750000€ No limit 1500000€ No limit 1800000€ Sources: Legislation; Carvalho (2012)
Note: (a) To take effect in 2006; (b) +20% for costs with R&D personnel holding a PhD
There are several points to highlight by comparing both systems. First, the number of times the systems have changed, 8 in Spain and 5 in Portugal, showing the commitment of governments to improving its generosity and attractiveness. Second, while in Portugal all changes were to improve the generosity of the system, important to restore confidence in SIFIDE and materialize the government’s commitment to increase BERD after 2005, in Spain part of the benefits were reduced in 2007, perhaps in recognition of the inefficiency of some benefits or just as an adjustment recommended by the accumulated experience. Third, both systems use a two-level deduction base: a “level rate” applied on the volume of a firm’s R&D expenditures of the year; an “increment rate” applied on the increment of a firm’s average R&D expenditures over past two years. Fourth, the deduction base is the firm’s income tax
6 As measured by the tax benefit for each euro invested in R&D using the B-index method. Data for 2008. See OECD (2010a).
7
In Portugal, the tax incentive system (SIFIDE) has been replaced by “RFI – Reserva Fiscal para Investimento” (Fiscal Reserve for Investment) in 2004 and 2005, and reintroduced again in 2006.
121 payable and firms can claim benefits up to 6 years in Portugal and 15 in Spain. Fifth, both systems allow R&D projects to benefit from direct funding and tax incentives (on the part not supported by direct funding).
It is puzzling that Spain and Portugal have similar and generous tax incentive systems but entirely different public incentive structures. As a research hypothesis, it is worth investigating if the complexity and compartmentalization of the Spanish system, and the less restrictive tax credit deduction in Portugal makes the difference. In a study of Spanish firms, Corchuelo and Martínez-Ros (2008) found that bureaucracy and lack of knowledge about the incentives were two important motives for firms not using tax incentives in Spain.
3. R&D policy by objectives: targets and achievements
This is the goals-based R&D policy era (Carvalho, 2012). Currently, many countries define R&D intensity goals8 in their S&T plans and policies to achieve in a specific time frame, presumably conscious that BERD and GDP variables are beyond a Government’s control. The EU’s 3% R&D goal is the best known example of a goals-based R&D policy framework, but many non-European countries are following suit, including the US, China, Brazil, Japan or Korea. R&D expenditures are key to knowledge-based economies and countries like Spain and Portugal are concerned with correcting the structural underinvestment in R&D by the business sector and catching up with the EU average R&D spending.
Tables 3 and 4 compare R&D intensity goals in Spain, Portugal and the EU9. Spain has set GERD objectives since 1996 under the four year S&T&I plan.10 Portugal first defined R&D goals in 2000, but only after 2005 the government has shown determination to achieve the ambitious goals set that year under the Technological Plan. The EU has set R&D intensity goals at the Barcelona Council in 2002 and currently are a key element of the R&D policy under the Europe 2020 Strategy. Practically every EU country has defined long-term R&D intensity goals in their National Reform Programmes in 2011. None of the GERD objectives set by Spain, Portugal and the EU has been achieved, often with substantial discrepancies between targets and achievements. For example, Spain invested 1.39% of GDP in R&D in 2010 (2% target); Portugal invested 1.59% in R&D in 2010 (1.8% target). Table 4 shows a similar picture for BERD since none but one BERD goal has been achieved. These results are not the exception, but rather the pattern of the goals-based R&D policy era since only in a few cases R&D intensity goals have been achieved (v.g., GERD of Denmark in 2010: 3.07% for a target of 3%).
8 GERD and BERD as a % of GDP.
9 In gathering the data, we have considered the lowest scenario (example, Spain 1996-1999: 0.9%, 1.0% and 1.3% scenarios) and the lowest interval range (example, Portugal 2011-2020: 2.7%-3.3%) when applicable. 10
“Plan Nacional de Investigación Científica y Desarrollo Tecnológico” which follows from the framework law of “Fomento y Coordinación General de la Investigación Científica y Técnica” (Ley 13/1986).
122 Table 3: GERD targets and achievements in Spain, Portugal and the EU (% of GDP)
Targets
(beginning of the period target year)
Achievements (Target year or most recent) 1 9 9 6 1 9 9 7 1 9 9 8 1 9 9 9 2 0 0 0 2 0 0 1 2 0 0 2 2 0 0 3 2 0 0 4 2 0 0 5 2 0 0 6 2 0 0 7 2 0 0 8 2 0 0 9 2 0 1 0 2 0 1 1 … 2 0 1 4 2 0 1 5 … 2 0 2 0 Spain 0.83 0.90 0.86 (1999) 0.86 1.29 1.05 (2003) 1.05 1.22 1.40 1.27 (2007) 1.12 1.60 2.00 1.39 (2010) 1.27 2.20 1.33 (2011) 1.27 2,50 1.33 (2011) 1.33 3.00 1.33 (2011) Portugal 0.73 1.00 0.99 (2006) 0.78 1.80 1.59 (2010) 1.50 1.90 2.70 1.50 (2011)
European Union (27 countries)
1.88 3.00 2.01 (2010)
2.01 3.00 2.03 (2011) Sources: CICT (1996), European Commission (2003,2010), Eurostat, FECYT (2007a, 2007b), Gobierno de España (2011), MCT (2000), MCT (2003), Ministerio de la Presidencia (1999, 2005), The Government of Portugal (2005, 2011).
Table 4: BERD targets and achievements in Spain, Portugal and the EU (% of GDP)
Targets
(beginning of the period target year)
Achievements (Target year or most recent) 1 9 9 6 1 9 9 7 1 9 9 8 1 9 9 9 2 0 0 0 2 0 0 1 2 0 0 2 2 0 0 3 2 0 0 4 2 0 0 5 2 0 0 6 2 0 0 7 2 0 0 8 2 0 0 9 2 0 1 0 2 0 1 1 … 2 0 1 4 2 0 1 5 … 2 0 2 0 Spain 045 0.84 0.57 (2003) 0.57 0.70 0.82 0.71 (2007) 0.71 1.33 0.70 (2011) 0.71 1.63 0.70 (2011) 0.70 2.00 0.70 (2011) Portugal 0.20 0.25 0.46 (2006) 0.30 0.80 0.73 (2010) 0.69 1.70 0.69 (2011)
European Union (27 countries)
1.20 2.00 1.24 (2010)
1.24 2.00 1.26 (2011) Sources: European Commission (2003, 2010), Eurostat, FECYT (2007a, 2007b), Gobierno de España (2011), MCT (2000), MCT (2003), Ministerio de la Presidencia (1999), The Government of Portugal (2005, 2011).
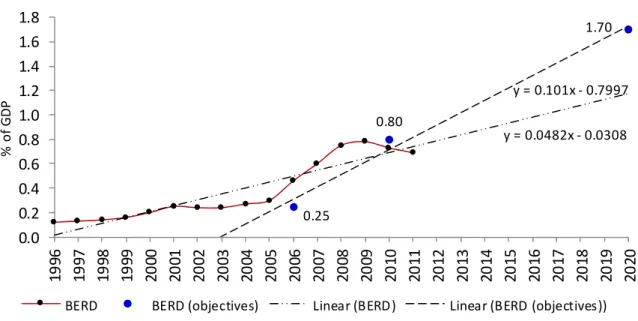
Figures 2 and 3 compare the BERD intensity goals up to 2020 with the past evolution of the BERD/GDP ratio. The two trends are clearly divergent in both countries, suggesting that the BERD objectives for 2020 are ambitious and unlikely to be achieved. In Spain, the BERD/ GDP ratio has to grow at a rate of 12.4% annually to reach the 2% goal in 2020 (comparing with the 4% growth rate between 1996 and 2011). In Portugal, the 27% annual growth rate between 2005 and 2009 is unlikely to occur in the future (even with negative growth rates of GDP since 2008). The BERD/GDP ratio is tailing off from a peak of 0.74% in
123 2008 (Spain) and 0.75% in 2009 (Portugal).
Figure 2. Spanish BERD: evolution and objectives for 2020
0.84 0.70 0.82 1.33 1.63 2.00 y = 0.0251x + 0.362 y = 0.0786x + 0.0275 0.2 0.4 0.6 0.8 1.0 1.2 1.4 1.6 1.8 2.0 1 9 9 6 1 9 9 7 1 9 9 8 1 9 9 9 2 0 0 0 2 0 0 1 2 0 0 2 2 0 0 3 2 0 0 4 2 0 0 5 2 0 0 6 2 0 0 7 2 0 0 8 2 0 0 9 2 0 1 0 2 0 1 1 2 0 1 2 2 0 1 3 2 0 1 4 2 0 1 5 2 0 1 6 2 0 1 7 2 0 1 8 2 0 1 9 2 0 2 0 % o f G D P
BERD BERD (objectives) Linear (BERD) Linear (BERD (objectives))
Sources: Eurostat, Table 4
Figure 3. Portuguese BERD: evolution and objectives for 2020
0.25 0.80 1.70 y = 0.0482x - 0.0308 y = 0.101x - 0.7997 0.0 0.2 0.4 0.6 0.8 1.0 1.2 1.4 1.6 1.8 1 9 9 6 1 9 9 7 1 9 9 8 1 9 9 9 2 0 0 0 2 0 0 1 2 0 0 2 2 0 0 3 2 0 0 4 2 0 0 5 2 0 0 6 2 0 0 7 2 0 0 8 2 0 0 9 2 0 1 0 2 0 1 1 2 0 1 2 2 0 1 3 2 0 1 4 2 0 1 5 2 0 1 6 2 0 1 7 2 0 1 8 2 0 1 9 2 0 2 0 % o f G D P
BERD BERD (objectives) Linear (BERD) Linear (BERD (objectives))
Sources: Eurostat, Table 4
Portugal, Spain and the EU are not good at establishing R&D intensity goals. They have failed all but one goal so far and, likely, will fail to achieve the business R&D goals for 2020, which raises questions about the way R&D objectives are set and the effectiveness of goals-based R&D policies. Although Governments do not have a control over relevant variables, results suggest that R&D intensity goals were set without taking due account of the economic conditions to achieve those goals. In 2011, Spain and Portugal defined ambitious R&D goals when the economic crisis was well underway and the BERD/GDP ratio was showing signs of downturn in both countries. Strangely, for the Government of Portugal (2011) the objectives “are consistent with the macroeconomic context”! The current economic crisis will certainly worsen the conditions for achieving the goals, but the making of R&D policy requires
124 reflexion.
4. Business R&D expenditures in Spain and Portugal
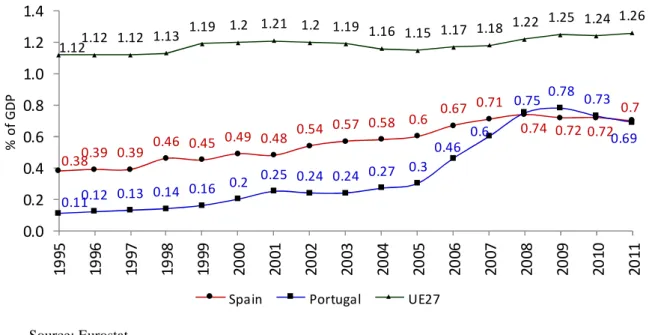
R&D intensity goals are a poor yardstick for the evaluation of business R&D policy because failure is the rule. Public R&D incentive is but one factor that has influence on a firm’s decision to invest in R&D. Three broad goals that are of concern of both countries for a long time justify the increasing generosity of public incentives and can be used for evaluating the effectiveness of the R&D policy: to increase BERD as a percentage of GDP, catch up with the EU average business R&D spending, and increase the BERD/GERD ratio to two thirds. Figures 4, 5 and 6 show the evolution of these indicators from mid-1990s onwards.
Over the 1995-2011 period, the EU BERD increased steadily and so did the Spanish BERD up to 2008. In Portugal the evolution of R&D indicators is irregular, with periods of faster growth and periods of faster decline. Starting from a much lower level, the business R&D intensity ratio in Portugal increased steadily before 2005 and registered high growth rates up to 2009, positing Portugal above Spain and allowing a faster catch-up with the EU average. The ratio has decreased in both countries since the start of the crisis, suggesting that the change in the R&D structure of both countries occurred up to then was not yet consolidated. Figure 5 shows the effort of Spain and Portugal to catching up with the EU average BERD spending. Between 1995 and 2008, the Spanish and the Portuguese BERD/GDP ratios raised from 34% and 10%, respectively, to over 60% of the EU ratio. Part of this remarkable evolution, sharper in Portugal after 2005, should be credited to the R&D policy aimed at increasing business R&D expenditures.
Figure 4: Evolution of BERD in Spain, Portugal and EU27, 1995-2011
0.380.39 0.39 0.46 0.45 0.49 0.48 0.54 0.57 0.58 0.6 0.67 0.71 0.74 0.72 0.72 0.7 0.110.12 0.13 0.14 0.16 0.2 0.25 0.24 0.24 0.27 0.3 0.46 0.6 0.75 0.78 0.73 0.69 1.121.12 1.12 1.13 1.19 1.2 1.21 1.2 1.19 1.16 1.15 1.17 1.18 1.22 1.25 1.24 1.26 0.0 0.2 0.4 0.6 0.8 1.0 1.2 1.4 1 9 9 5 1 9 9 6 1 9 9 7 1 9 9 8 1 9 9 9 2 0 0 0 2 0 0 1 2 0 0 2 2 0 0 3 2 0 0 4 2 0 0 5 2 0 0 6 2 0 0 7 2 0 0 8 2 0 0 9 2 0 1 0 2 0 1 1 % o f G D P
Spain Portugal UE27
125 Figure 5. Evolution of BERD in Spain and Portugal as a % of EU27 BERD, 1995-2011
33.934.8 34.8 40.7 37.8 40.8 39.7 45.0 47.9 50.0 52.2 57.3 60.2 60.7 57.6 58.1 55.6 9.810.7 11.6 12.4 13.4 16.7 20.7 20.0 20.2 23.3 26.1 39.3 50.8 61.5 62.4 58.9 54.8 0 10 20 30 40 50 60 70 1 9 9 5 1 9 9 6 1 9 9 7 1 9 9 8 1 9 9 9 2 0 0 0 2 0 0 1 2 0 0 2 2 0 0 3 2 0 0 4 2 0 0 5 2 0 0 6 2 0 0 7 2 0 0 8 2 0 0 9 2 0 1 0 2 0 1 1 % o f U E 2 7 B E R D Spain Portugal Source: Authors
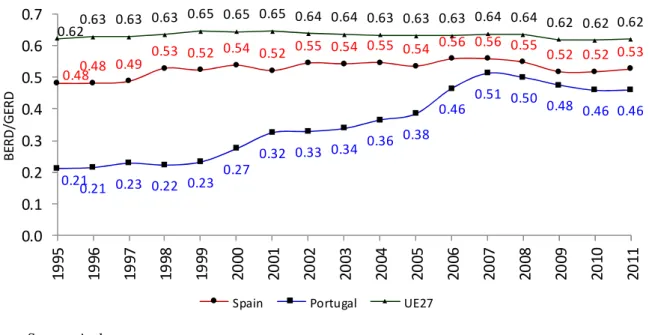
Figure 6 shows that the evolution of the EU’s BERD/GERD ratio has been rather unclear, and remained in the 62-65% range over the period. It shows the difficulty that the EU has had to achieve the goal of two-thirds of R&D expenditures by the business sector, and why this objective remains important in the 2020 strategy. In Spain, this ratio registered phases of growth and decrease but remained in the 52-56% range until 2011 and about 9.7 points below the EU average over the period. In Portugal, the business expenditures evolved differently. In 1998, the BERD was only 21% of GERD, representing 34% of the EU average and 44% of Spain’s. The BERD/GERD ratio registered high growth rates until 2007 and decreasing rates thereafter, exceeding 50% in 2007 and 2008 only. The weight of the public sector in the country’s global R&D expenditures is still too big in both countries and the objective that two-thirds of that investment be the responsibility of private sector is still very distant.
Figure 6. Evolution of BERD/GERD ratio in Spain, Portugal and EU27, 1995-2011
0.480.48 0.49 0.53 0.52 0.54 0.52 0.55 0.54 0.55 0.54 0.56 0.56 0.55 0.52 0.52 0.53 0.21 0.21 0.23 0.22 0.23 0.27 0.32 0.33 0.34 0.36 0.38 0.46 0.51 0.50 0.48 0.46 0.46 0.620.63 0.63 0.63 0.65 0.65 0.65 0.64 0.64 0.63 0.63 0.63 0.64 0.64 0.62 0.62 0.62 0.0 0.1 0.2 0.3 0.4 0.5 0.6 0.7 1 9 9 5 1 9 9 6 1 9 9 7 1 9 9 8 1 9 9 9 2 0 0 0 2 0 0 1 2 0 0 2 2 0 0 3 2 0 0 4 2 0 0 5 2 0 0 6 2 0 0 7 2 0 0 8 2 0 0 9 2 0 1 0 2 0 1 1 B E R D /G E R D
Spain Portugal UE27
126
5. Conclusion
This exploratory research uncovers three major issues of business R&D policy in Spain and Portugal that deserve further research and policy attention, namely the possibility of policy coordination as a way to address common problems and objectives and respond to the globalization of business R&D, the effectiveness of goals-based R&D policies, and differences in the public incentive structures. Despite facing comparable R&D structural problems, Spain and Portugal have not seen advantages in a deeper coordination of their business R&D policies yet. Indeed, there is a competitive rationale behind the evolution of both tax incentive systems, and R&D policy coordination would involve a major change in the way the R&D policy is conceived. They have done an enormous effort to strengthen their S&T system, increase business R&D expenditures, catching-up with the EU average S&T indicators, respond to the EU R&D challenge and move towards economies based on knowledge and innovation, but so far they have not explored ways of implementing common policies and remain competitive in the attraction of international R&D investment. Following the trend, R&D intensity goals have gained key importance in the S&T policy of both countries, but only a goal has been achieved, often existing great discrepancies between targets and achievements. The business R&D intensity goals up to 2020 and the historical evolution of the BERD/GDP ratio are diverging in both countries, meaning that the 2020 R&D goals will hardly be achieved. This calls into question the goals-based R&D policies and the ability of governments to set business R&D goals. Governments’ R&D intensity objectives are a poor yardstick to assess the business R&D policy, which is better done against the broad R&D policy goals. Despite the increasing generosity of the public incentives and the tendency to reduce the gap with the EU average, only the objective of increasing BERD as a percentage of GDP registered a partial success. Perhaps unexpectedly, the BERD/GDP ratio in Portugal has grown faster than in Spain, resulting in a faster approach of Portugal to Spain and the EU average, especially after 2005. The latter will certainly be better explained by understanding the implications of the fact that Spain and Portugal have comparable and generous tax incentive systems but completely different public incentive structures. There are lessons to be learned from each country’s R&D policy.
Acknowledgements. This research has been supported by Junta de Extremadura (project IB10013). The
authors are grateful to the audiences at the 11th Economic Policy International Conference (Bilbao, May 30-31, 2013) and 27th International Congress on Applied Economics ASEPELT (Zaragoza, July 4-6, 2013) for helpful comments. The authors are also grateful for the valuable comments of two anonymous referees.
References
Arrow, K. (1962) Economic welfare and the allocation of resources for invention, in R. Nelson (ed.), The Rate and Direction of Inventive Activity, Princeton, NJ: Princeton University Press.
Caraça, J.M.G. (1999) A prática de políticas de ciência e tecnologia em Portugal, in M.M. Godinho, J.M.G. Caraça (eds.), O Futuro tecnológico - Perspectivas para a Inovação
em Portugal, 1, 7-18, Oeiras, Celta Editora.
Carvalho, A. (2012) ¿Por qué son los incentivos fiscales cada vez más utilizados para estimular la inversión privada en I+D? (Why are tax incentives increasingly used to stimulate private R&D spending?), Principios. Estudios de Economía Política, 21, 99-116.
127 Tecnología (CICT), Madrid.
Corchuelo, M.B. (2004) Decisiones de inversión en investigación, desarrollo e innovación de las empresas: análisis de los incentivos fiscales, Crónica Tributaria, 113, 9-28.
Corchuelo, M.B. and Martínez-Ros, E. (2008) Aplicación de los incentivos fiscales en las empresas manufactureras españolas, Hacienda Pública Española/Revista de Economía
Pública, 187, 9-39.
European Commission (2003) Investing in research: an action plan for Europe, Communication from the Commission, COM(2003) 226 final/2.
European Commission (2010) Europe 2020 - A strategy for smart, sustainable and inclusive
growth, Communication from the Commission, COM(2010) 2020 final.
FECYT (2007a) Estrategia Nacional de Ciencia y Tecnología, Fundación Española para la Ciencia y la Tecnología (FECYT), Madrid.
FECYT (2007b) Plan Nacional de Investigación Científica, Desarrollo e Innovación
Tecnológica 2008-2011, Diciembre 2007, Fundación Española para la Ciencia y la
Tecnología (FECYT), Madrid.
Gobierno de España (2011) Programa Nacional de Reformas - España 2011, Madrid.
MCT (2000) POCTI - Programa Operacional Ciência, Tecnologia e Inovação 2000-2006, Ministério da Ciência e da Tecnologia, Aprovado pela Comissão Europeia em 28 de Julho de 2000, Lisboa.
MCT (2003) Plan Nacional de Investigación Científica, Desarrollo e Innovación Tecnológica
2004-2007 - Resumen, Ministerio de Ciencia y Tecnología, Madrid.
Ministerio de la Presidencia (1999) Plan Nacional de Investigación Científica, Desarrollo e
Innovación Tecnológica 2000-2003, I, Secretaría de Estado de la Comunicación,
Madrid.
Ministerio de la Presidencia (2005) Convergencia Y Empleo - Programa Nacional de
Reformas de España, Secretaría General Técnica, Madrid.
Nelson, R. (1959) The simple economics of basic scientific research, Journal of Political
Economy, 76, 297-306.
OECD (2008) OECD Science, Technology and Industry Outlook 2008, OECD Publishing. OECD (2010a) OECD Science, Technology and Industry Outlook 2010, OECD Publishing. OECD (2010b) R&D tax incentives: rationale, design, evaluation, November, OECD
Publishing.
OECD (2011) OECD Science, Technology and Industry Scoreboard 2011, OECD. OECD (2012a) Main Science and Technology Indicators, Vol. 2012, Issue 2, OECD. OECD (2012b) OECD Science, Technology and Industry Outlook 2012, OECD.
QREN (2013) Boletim Informativo QREN nº 18, Comissão Técnica de Coordenação do QREN, Janeiro, Lisboa.
The Government of Portugal (2005) Plano Tecnológico - Uma estratégia de crescimento com
base no Conhecimento, Tecnologia e Inovação, Lisboa.
The Government of Portugal (2011) Portugal 2020 - National Reform Programme, March 2011, Lisboa.