EXAMINATION OF IMPACT OF PHARMA R&D ON PROFITABILITY Tömöri Gergő
Accounting and Finance Department, Faculty of Applied Economics and Rural Development, University of Debrecen, Debrecen, Hungary
tgerg2@gmail.com
Abstract: By today, in our business environment, mostly based on innovation, the potential opportunities in the pharmaceutical sector and impact of these to the national economic trends has a determining significance. This latter requires the examination of the impact of research and development activity as the most important factor to the profitability of two selected regional market leader pharma companies and presentation of how these groups handle their high operating risks which resulting from these investments. National and international importance of the pharmaceutical industry defined by not only the prominent role of application of the biochemical academic research, but the humanitarian concerns which increasingly appreciating in the global context. In the developing and overpopulated countries the risks of become massive epidemics arisen from the emergence viruses which mutating quickly and in increasingly complex forms has risen due to the scientist discoveries and more modernize preventive procedures. These facts – in view of growing efficient immune substances developing procedures – are stronger pressure on the industrial actors, with this affecting the profitability of future operations. The farming specificities and their role can be illustrated well by comparing the activities of the Central European market-leader Richter and the world-renowned Swiss Novartis which ranked number two in sales with approximately 47 billion dollar among the world-wide pharma groups in 2010. Since the comparable figures based on IFRS, it must be also mention that how the international accountant standards display these management areas. Among the examined factors, the pharma R&D activity had the highest impact on the long-term firming both individually and in comparison, but the different of the financial strategy and accounting policy as a kind of asset of risk management had no negligible. My analysis is mostly theoretical and based on quantitative methods. All the pharma companies cross-border can use my results, because they show that why need to pay more attention in this sector to the R&D in order to preserve their market position, thus to ensure multilaterally the prevention of the diseases.
Keywords: pharma, R&D, profitability, management, risks, IFRS JEL classification: O32
1. Sectoral outlook
are attributed to this sector since in this area proceed of technological changes relatively rapid due to the introduction of the new medicinal preparations. Partly because of this, the health budget expenditures have increased dramatically worldwide owing to the impact of ever growing costs pressure (FRANK–CHEE-RUEY, 2007.). The pharmaceutical industry is under growing pressure from a range of environmental issues, including major losses of revenue owing to patent expirations, increasingly cost-constrained healthcare systems and more demanding regulatory requirements (STEPHEN et al).
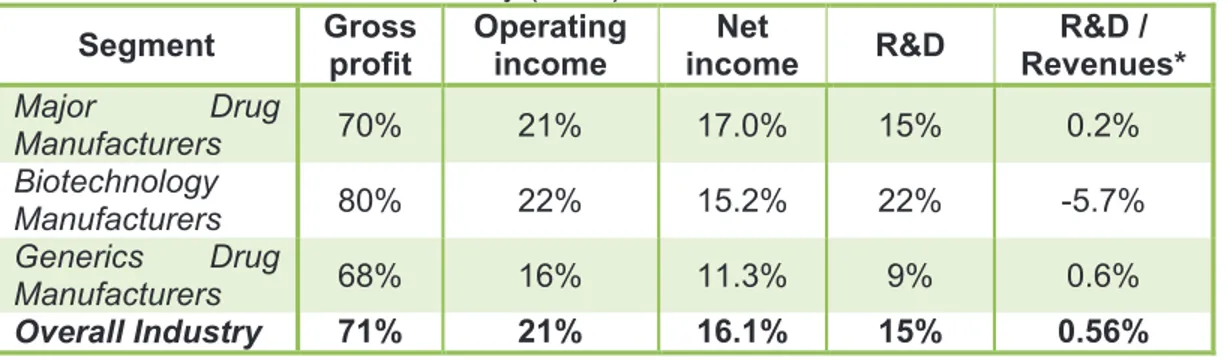
Table 1: Key financial data of the three major segments of the pharmaceutical industry internationally (2012). Revenue = 100%
Segment Gross profit
Operating income
Net
income R&D
R&D / Revenues*
Major Drug
Manufacturers 70% 21% 17.0% 15% 0.2%
Biotechnology
Manufacturers 80% 22% 15.2% 22% -5.7%
Generics Drug
Manufacturers 68% 16% 11.3% 9% 0.6%
Overall Industry 71% 21% 16.1% 15% 0.56%
*it shows, how R&D change with every additional bnUSD in net sales. Source: Business Data Insight (I1), 2013.
Industry margins in the sector are high enough and as it can see the splits below, the Major Drug Manufacturers segment is the most profitable one, which also indicates 17% net margin as a result of the exploitation of blockbuster drugs, which brings in high cash flows (FRANCESCO, 2013). The principle of economy of scale prevails: generally speaking that overall in the industry, the R&D expenses decrease with the company getting bigger in owing to mostly the fact that many activities are shared and further efficiencies found (FRANCESCO, 2013). According THOMAS (2007) the pharmaceutical market can be divided three sections based on the type of costumers: patients, institutional buyers (hospitals, pharmacies) and the government. In the traditional retail market the price of prescribed medicinal products is paid out by the consumers and/or the social insurance, so this segment is the less price-sensitive. Although the medical institutions may use certain products limited by the law, these able to cause large demand for some preparations via the freedom of the drug contest, so their strong market position and price sensitivity is also higher than the retail consumers, which has been a key factor in terms of profitability for manufacturers.
2. Material and method
3. Comparative analysis of the profitability of the Richter and Novartis
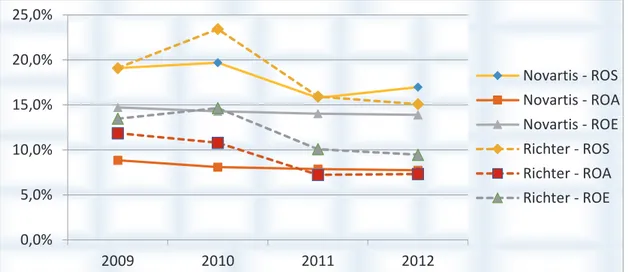
It is necessary to underline those financial indicates to the exam of the profitability which reflects that how effectively provide its result through the managemant of scarce resources (LUC – TARNÓCZI, 1995). These include the return on sales (ROS), assets (ROA) and equity (ROE).
Figure 1: Comparison of the three profitability rates (2009-2012) Source: own compilation.
The ROS after tax in 2009 and 2011 are almost equal in the two company groups, in turn the index of Richter fell to a lower level in 2012 at the same time when increased the borrowed loan portfolio. The Richter’s ROA after tax in 2011 approached to the same index of the Novartis partly due to the total asset turnover rate, on the other hand the decreasing returns of sale which effect has manifested to the return on equity: the Hungarian factory was able to provide more capital increase for its owners only in 2010. Because of the positive impact of the equity multiplier, the ROE indicators in both cases were higher than ROA rates: the Novartis could multiply its equity approximately twice as good as the Richter the years under review. Later, in the comparison of effects, I use pre-tax ROS and ROA in my analysis in order to simplification, as comparison made it difficult by several factors: these include the different tax environment, the marginal effect of income taxes on basic tendency and the consolidated type of reports.
3.1. The impact of the pharma R&D and innovation investments
The most capital-intensive type of the pharma industry is explained by the R&D expenditures and the related investments which are significant part of all the expenses related to the manufacturing activity. Furthermore, the associated potential government grants and tender sources also have to be considered as revenue-raising items until marketing of the newly developed products, from the time when it also contributes to the revenue growth so it plays an important role in determine of the result. Requirements for the presentation of R&D expenses are outlined under IAS 38, which enable that the accounting treatment of intangible assets and in case of accomplish of internationally valid conditions identification and account of those. IAS 38 applies to the advertising and start-up as well as the R&D – in accordance with standard research is original and planned
0,0% 5,0% 10,0% 15,0% 20,0% 25,0%
2009 2010 2011 2012
Novartis - ROS
Novartis - ROA
Novartis - ROE
Richter - ROS
Richter - ROA
research or the knowledge gained in utilizing in order to design new or substantially improved materials, devices, production of products, processes and services, even in the marketing of products and use prior to the start (ROBERT, 2009). If an entity cannot be clearly separated the research phase of an internal project to creating an intangible asset from the the development phase, so the company can also manage its cost such a way as if those only would have been incurred in the research phase (KAMAL, 2005). Generally, the R&D projects – including the basic and applied research – are always embedded in the larger scope of innovation management (SEBASTIAN et al, 2009). Both Novartis and Richter has invested several million forint and dollar into the R&D field and various development projects – significant part of connected costs appear outside the expenditures, also among the intangible assets if those meets requirements of IAS 38. As regards the investment policy, although within the estate of Novartis the share of fixed assets approached the eighty percent in the latest years – until then with the exception of the year 2010, when Novartis could reach remarkable product portfolio growth by the acquisition of Alcon – in the case of Richter there was greater relative role of the producers and developers investments. This can be explained by the difference which can observe in the investment policy that the Swiss pharma producer placed more emphasis on acquisition of financial instruments, in spite of this the Hungarian company focused on graduating expansion of existing generating capacities. Consequently in 2010, during the acquisition of Preglem S.A., a new preparation, the ESMYA intangible asset and goodwill has been recorded, then, from 2011 the complete of the plant building – specialised on biotechnological mammalian cell method and related technological system installation – carried out as a Greenfield investment in Debrecen has already contributed by considerable extent to the growth of the fixed assets in the following year.
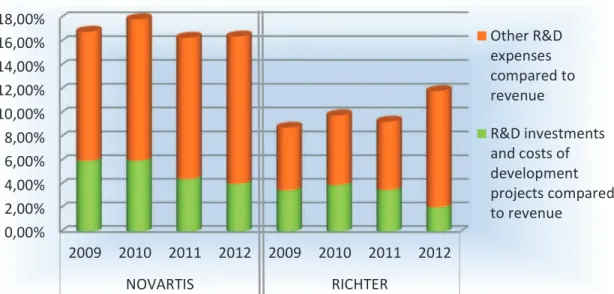
Figure 2: The share of R&D investments and costs turned to the development projects within all the R&D expenses and the share of the latter value within the revenue
Source: own compilation.
Due to the acquisitions and the Greenfield investment were able to increase its fixed assets substantially and inside of this, the extent of intangible assets for both of two companies – only the consolidation of Alcon caused nearly 18 billion USD goodwill growth for Novartis. One part of the costs incurred in connection with research and development activities consist of the personnel (related to employees in group headquarters and locations those specialized in vaccine production) and other material expenses, the remaining part of these make up from the acquisition of material and intangible assets – in the pharma sector mostly computer softwares which help to study of the different molecular structures modelling – these are made up from research and development
0,00% 2,00% 4,00% 6,00% 8,00% 10,00% 12,00% 14,00% 16,00% 18,00%
2009 2010 2011 2012 2009 2010 2011 2012
NOVARTIS RICHTER
Other R&D expenses compared to revenue
investments. The deviation between also the share of the latter values within the net sales (Figure 2), also all the operating and marketing costs of two companies decreased considerably by 2012, primarily due to the investments of Richter in that field. While the Novartis was turning 16-18% of its net sales to product development from 2009 to 2012, its Hungarian competitor could surpass the 10 percent only the last examined year during the same time due to the fact that early this year the European Commission has granted the marketing authorization of the 5 mg ESMYA, so Richter could embark clinical studies concerning the Pill in the third quarter of 2012 in order to facilitate the durable cure that is surgical interference-free and resulting the reduction of benign tumours. Besides of this the earlier noted biotech plant of Richter was also handed over that can keep R&D expenses above level of 10 percent sustainably as a result of industrial production of more complex protein-based preparations – thus the Hungarian pharma company can reach value that indicated at Novartis which stagnated above 16%. As regard the share of R&D expenses within all the operating costs, at none of two companies can already show greater fluctuations: while there were identical trends until 2011, in the following year the role of concerned kind of cost increased by 3% at Richter opposite the Novartis on effect of handed biotech plant.
At determining of the impact of R&D activity on profitability only the related expenses and the net sales revenue surplus associated with marketing of the successfully developed products were considered by me. Nevertheless I did not calculate with the tax benefits, post-tax credit and other benefit provided connection with the research activities has been caused by that I started from the earning before tax at the evaluating of the profitability indicators – for the reason mentioned above. Therefore, the state grants which received to compensate costs similarly cannot be taken into account in the calculation, because, although – unlike the Richter – the Novartis was obtained different amount of state grants after investments and capacity buildings carried out in the USA to purchase material assets – those help to improve new vaccines – and to build other sites in the framework of the American government grant contracts, the effect of these items on earning before tax offset by the costs of purchases which financed by the grants (the accrued grants released among incomes in proportion with the depreciation that deducted from the cost of the purchased assets every year). So only the effect of R&D’s direct and indirect costs may be considered until the realize of revenue growth that is arising from sale of preparations which is newly placed on the market as a result of proving successful experimental development projects, clinical trials and these are under patent law protection.
0,0% 5,0% 10,0% 15,0% 20,0% 25,0% 30,0% 35,0%
40,0% Novartis - Original ROS
before taxes
Novartis - Calculated ROS before taxes without R&D
Richter - Original ROS before taxes
Source: own compilation.
Light of the foregoing, it could be mostly illustrate the impact of R&D in the difference of the indicators, if we examine the changes of the rates for both companies on the condition that the period under view those did not carry out this type of activity. If the result items are adjusted by disregard of the showed net sales of the newly introduced products manufactured exclusively during the examined period, furthermore the accounted R&D expenses in each year, then it can be observe a bigger difference than between the original ROS values. It can be identify from tendencies that – against Novartis – the ROS of Richter – which group primarily specialized in developing of gynaecological preparations – without R&D would higher by 5-7 percent than that in fact. This can be explained by funds of Richter turned to the development projects paid off less than expected, namely the later years these were not associated with such revenue growth that equal or higher than the magnitude of earlier investments, in addition the results of the large projects started in 2012 can only occur naturally in the coming years. At Novartis sales revenue of the newly marketed preparations enhanced the Group’s total net sales by an average of 26 percent between 2010 and 2012, which contribute to its falling trend. As a result the lack of this would have completely neutralized the solvency advantages from possible saving of costs connected with developments. It should mention even tax effect of R&D on the earning after taxation, because this item has been greatly influenced by the tax benefits those are available after research activities and different from country to country, possibilities of tax credit, furthermore the connected costs – particularly in the case of Richter can be considered relevant factors – accounted as tax base reducing items at the corporate tax base and – from 2010 – at the local tax base which became possible by the Act C of 1990 on Local Taxes and the Act LXXXI of 1996 on Corporation Tax and Dividend Tax.
Table 2: Calculated amounts of all the tax saving coming from R&D in million EUR
Tax Saving (million EUR) 2009 2010 2011 2012
Novartis Group 257.7 282.7 61.2 138.9
Richter Group 14.9 16.6 17.6 15.7
Source: Based on IFRS reports of Richter and Novartis, furthermore own calculation at Richter.
Under recent facts partly, the company could available developing tax benefit in present value of about 100 million Ft in the case of investment projects serving basic and applied research or experimental development. On the other hand Richter could ensure itself 10 years from the installation 100% corporate tax saving with the productive investment of value more than 3 billion Ft after the results of the parent company in Hungary. The Table 2 included all the tax saving validated by the support system exclusively resulting from the R&D and recalculated to euro in order to comparability. Extraordinary tax benefit of the Novartis – against Richter – results from its institutional network that considered wide and strength internationally too. All in all, Novartis can distribute its new formulations on markets where demands are less price-sensitive but high solvent, so it can ensure the return on investment of product developments more successfully than Richter.
3.2. Managing of risks arising from R&D by financial and accounting policy
this, on the one hand we seek the answer to that the assets serving the activity and ranking according to terms of liquidity financed by which structure and origin of liabilities, furthermore which corporate financing policy can observe behind of this in the long run, on the other hand in what extent the cost of acquisition of foreign resources affects the results, so the profitability. Two indicators those expressing the mostly the asset financing are the coverage of non-current assets and the rotation speed of the current assets decreased by short-term liabilities, namely the net working capital. The results of the previous indicator (from 101% to 123% at Novartis and from 275% to 433% at Richter) clarify that the non-current assets of both producers are covered fully by the permanently available resources, although the values recorded at Richter exceeds third times the data of its Swiss competitor which already refers that Novartis – against more conservative and prudent financial strategy of Richter – use more aggressive or so-called solid policy that is better suited for the fit principle: its term working capital fixing financed by long-term sources much lower than Richter, which allows also riskier operation in case of Novartis.
Table 3: The ratio of net working capital within the all asset
Source: own compilation.
The ratio of net working capital decreased by 2011 due to the restructure performed in the assets that result at Richter the acquisition of Grünenthal and PregLem S.A., and the share purchase transactions in the Protek Group which is Russia’s largest pharmaceutical wholesaler, while that at Novartis the increasing non-current asset ratio owing to the consolidation of Alcon and the rise of equity also was not able to offset – even nor with a long-term borrowings.
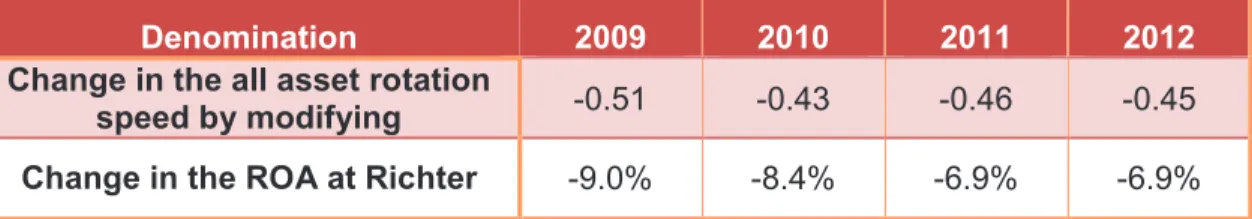
Table 4: The all asset rotation speed of Richter calculated assuming the ratio of net working capital of Novartis
Denomination 2009 2010 2011 2012
Change in the all asset rotation
speed by modifying -0.51 -0.43 -0.46 -0.45
Change in the ROA at Richter -9.0% -8.4% -6.9% -6.9% Source: own compilation.
Follows from the foregoing that the continuation of market policy of Novartis for acquisitions intensified in 2010 was much riskier in terms of using financial strategy, as in the case of Richter, which was able to reserve allocated in previous years partly to cover of this. The high net working capital certified strong solvent position and at the same time ensured to pursue more flexible financial policy for both groups. As the ROA is affected by the all asset rotation speed so the effect of different financial strategy on ROA can also be illustrated if the ratio of average net working capital of Richter modified to the same index value of Novartis in such a way that the size of total assets and the net working capital rotation speed is left unchanged and we solely wish to express the net sales in
Denomination 2009 2010 2011 2012
Net working capital / The all asset (%)
Novartis 14.9% 1.6% 0.8% 3.2%
rotation speed, thus the ROA would much lower if Richter continued as the same financial policy as the Swiss producer. From this it can define that the different ratio of current assets financed by permanent sources significantly contributed to the fact that Richter was able to use its asset more efficiently than Novartis almost all the time. Besides that the two groups had to endure high risk arising from the different foreign currency exchange caused by cross-border sales, which cover with derivative assets.
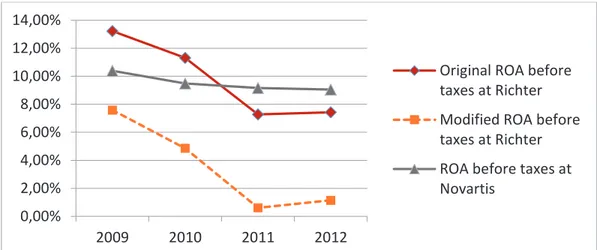
The impact of accounting policy can also remarkable in terms of profitability. If other expenditures of Richter would rise so far as by which more provisions are separated by the Novartis in a percentage of total asset compared to Richter, so the ROA of Richter would lower by 6% in average than otherwise in all the examined period (Figure 5). Although provisioning is accounted against profit, in fact, thereby Novartis can decrease its higher operating risk exposure – resulting from the uncertain outcome of researches – and to offset the Richter’s benefit resulting from its prudent financial policy.
Figure 4: The calculation of return on assets (ROA) of Richter next to the provision ratio of Novartis
Source: own compilation. 4. Proposals and summary
The Richter would able to decline its disadvantage against Novartis in terms of return of R&D investments with that if it corrects its investment policy: as Novartis, in addition to sales, also growing part of its research activities performs in states those provide grants by compensate the acquisition costs for instance in the USA. In that case it would sales its formulas developed in manufacturing technology of higher level next to lower producing costs and – partly due to the demand there that claims less discounts and has lower price sensitivity – higher price reduction benefit compared to its regional competitors. However, for this single or combined use of multiple Japanese management techniques already may be necessary for the majority of companies included in the consolidation. The formers cannot devoid harmonize of the ever-changing trends in the global pharma market and the external market risks arising from the acquisitions with the company strategy. As it can see above, the pharma R&D activity had considerable impact on the long-term firming both individually and in comparison: this is mostly also supported by amount of tax saving validated by the aid system and the lower return of research investments at Richter compare with its Swiss competitor. Beside the grants both producers provided for the coverage of the high operating risk arising from R&D and foreign currency exchange: as long as the Novartis enforces the principle of prudence in its accounting policy, the Richter does the same in its financial strategy. All in all, the leadership of two companies show
0,00% 2,00% 4,00% 6,00% 8,00% 10,00% 12,00% 14,00%
2009 2010 2011 2012
Original ROA before taxes at Richter
Modified ROA before taxes at Richter
maximum effort and diligence to promote the pharmaceutical researchers and by this to improve the overall public health situation of the regional and world population.
References
Frank, A. S. and Chee-Ruey, H. (2007) Pharmaceutical innovation: incentives, competition, and cost-benefit analysis in international perspective. Cambridge University Press, Cambridge, pp. 3-10.
Kamal, G. (2005) Contemporary Auditing. Tata McGraw-Hill Publishing Company Limited, New Delhi, p. 143.
Luc, S. and Tarnóczi, T. (1995) Vállalati pénzügyek. Lecture notes, Lajos Kossuth University, Debrecen, pp. 43-110.
Robert, K. (2009) IFRS: A Quick Reference Guide. Elvesier Ltd, Oxford, p. 88.
Thomas, G. (2007) Health Economics and Financing. John Wiley & Sons Inc., London, pp. 260-261.
Sebastian H. and Claus B. (2009) Impact of Big Pharma organizational structure on R&D productivity. Books on Demand GmbH, Norderstedt, p. 31.
Steven, M. P. and Daniel, S. M. (2010) How to improve R&D productivity: the pharmaceutical industry's grand challenge. In: Nature Reviews. [Online], Available:
http://www.nature.com/nrd/journal/v9/n3/full/nrd3078.html#top
[16 April 2014]
Francesco, C. (2013) Pharmaceutical Industry. In: Business Data Insight [Online],
Available:
http://www.businessdatascreener.com/industries/industry-structure/pharmaceutical[20 March 2014]